This repository has been archived by the owner on Nov 2, 2021. It is now read-only.
More graphs will be helpful. #55
Projects
Comments
|
Just saw this site https://againstcovid19.com/singapore/dashboard |
|
Closed by #539 |
Sign up for free
to subscribe to this conversation on GitHub.
Already have an account?
Sign in.
Hi @covid19india ,
As we have patient data with state, age, sex, mode of transmission.
Displaying it with graphs (can be simple bar graph) will bring more meaning out Covid-19 patient data base.
Like by Age upon date:-

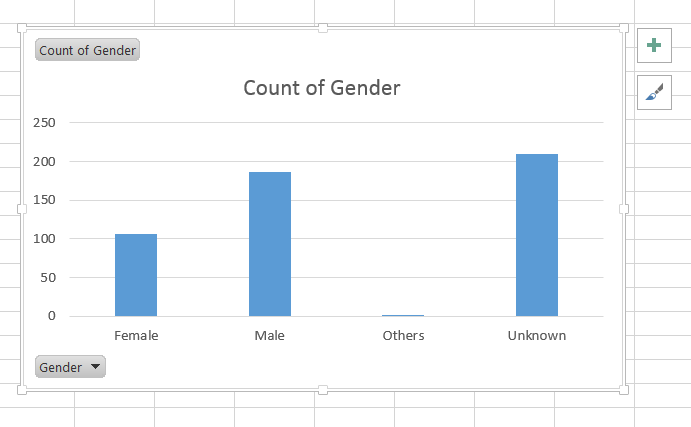
Gender count:-
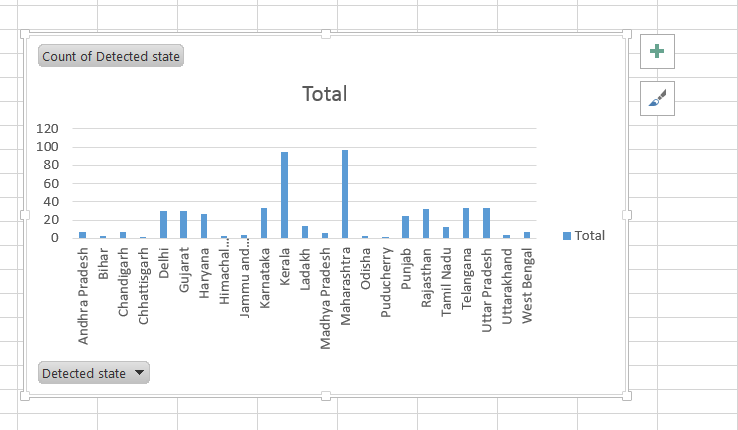
State count:-
Transmission mode.
Here we need classification of mode as Notes columns have freestyle text. It needs to be replaced with fixed types of modes. like:
Of course few of them will require manual entry.
I am working of Excel formula to replace free notes with fixed types of modes.
Thank you,
N Vivek Raj
The text was updated successfully, but these errors were encountered: