Iris is an image processing software that automatically quantifies several features of microbial colonies in high throughput. While most available software can quantify colony size, Iris adds several more phenotypes. Also Iris can be easily expanded to new phenotypes, by writing a new readout module.
That's easy, just follow this link to the latest binary distribution (.jar files), as well as the source code: https://github.com/critichu/Iris/releases/latest
Here you can find some example files to play around with (includes example output)
Iris runs on Java. You can get the latest version by following this link:
[https://java.com/en/download] (https://java.com/en/download)
Iris is written in Java, which makes it compatible with most operating systems (Windows, macOS, *nix). Java software is typically distributed in JAR files (.jar ending), which you can run by a double-click (see below command-line alternatives).
Next, click "open folder", and select a folder which holds the pictures to be processed. Iris will process any pictures with a ".jpg" file ending, displaying any messages on the application window. You can abort the process at any time, by closing the program.
To run Iris as a window (GUI) application, open a command line window, cd into the folder the Iris JAR file is in, and run the following command:
java -Xmx2g -jar iris.jar
Note: the Iris jar file can also be run on all systems by double clicking. Iris will attempt to set the heap space automatically. If you run into "out of memory" error messages, please make sure you have permanently set the maximum Java heap size to 2g (2 Gigabyte). Google on how to do that in your particular system/setup.
To run Iris as a console application (no GUI window), which can be rather useful for scripting, you need to provide Iris with a profile name and a folder that pictures are found in:
java -Xmx1g -jar iris.jar "profile name" "folder location”
NOTE: please keep the quotes when inputting the profile name
Valid profile names are the following:
- "Colony growth",
- "Colony growth inverted",
- "B.subtilis sporulation",
- "CPRG profile",
- "Biofilm formation",
- "Morphology profile",
- "Morphology&Color profile",
- "Xgal assay"
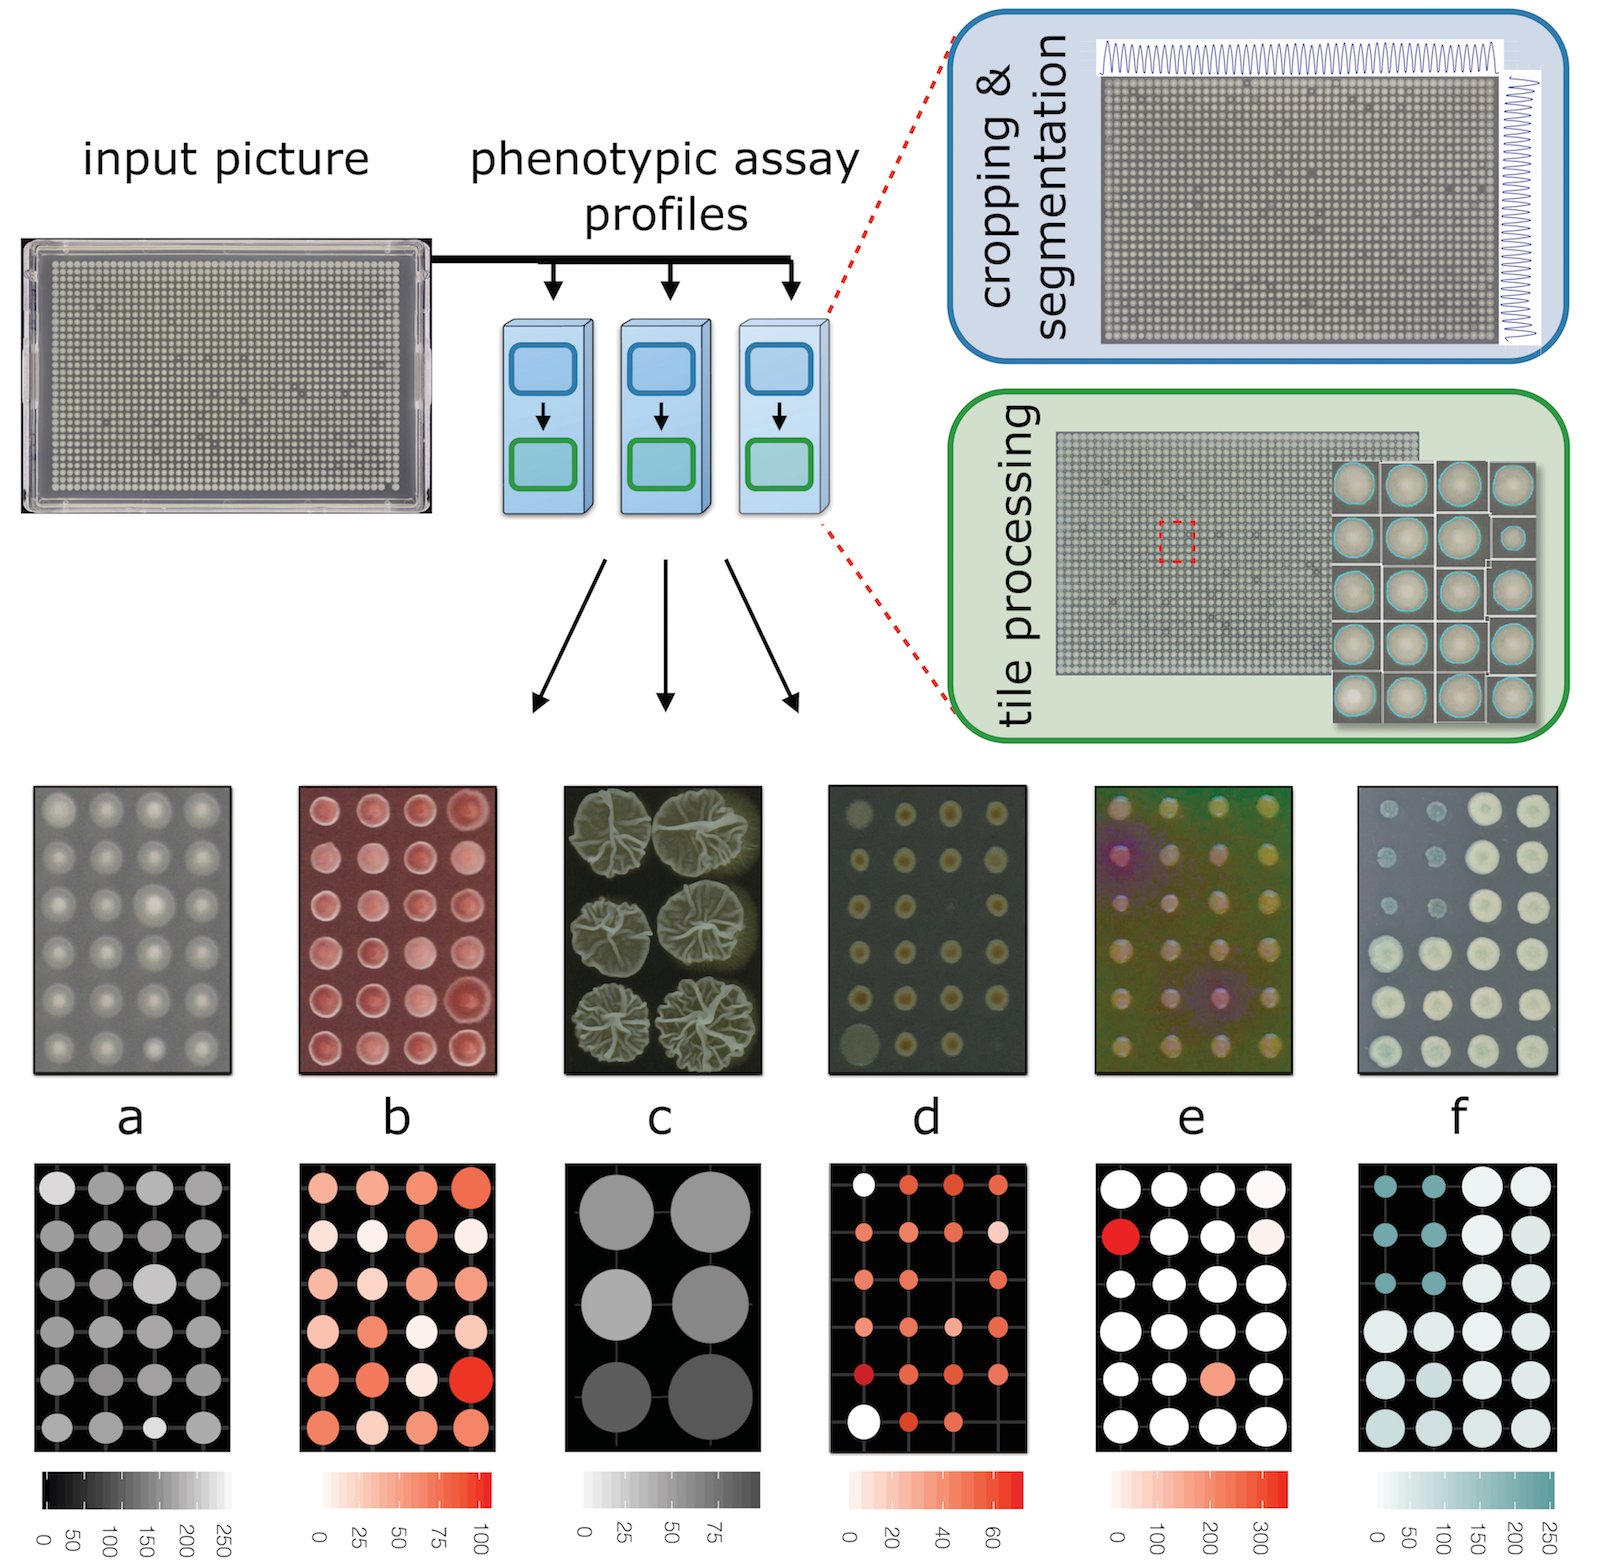
Here is a visual overview of those profiles, and the Iris workflow:
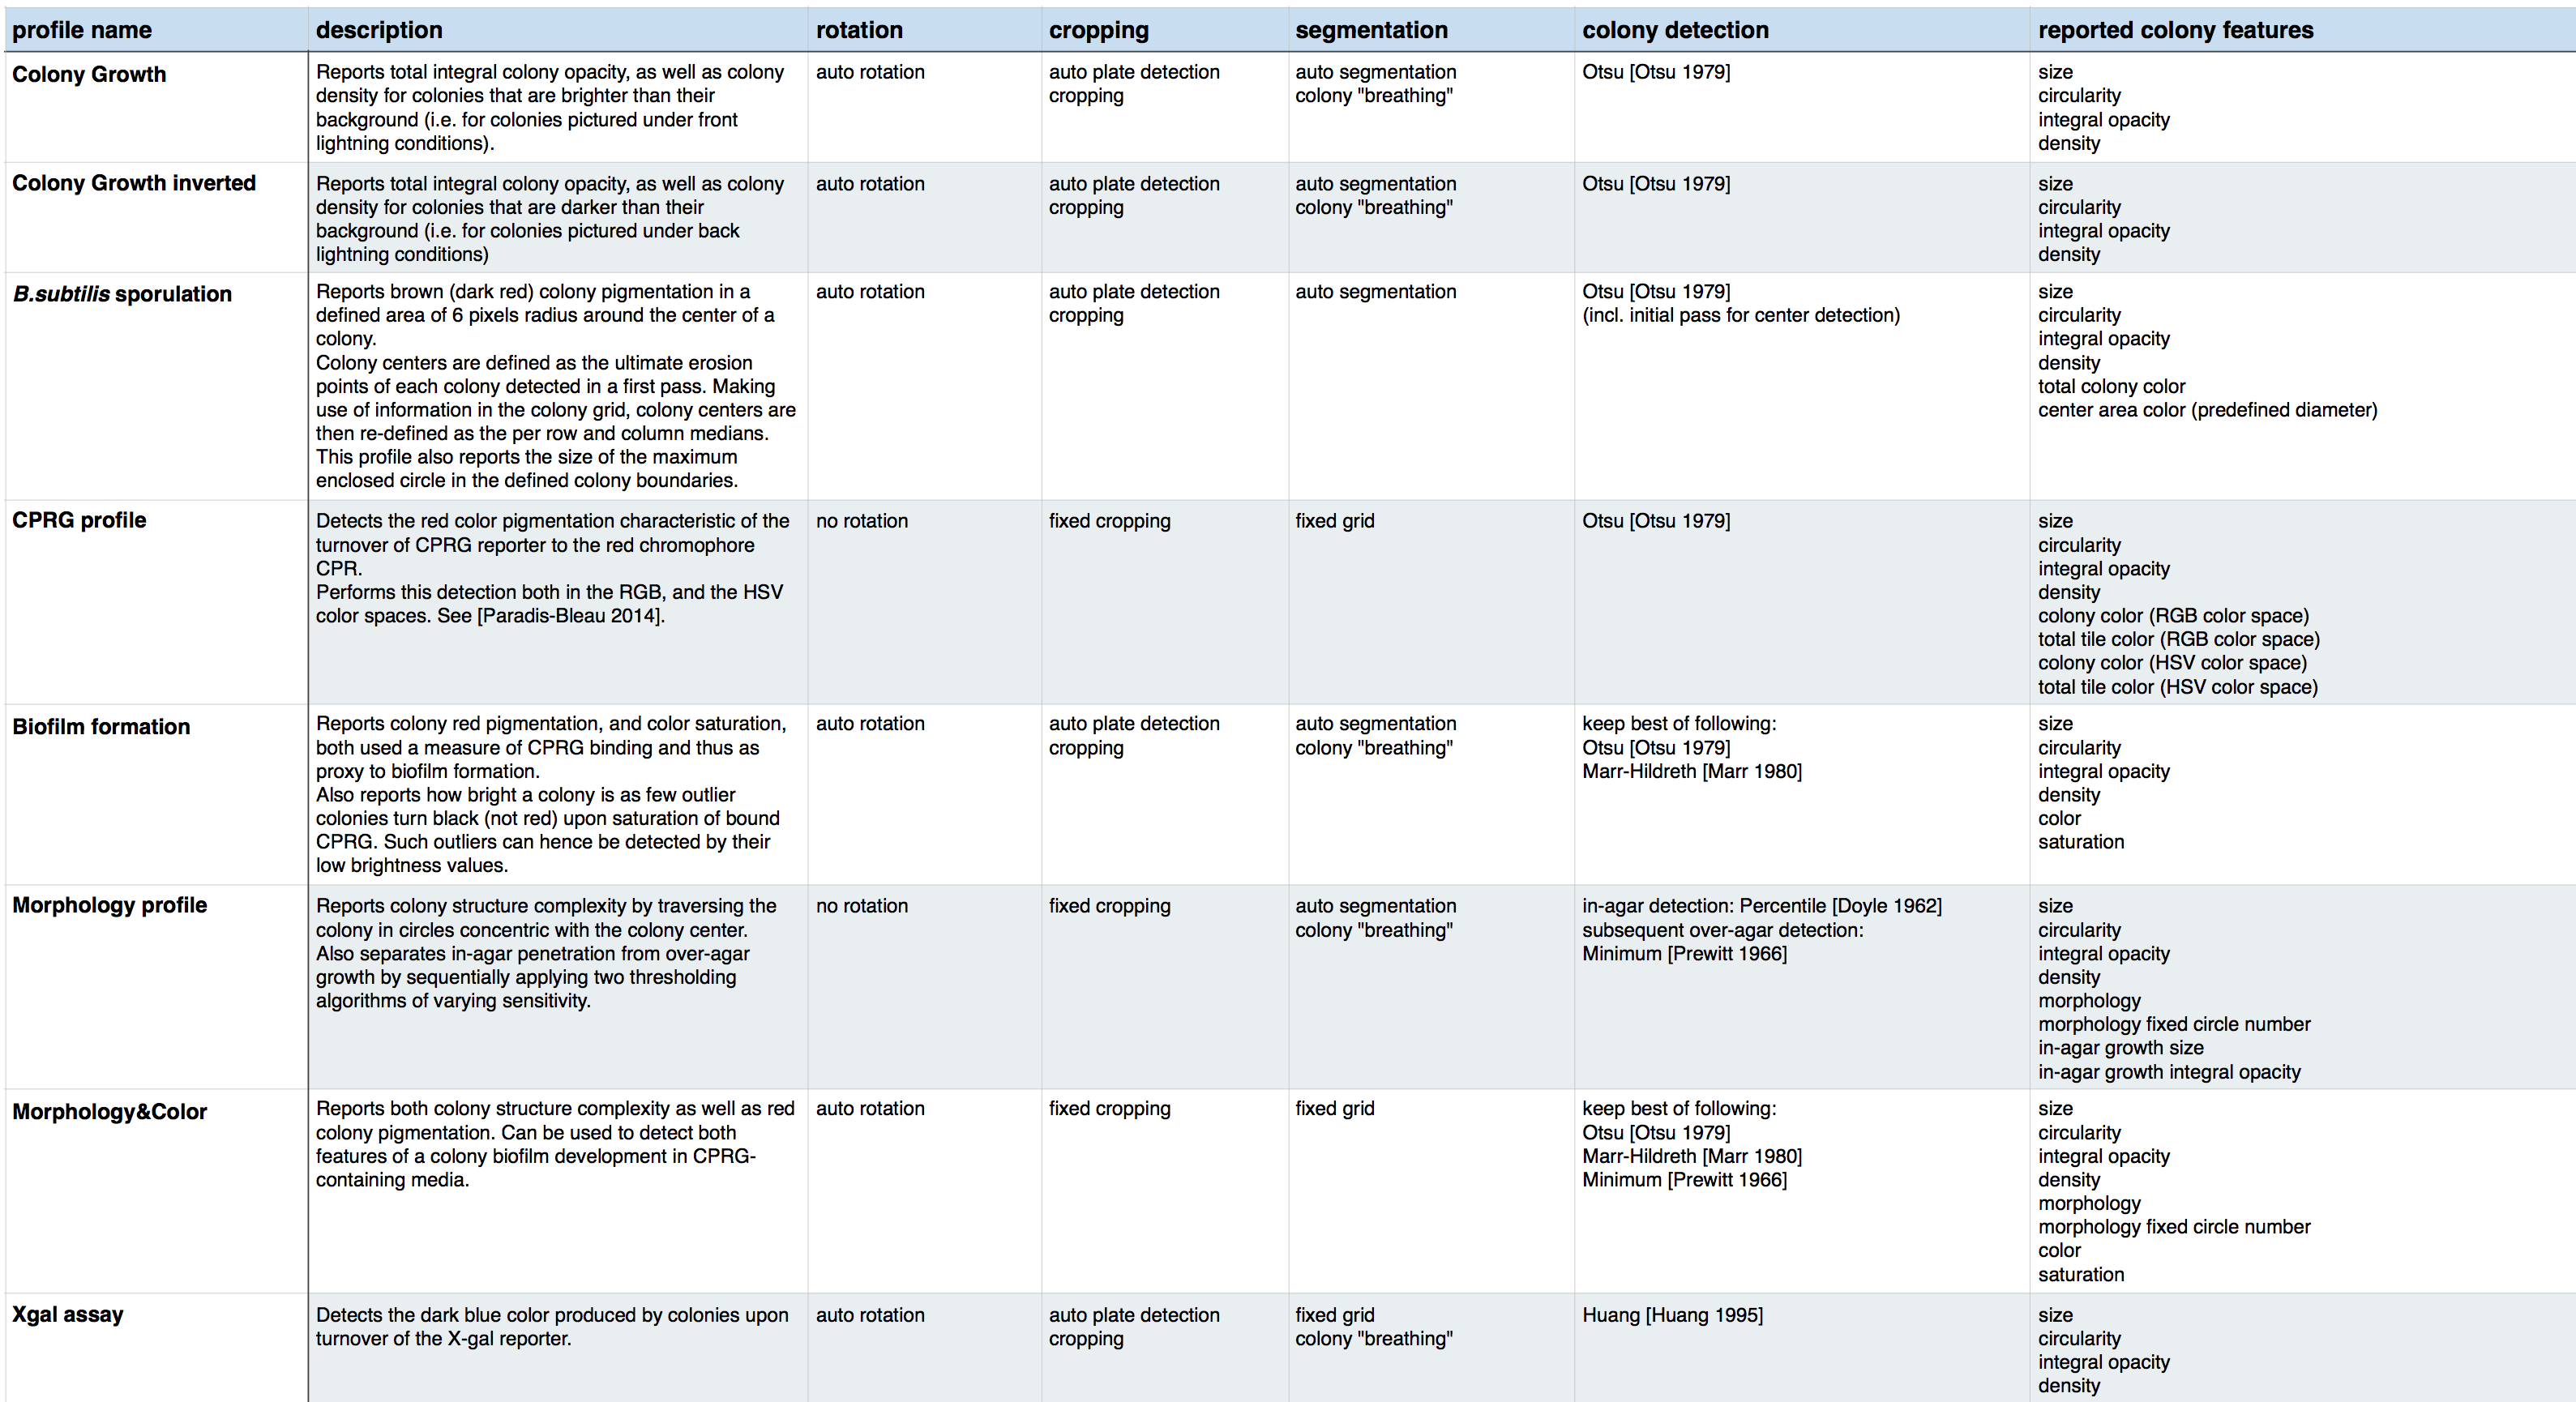
Here you can find a table listing all algorithms used in each Iris profile:
Iris outputs 2 kind of files and a log file.
These hold the results of the feature extraction process. They are in fact plain text tab-delimited files, which can easily be opened with any text viewer or Excel.
these are currently saved mainly for debugging purposes, as they demonstrate the results of gridding algorithm. In grid files, colony boundaries are painted in cyan color, so grid files can also be used to check the results of the colony detection algorithms.
Each time Iris is run, it creates a timestamped log file. This is a text file that is currently used for debugging reasons; any error messages will also be written on this file.
For this you will need:
- a folder containing iris files (can be only one file)
- the name of a column in the iris file
Download these files and extract the zip. On a terminal, change your directory to the unzipped folder, and run the following:
./plot.colony.phenotype.R --folder [folderName] --phenotype [columnName]
This will make pdf files saved next to your iris files.
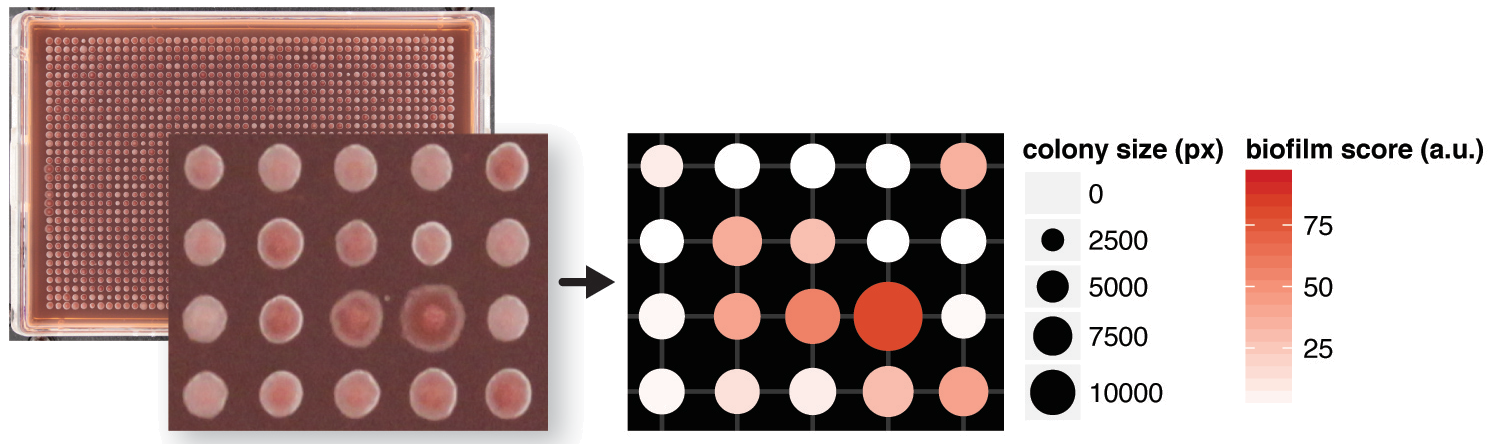
Here is an example of what you can do using this script:
In case your colonies are not in a grid format (96, 384, 1536, or 6144), you can use the Iris' sister software: ColonyPicker. Just double-click on it's jar file, select an iris profile to quantify a colony, and your image file.
How to use it:
- Picking a colony using round (oval) selection will tell Iris to get the features within those manually defined bounds.
- Using a rectangular selection surrounding one colony will get Iris to automatically detect the colony bounds and subsequently analyze this colony.
The kinetics companion tool is written in R and uses the grofit R package to calculate and plot growth curves of various readouts provided by Iris.
The script file kinetics.with.iris.R showcases a number of provided functions, including:
- reading iris files in a given folder, and parsing information in their filenames (see file
load.all.iris.files.R) - plotting the spatial bias of their values (see file
plot.in.plate.format.3.R) - calculating a colony's sigmoidal function fit for a given readout, and plotting the values and Gompertz fit to be saved as pdf (see file
get.colony.growth.rates.2.R)
you can download all scripts and example input and output files here
Iris makes use of the following open source projects:
I thought you'd never ask. Lets take a look under the hood
This is documented in the next page: look under the hood
Since Iris is still under active development, I would greatly appreciate any comments regarding it's performance and/or issues you might encounter.
You can get help on Iris-related questions or issues on the
Iris Q&A forum