Flow diagram editor dgrm.net | NPM
DgrmJS is a JavaScript library for creating SVG flow diagram editors.
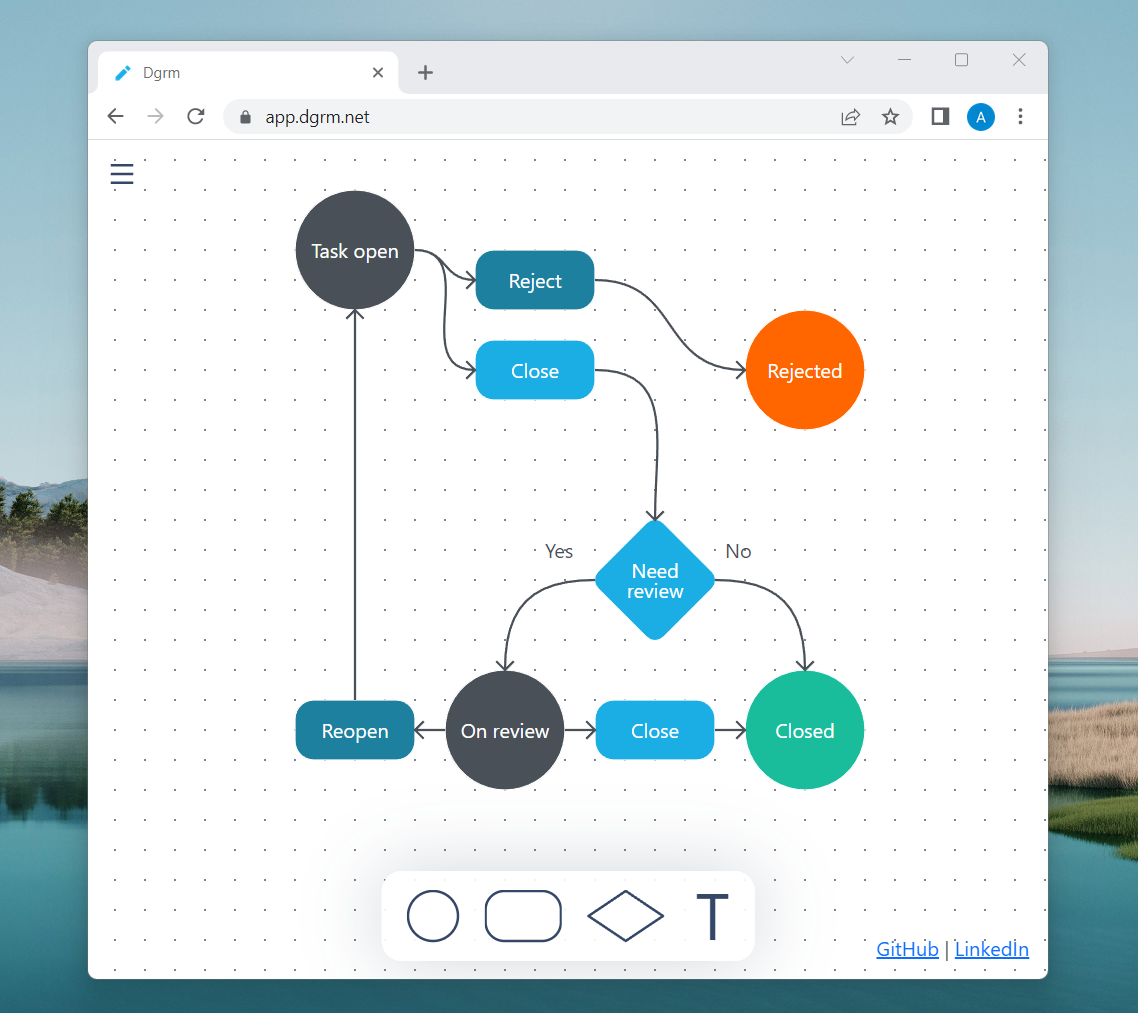
The main goal of the library is to set up workflows in BPM (Business Process Management) systems.
- Works on desktop and mobile
- Has no dependency
- 3.5 KB gzipped
- Allow developers to use standard SVG objects and features to declaratively create shapes that will be used in the diagram.
To create shape, developers should add special data- attributes to standard SVG markup. So any svg images can be used as a shape in a diagram. - DgrmJS dispatch events, like ‘shape is selected’ or ‘shape is connecting to another shape’.
Developers can use these events to implement their own logic, for example, make a JSON description of the workflow.
Free for any type of use. Including commercial projects.
JavaScript SVG diagram editor 6.5 times smaller than Bootstrap
JavaScript diagram editor that renders diagrams from PNG images (open source)
JavaScript text editor for SVG
Flowchart editor UI
JavaScript: Zoom like in maps for SVG/HTML
See a minimalistic example - GitHub repository: DgrmJS Example.
From npm:
npm i dgrm
This is a circle shape:
<svg id="diagram" style="touch-action: none;">
	<defs>
		<!-- shape template 'circle' -->
		<g data-templ="circle">
			<circle ... />
			<!-- inner named element,
			we can use 'data-key' value as a key
			in shapeAdd(...) method -->
			<text data-key="text"></text>
		</g>
	</defs>
	<g data-key="canvas"></g>
</svg>
<script type="module">
	import { svgDiagramCreate } from './diagram/svg-presenter/svg-diagram-factory.js';

	const diagram = svgDiagramCreate(document.getElementById('diagram'))

	// add shape to canvas
	diagram.shapeAdd({
		// template name
		// (value of the 'data-templ' attribute)
		templateKey: 'circle',
		position: { x: 120, y: 120 },
		props: {
			// inner svg element with 'data-key=text'
			// will get 'textContent' value 'Title'
			text: { textContent: 'Title' }
		}
	});
</script>
diagram.shapeAdd method add to canvas shape:
- created by template with name "circle"
- to position at point 120, 120
- props set
textContentof the inner element withdata-key="text"to "Title"
This way you can set any attribute of any shape object.
Result is a draggable circle with "Title" text:

"Out connector" is an element from which you can draw out a connecting line.
Add data-connect="out" to mark element as a out connector:
<g data-templ="circle">
    <circle ... />
    <text data-key="text"></text>

    <!--
        out connector
        data-connect-point - point into shape where connector line starts
        data-connect-dir - direction of connector line
    -->
    <circle
        data-connect="out"
        data-connect-point="60,0"
        data-connect-dir="right" ...>
    </circle>
</g>
"In connector" is an element where you can connect a connection line to a shape.
<g data-templ="circle">
    <circle ... />
    <text data-key="text"></text>

    <!--
        out connector
        data-connect-point - point into shape where connector line starts
        data-connect-dir - direction of connector line
    -->
    <circle
        data-connect="out"
        data-connect-point="60,0"
        data-connect-dir="right" ...>
    </circle>

    <!--
        in connector
    -->
    <circle
        data-connect="in"
        data-connect-point="-60,0"
        data-connect-dir="left" ...>
    </circle>
</g>
In this example:
- we subscribe to the
selectevent - update title of the selected shape
<svg id="diagram" style="touch-action: none;">
    <defs>
        <!-- shape template 'circle' -->
        <g data-templ="circle">
            <circle ... />
            <!-- inner named element,
                we can use 'data-key' value as a key
                in shapeAdd(...) method -->
            <text data-key="text"></text>

            <!-- connectors -->
            <circle data-connect="out" ...></circle>
            <circle data-connect="in" ...></circle>
        </g>
    </defs>
    <g data-key="canvas"></g>
</svg>
<script type="module">
    import { svgDiagramCreate } from './diagram/svg-presenter/svg-diagram-factory.js';

    const diagram = svgDiagramCreate(document.getElementById('diagram'))
        // subscribe to 'select' event
        .on('select', evt => {

            // update selected shape
            evt.detail.target.update({
                props: {
                    text: { textContent: 'New title' }
                }
            });

        });

    // add shape to canvas
    diagram.shapeAdd({
        templateKey: 'circle',
        position: { x: 120, y: 120 },
        props: {
            text: { textContent: 'Title' }
        }
    });
</script>
src/diagram folder contains a diagram engine that can be used independently of other project files.
This diagram engine contains all main features (all you need to implement diagram editor in your project):
- creating shapes with svg templates
- drag'n'drop
- connection of shapes
- diagram events
src/diagram-extensions folder contains additional features, like:
- export/import to/from png
- text editor
- editable shape base class
- and other
src/app folder contains diagram builder dgrm.net.
- app`s shapes templates and styles
- json serialization
- ui elements
Soon