Does Vega-Lite Aggregate take place inside Deneb? #86
Comments
|
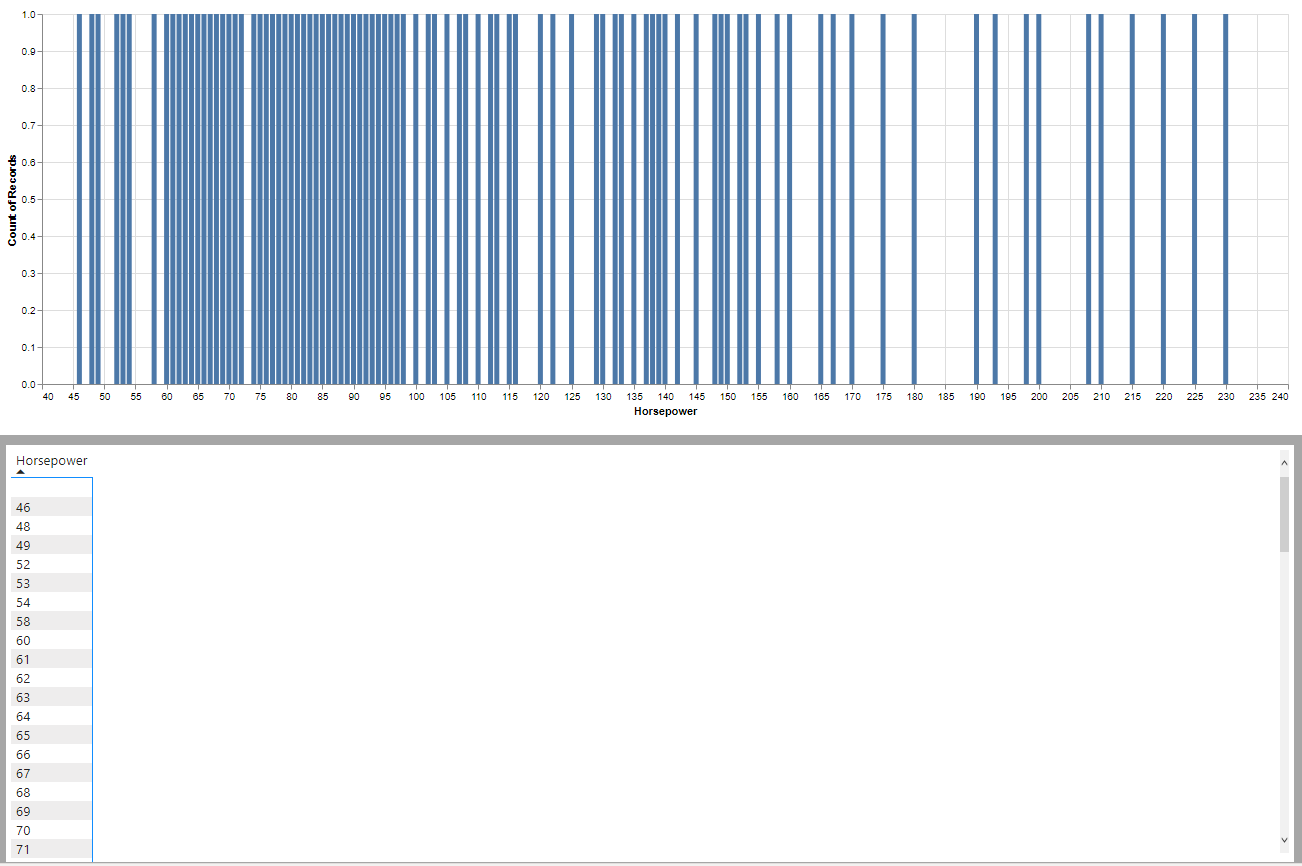
All Vega-Lite aggregates will work, providing that the 'shape' of the data going into the visual match the dataset you're trying to replicate. If you're passing in a single, numeric field to the visual dataset, Power BI will pre-aggregate this to all unique values (or summarise according to the field's behaviour if it's an explicit measure). From looking at the raw data, this has 406 (400 non-blank) rows, yet opting to show your visual data as a table, we see this:
If I take this dataset and add a count of occurrences (as illustrated at this section in this blog post), we can indeed see that Power BI only sends through 94 distinct values, due to the aggregation it applies:
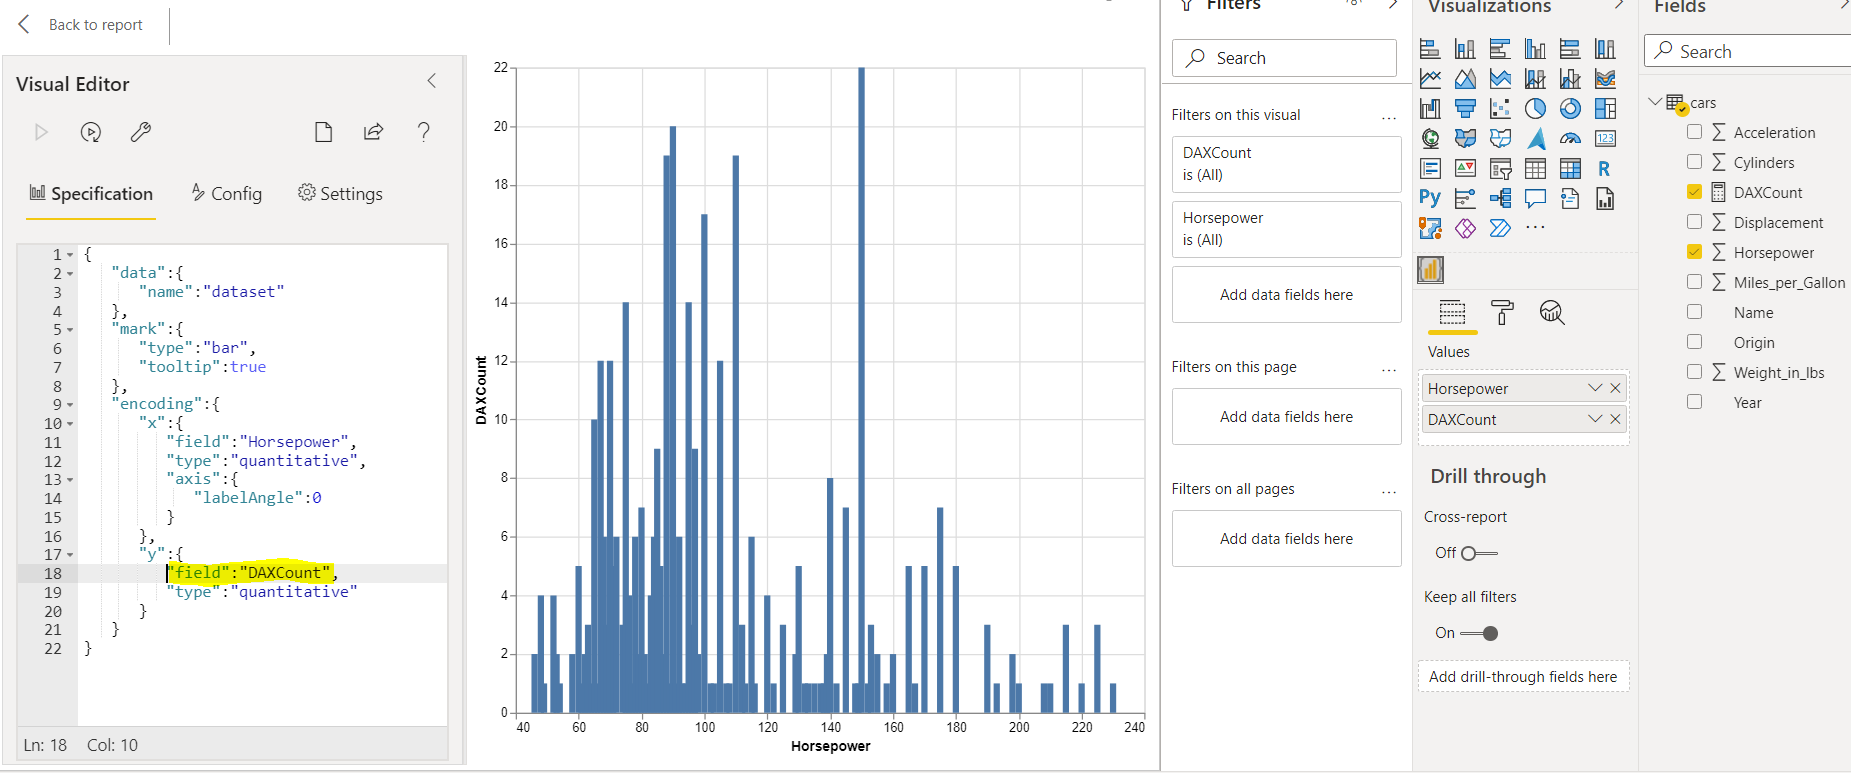
You need to force Power BI to keep all rows unique, so that the spec can do what you want. we do this by adding a column to the dataset that contains a unique value (again, an approach for this can be observed in the same blog post as above). I don't have access to your source data for me to do this in Power Query, so I've just added a calculated column with a random value, but this is enough to force Power BI to treat each value of Horsepower as a unique row (Count is now 1 for each row, which is what we want):
And if I add this column to your visual from the workbook, this will now work with no further changes to the spec:
So, for aggregations to work, you need to force Power BI to treat your data with the same grain as the spec you're trying to copy. This technique will work with R, Python, Charticulator, and other methods that would typically not aggregate the source data so that you can transform it internally. Just in case you wish to verify, I've attached an updated copy of the workbook with the two changes I made (adding an Index column, and adding it to the Deneb visual dataset - I also renamed the page to Also Success 😉 ). You'll just need to unzip this, as GitHub issues don't allow .pbix as a valid extension. |


|
Awesome !!! thanks |
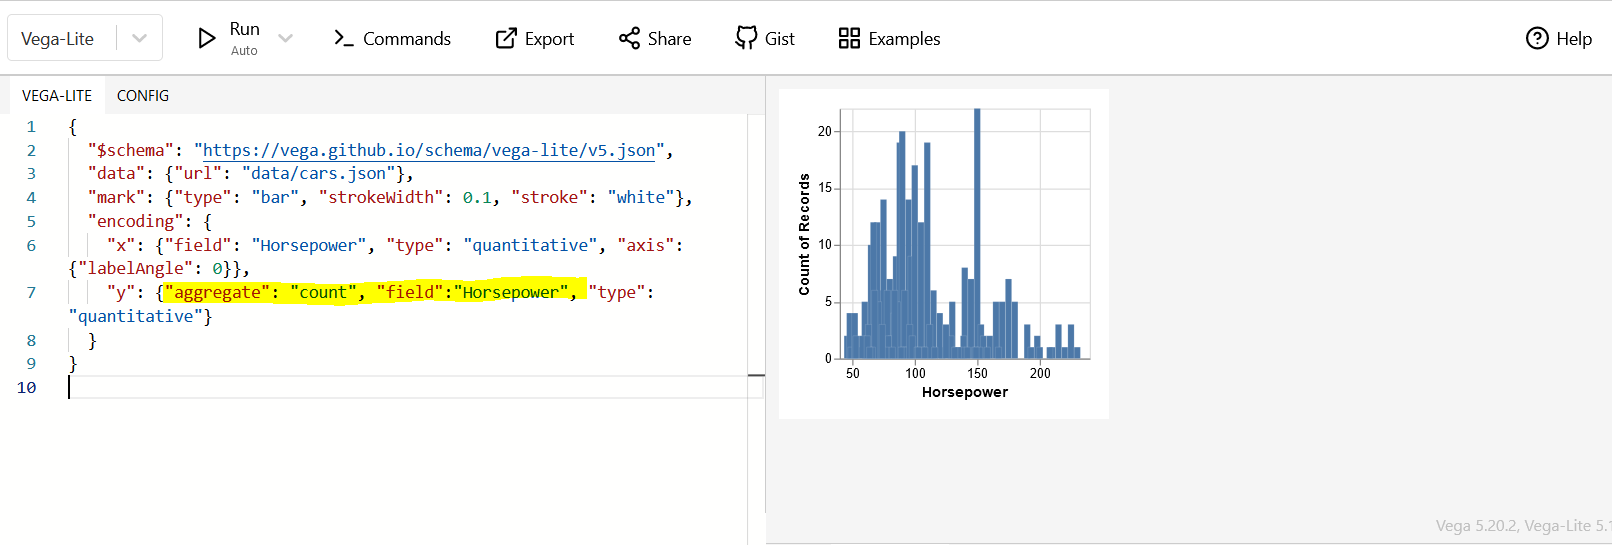
I tried to replicate the following
{ "$schema": "https://vega.github.io/schema/vega-lite/v5.json", "data": {"url": "data/cars.json"}, "mark": {"type": "bar", "strokeWidth": 0.1, "stroke": "white"}, "encoding": { "x": {"field": "Horsepower", "type": "quantitative", "axis": {"labelAngle": 0}}, "y": {"aggregate": "count", "field":"Horsepower", "type": "quantitative"} } }inside Deneb
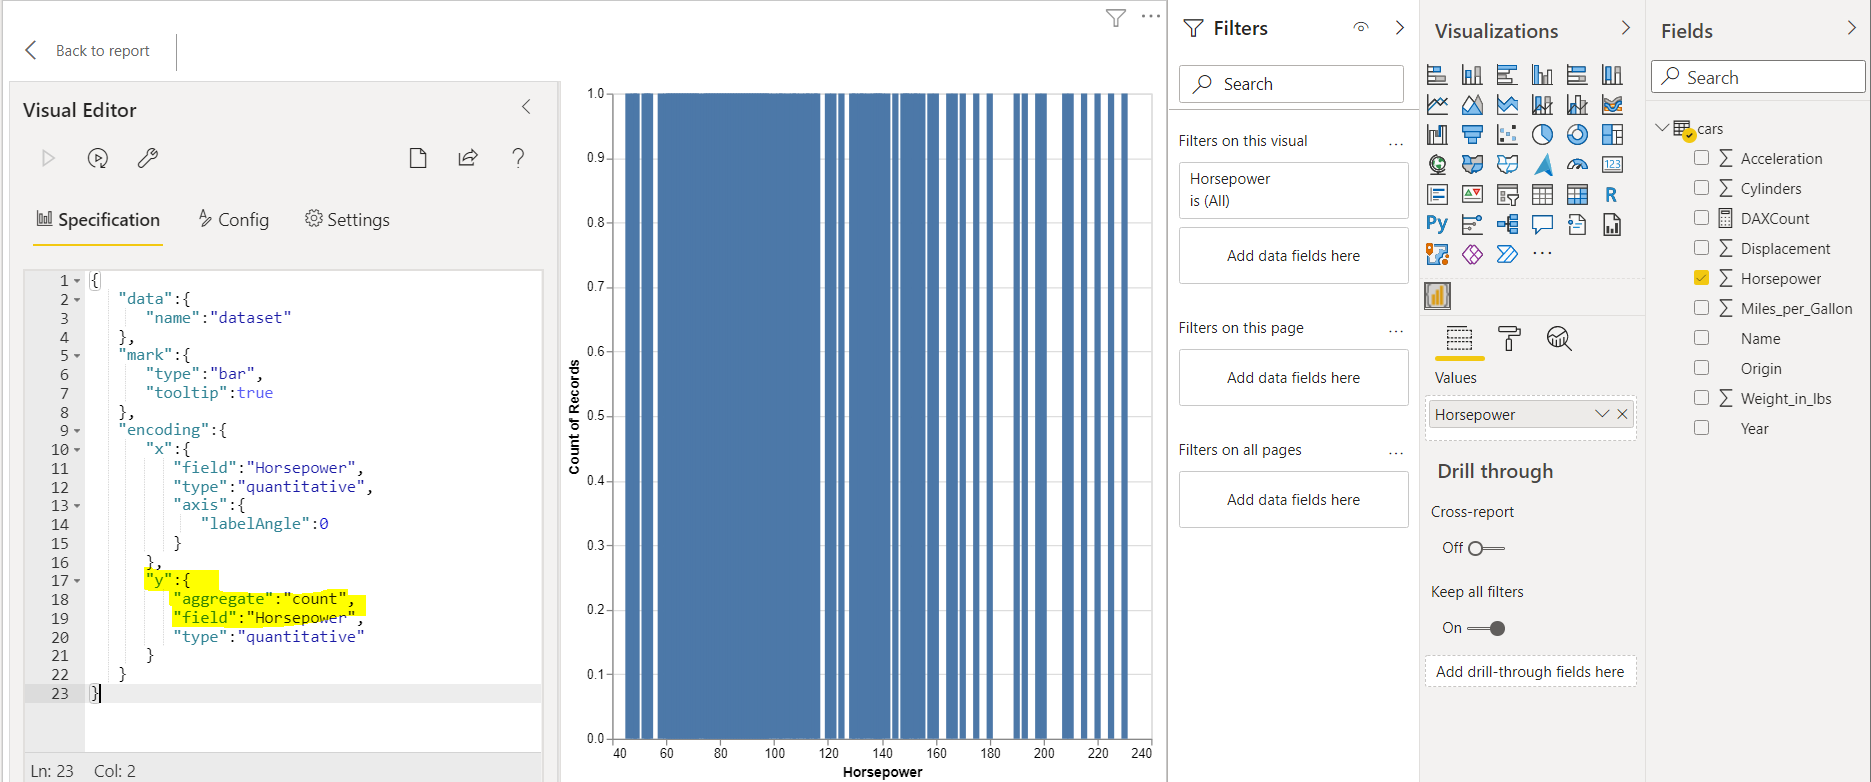
{ "data":{ "name":"dataset" }, "mark":{ "type":"bar", "tooltip":true }, "encoding":{ "x":{ "field":"Horsepower", "type":"quantitative", "axis":{ "labelAngle":0 } }, "y":{ "aggregate":"count", "field":"Horsepower", "type":"quantitative" } } }and it did not generate the same visual.
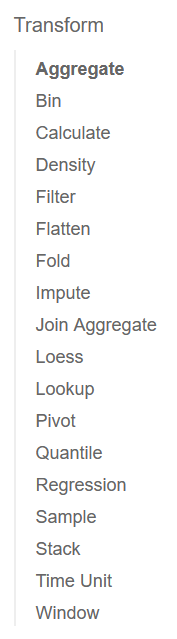
Are Vega-Lite's native Transform (including Aggregate) deemed to work in Deneb?
Link to the pbix file - https://drive.google.com/file/d/17dr_qXqv4Sjk6gkJEAvuJ_ptuR7F0dlT/view?usp=sharing
The text was updated successfully, but these errors were encountered: