Call for contribution: improve multi-core CPU performance of 'hist' #3810
Comments
|
@Laurae2 Thank you for preparing the GBT benchmark. It has been helpful in identifying the problem spot. |
|
@hcho3 Does OpenMP |
|
My guess is that static allocation of work using ellpack would achieve balanced workload with lower overhead than |
|
might be a bit off-topic, do we have benchmark results of We find out the sub-optimal speedup with multi-threading in our internal environment...want to look at others' data |
|
@CodingCat The linked benchmark suite only uses |
|
@hcho3 due to the limitation in our cluster, we can test only with up to 8 threads...but we find very limited speedup comparing 8 to 4..... |
|
@CodingCat You mean 8 threads run slower than 4? |
|
@CodingCat @hcho3 I'll get a look at it using your repository with VTune later. For those who want to get detailed performance in VTune, one can use the following to add to the header: Add the following before what you want to track outside a loop (rename the strings/variables): Add the following after what you want to track outside a loop (rename the strings/variables): And start a project with VTune with the correct parameters for the number of threads. Start the executable with paused instrumentation to do performance analysis. |
|
@hcho3 it's not slower, but maybe only 15-% speedup with 4 more threads...(if I conduct more experiments, I would suspect the results would even converge..... |
|
@Laurae2 looks like I am not the only one |
|
@hcho3 I'll try to get you some scaling results before the end of this week if no one does on I migrated recently my compute server, and I'm re-doing new benchmarks on Bosch on a new machine with 3.7 GHz all turbo / 36 cores / 72 threads / 80 GBps RAM bandwidth this week. |
|
The fast_hist updater should be much faster for distributed xgboost. @CodingCat I am surprised no one has tried to add AllReduce calls so it works in distributed mode. |
|
@RAMitchell I was pretty new when I wrote the fast_hist updater, so it lacks distributed mode support. I'd like to get to it after 0.81 release. |
|
@Laurae2 FYI, I ran your benchmark suite on a C5.9xlarge machine and the results for XGBoost |
|
@Laurae2 Also, I have access to EC2 machines. If you have a script you'd like to run on a EC2 instance, let me know. |
@hcho3 if you don't mind, I can take the challenge to get the distributed faster histogram algorithm, I am currently half time on it in my Uber job and next year may have more time on xgboost |
|
@CodingCat That would be great, thanks! Let me know if you have any question about the 'hist' code. |
|
@CodingCat FYI, I plan to add unit tests for 'hist' updater soon after 0.81 release. That should help when it comes to adding distributed support. |
|
@hcho3 @CodingCat 70d208d#diff-53a3a623be5ce5a351a89012c7b03a31 (PR #3395 has removed |
|
@Laurae2 Looks like the refactor removed a INFO message about |
|
@Laurae2 Actually, you are right. Even though |
|
Issue #3840 was filed. Release 0.81 won't be released until this is fixed. |
|
@hcho3 I'm finding something very strange on my server with fast histogram, I'll let you know the results if tomorrow the benchmark computation finishes (we're talking about huge negative efficiency of fast histogram, it's so huge I'm trying to measure it but hope it doesn't get too long). For approx, the poor efficiency is way better than expected, but I don't expect it to be true for any computer (maybe it gets better with newer Intel CPU generation = higher RAM frequency?). I'll post the data once fast histogram finishes on my server. For information, I'm using Bosch dataset with 477 features (the features with less than 5% missing values). Reached over 3000 hours of CPU time... (at least my server is put for good use for a while) next for me will be to look at https://github.com/hcho3/xgboost-fast-hist-perf-lab/blob/master/src/build_hist.cc with Intel VTune. @hcho3 If you want, I can provide you my benchmark R script once my server finishes computing. I ran with |
|
Please see the preliminary results below, ran 7 times to average results. Make sure to click to view better. Synthetic table provided. Unlike the plots shows, the CPUs were not pinned. The charts clearly seem way different than the ones I was prepared for... (due to how strange the behavior is I'm re-running this with UMA on (NUMA off)). Later I'll check with Intel VTune. Hardware and Software:
Meltdown / Spectre protections: laurae@laurae-compute:~$ head /sys/devices/system/cpu/vulnerabilities/*
==> /sys/devices/system/cpu/vulnerabilities/l1tf <==
Mitigation: PTE Inversion; VMX: vulnerable
==> /sys/devices/system/cpu/vulnerabilities/meltdown <==
Vulnerable
==> /sys/devices/system/cpu/vulnerabilities/spec_store_bypass <==
Vulnerable
==> /sys/devices/system/cpu/vulnerabilities/spectre_v1 <==
Mitigation: __user pointer sanitization
==> /sys/devices/system/cpu/vulnerabilities/spectre_v2 <==
Vulnerable
xgboost Exact speed: xgboost Exact efficiency: xgboost Approx speed: xgboost Approx efficiency: xgboost Histogram speed: xgboost Histogram efficiency: |


|
Looks like a problem with multiple sockets. |
|
As commented in #3957 (comment), I tested the commits a2dc929 (pre CPU improvement) and 5f151c5 (post CPU improvement). I tested using my Dual Xeon 6154 server (gcc compiler, not Intel), using Bosch for 500 iterations, eta 0.10, and depth 8, with 3 runs each for 1 to 72 threads. We notice a performance increase of about up to 50% (1/3 faster) for multithreaded workloads at peak performance. Here are the results for before #3957 (commit a2dc929):
Here are the results for #3957 (commit 5f151c5):
Using the efficiency curves, we see the 50% scalability increase (this does not mean the issue is solved: we still have to improve it, if we can - ideally, if we can get to the 1000-2000% range that would be insanely great). Efficiency curve of a2dc929:
Efficiency curve of 5f151c5:
|


|
Thanks @Laurae2, I'll go ahead and pin this issue, so that it's always on top of the issue tracker. There is indeed more work to do. |
|
@hcho3 @SmirnovEgorRu I am seeing a small CPU performance regression on singlethreaded workloads on 100% dense data with the commit 5f151c5 which incurs a 10%-15% penalty overall when doing hyperparameter tuning on X cores x 1 xgboost thread. Here is an example of 50M rows x 100 column random dense data (gcc 8), requires at least 256GB RAM to train it properly from Python / R, run 3 times (6 days). Commit a2dc929 :
Commit 5f151c5 :
Although they lead to very similar multithreaded performance, the singlethreaded performance is hit by a slower training (@SmirnovEgorRu 's improvements still scale faster, reaching in this 50M x 100 case 500% efficiency at 11 threads vs 13 threads before). Excluding the gmat creation time, we have for singlethread on 50M x 100:
|


|
@hcho3 @Laurae2 Generally Hyper-threading helps only in case of Core-bound algorithms, no memory-bound algorithm. What about NUMA - I observed the same problems at DAAL implementation. It requires control of memory usage by each core. I will look at it in the future. What about small slowdown on 1 thread - I will investigate it. I think - fix is easy. @hcho3 At the moment I'm working on the next part of optimizations. I hope I will be ready for new pull-request in near future. |
|
@SmirnovEgorRu Thank you again for your effort. FYI, there was a recent discussion about increasing amount of parallelism by performing level-wise node expansion: #4077. |
|
@hcho3 I will rebench later to check, but from what I could notice there were performance regressions on production environments (especially #3957 causing more than 30x slowdown). I'll check performance results with @szilard also. Open example: szilard/GBM-perf#9 |
|
The multicore scaling and actually also the NUMA issue has been largely improved indeed: Multicore:
Very notable the improvement on smaller data (0.1M rows)
More details here: https://github.com/szilard/GBM-perf#multi-core-scaling-cpu Also the NUMA issue has been largely mitigated:
|


|
@szilard Thank you so much for taking time to do the benchmark! And it's great news that XGBoost has improved in the CPU performance scaling. |
|
Yeah, great job everyone on this thread for having accomplished this. |
|
FYI, here are the training times on 1M rows on EC2 r4.16xlarge (2 sockets with 16c+16HT each) on 1, 16 (1so&no HT) and 64 (all) cores for different versions of xgboost:
|

|
@szilard, thank you very much for the analysis! Good to hear that the optimizations work. P.S. Above I see that XGB 1.2 has some regression against 1.1 version. It's very interesting info, let me clarify this. It's not expected for me. |
|
@szilard, if this topic is interesting for you - some background and results of the CPU optimizations are available in this blog: |
|
Thanks @SmirnovEgorRu for your optimization work and for the link to the blog post (I did not see this post before). To be easier to reproduce my numbers and to get new ones in the future and or other hardware, I made a separate Dockerfile for this: https://github.com/szilard/GBM-perf/tree/master/analysis/xgboost_cpu_by_version You'll need to set the CPU core ids for the first socket, no hyper threaded cores (e.g. 0-15 on r4.16xlarge, which has 2 sockets, 16c+16HT each) and the xgboost version: It might be worth running the script several times, the training times on all cores usually show somewhat higher variability, not sure if because of the virtualization environment (EC2) or because of NUMA. |
|
Results on c5.metal which has higher frequency and more cores than r4.16xlarge I have been using in the benchmark: TLDR: xgboost takes the most advantage of faster and more cores vs other libs. 👍 |
|
I wonder though about this:
the speedup from 1 to 24 cores for xgboost is smaller for the larger data (10M rows, panels on the right) than for smaller data (1M rows, panels in the middle column). Is this some kind of increased cache hits or something that other libs don't have? |

|
Here are some results on AMD: Looks like the xgboost optimizations are working great on AMD as well. |
It is about time to tackle the elephant in the room: performance on multi-core CPUs.
Description of Problem
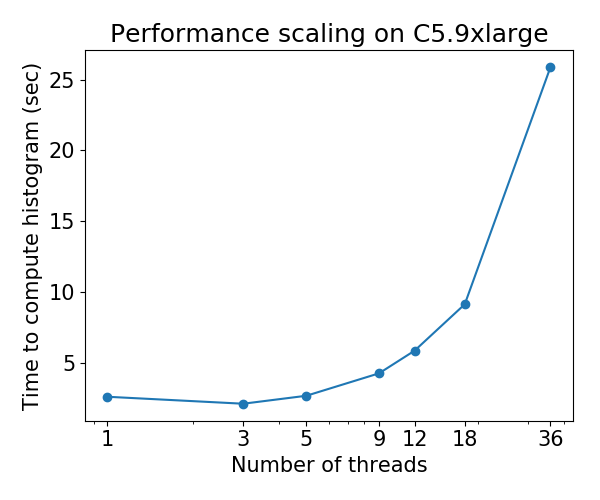
Currently, the
histtree-growing algorithm (tree_method=hist) scales poorly on multi-core CPUs: for some datasets, performance deteriorates as the number of threads is increased. This issue was discovered by @Laurae2's Gradient Boosting Benchmark (GitHub repo).The scaling behavior is as follows for Bosch dataset:
Call for Contribution
I have identified the performance bottleneck of the 'hist' algorithm and put it in a small repository: hcho3/xgboost-fast-hist-perf-lab. You can try to improve the performance by revising src/build_hist.cc.
Some ideas
The text was updated successfully, but these errors were encountered: