Asp.net Core not Collecting Garbage #1976
Comments
The large object heap is likely biting you here. If you allocate objects > 85KB in size then it'll be put in the LOH and get compacted very rarely. See http://stackoverflow.com/questions/8951836/why-large-object-heap-and-why-do-we-care for more details (or https://github.com/dotnet/coreclr/blob/master/Documentation/botr/garbage-collection.md#design-of-allocator if you want to go deeper).
What is your service doing that it's creating such large objects? You should try taking a memory dump before it gets too big, that will clearly show you what objects are sticking around and why it's being held onto (you can use visual studio to look at dumps or a more advanced tool like windbg or perfview). |
|
Try to allocate the array from the beginning rather than calling Enumerable.Repeat |
|
Thanks @davidfowl and @MhAllan for the replies. But this example was a contrived one. I just wanted something that would use a noticeable amount of memory so that I could take a screenshot. The truth is that this is happening with any application regardless of the size of the object in question. And to answer your question @davidfowl, my service was just pulling some data from the database with dapper, and returning the resulting object. It was one row of data for each call. So it took a few days for the memory to grow to that amount. I was actually trying to test the DB when I stumbled onto this peculiarity. I had written a little console app at kept calling the method over and over again. |
|
@zorthgo sure it's not Dapper? If you create your scripts by injecting parameters directly to your SQL scripts like in PHP you'll end up with lot of cached SQL scripts. Here is how Dapper does it |
|
@zorthgo Yes I have also seen this. Was using servicestack in my .net core console app and every time i make a call to the api the memory usage increased by massive amounts 50mb. I assumed it was a VS2017 bug but then confirmed the high usage in the task manager. As zorthgo stated by just making simple calls to api the memory usage increase significantly and does not seem to release memory. |
|
Does this only happen on ASP.NET Core on .NET Core or is it also A problem with ASP.NET Core on .NET Framework? Can you write a similar application using MVC 5 (on System.Web) and verify that you don't see the same behavior? I can't make any progress from this issue in its current state. |
|
In my instance I i was using only target framework .NetCoreApp 1.1 and my console app was referencing an object model in a shared project. |
|
Not sure if this will help anyone. a sample app that calls hellorequest. In this app the startup memory is 85mb , then by repetitive request i managed to push up the memory use to about 145mb. It falls back sometimes to 125mb but then stays there. Not sure if this is normal behavior as I'm not used to .Net Core console apps. i always assumed I was doing something wrong or not instantiating correctly. https://drive.google.com/open?id=0B0Gm-m-z_U84TU5keWFTMzc1ZWc |
|
Facing same issue here on an Asp.Net Core application deployed to production with 3000-5000 active users..the memory on the server increased to 15GB yesterday...i have had to configure IIS to recylce the AppPool every 3 hours while i still try to figure out what the issue is. |
|
Did anybody take a memory dump and look at what is taking up all of the memory in your particular applications? |
|
@davidfowl @Pinox So please, is it related to ASP.NET Core or .NET Core (CoreCLR) ? we will target Full .NET (4.6) that's why I'm asking. |
|
@ikourfaln in my case I was using .net core console app , servicestack (.net core version) and kestrel. The weird thing is the memory use goes up to a level , then it stops suddenly and it does not go up again. I guess best is to test it on your side with small sample and check behaviour. Perhaps @zorthgo can check on his side if he sees similiar behaviour in that memory is used to a certain level and then stops increasing as that is the behaviour that I'm seeing. I have updated my sample app to include @zorthgo example and I dont see the memory running away. It goes up but eventually stops. I did change the source slightly: public object Any(TestGC request) |
|
@Pinox |
|
How about this bug in 2.0? |
|
Any news to this? I'm using Core 2 over Net Framework and this is still happening. Each call to a Controller incresed the used memory, but it never goes down. (I used the WebApi Template) |
|
Hi, I have the same issue with ASP.NET Core 2. I've took a memory dump and tried analyzing. From what I see the problem is exactly as the OP said. My application starts with allocation about 75 MB, and very quickly it goes all the way to ~750MB, out of it 608MB is "Unused memory allocated to .NET". First snapshot at app start: Second snapshot after 3 minutes and 100 requests: |

|
we are also facing same issue, our controller is dealing with large amount of data, ( which is bad design and will be replaced soon ), each call to this controller is causing memory to grow. The memory reduces but only 40-50%( gain 50 Mb, reduces 30-35 Mb ), each call increases memory in range of 10-15 Mb each time. Service is hosted inside service fabric. |
|
It looks like I have a similar issue in our production service (20-100 req/s) using a combination of:
The application has a front-end web server and worker (shown respectively in the graphs below). web server (last 6h) worker (last 6h) They both make use of large byte arrays because the service is acting as an object storage proxy, and consequently puts objects in the LOH. My question is, is this a known limitation of .NET Core at the moment? It seems as though the LOH in never fully cleaned up or fragmented. Having said that, SOH seems to be working fine, as typical web api objects are cleaned up. Any suggestions? Is there a problem with my setup? I've analyzed the code and can't find any glaring memory leaks, and I'm not using anything special outside of ServiceStack library. |


|
@sebastienros - any thoughts on this? Have we observed any similar behavior in our systems? |
|
|
@sebastienros, several questions:
|
We personally haven't seen any evidence that the issue is in Kestrel. It still looks like an application problem.
|
|
how can I investigate if I suffer the same issue? the LOH according redgate memory profiler is almost emty as @sinapis describes but still using easy more then 1gb for just one user |
|
Collect trace and analyze it using perfview. There are number of tutorials by Vance and others on how to trace down .NET memory leaks: https://www.bing.com/search?q=.NET%20memory%20leak%20perfview . https://github.com/dotnet/coreclr/blob/master/Documentation/project-docs/linux-performance-tracing.md has Linux specific instructions for collecting traces. If you believe that there is no memory leak and GC is just keeping more memory around that you would like, you can try:
|
|
Hi, I think i am having the same kind of problem with a .Net Core Web API in production. The application is running on Windows Server 2016 with .Net Core 2.0.3. The machine is a Hyper-V VM with 28 CPU cores and 24GB of RAM. If we don't recycle the IIS application pool often enough, we will eventually use all the available memory. When the application starts using a lot of memory (>=95% of total system memory) the CPU usage also increase strongly (from 2% to 70% sometimes). I am not sure sure if an OOM exception is triggered or not, we always recycle the pool before it happens (the maximum memory usage I have seen was 98% of memory used by dotnet.exe). Analyzing a production memory dump with ".Net Memory Porfiler" (SciTech Software) here is what i found: If this analyze is correct, about 95% of the memory is in "overhead > unused". Here is how this memory profiler editor is describing this category (on their forum): @jkotas I will apply your recommendations (Windows job object, and switching to workstation GC) and I will let you know the result. Please let me know if i can extract any other useful information from the production memory dumps i have. Thanks |

|
@sebastienros I can't share the app, but I can share the session from PerfView session + memory dump. This app jumped to almost 1 GB memory usage in task manager and stayed like that. Looking at the dump I can count about 18 MB:
So the questions is where did almost 1 GB go? |

|
@vtortola question, when you configured the 512Mb limit for your application, did you have an idea of the number of concurrent request you wanted to handle or tested how many concurrent request your app could handle before falling over?? |
|
We did some preliminary and rough tests and checked we could handle 500 concurrent websockets per pod using 512Mb. We ran for hours with 2 pods and 1000 concurrent connections with memory being less than 150Mb . The deployed application, with 2 pods, has between 150 and 300 concurrent connections at any moment, and the memory varies from less than 100Mb on the first few days, till reaching the 512Mb in around 2 weeks. There no seems to be correlation between the number of connections and the memory used. More than 70% of the connections last 10 minutes. |
|
Could you share a memory dump when it's at 100MB and 512MB to see what instances are still alive? |
|
I am afraid I cannot share a dump, since it contains cookies, tokens, and a lot of private data. |
|
Can you compare then locally then? In terms of what object take the most memory, and if their number doesn't correlate to your load. Like if you have 300 connections there shouldn't be 3K connection objects. |
|
Unfortunately the test of setting We have a linux dump of the process, the only tool we have to analyze it is lldb and we are very noob in this matter. Here some data in case it rings a bell: And the result of You can find how Grafana was reporting the state of memory in https://stackoverflow.com/questions/53868561/dotnet-core-2-1-hoarding-memory-in-linux We have another bunch of services in dotnet core that are working flawless, although they do not use websockets. |
|
@vtortola would you mind creating a new issue so we don't fork this one. I think the fact it's using WebSockets makes it unique and we need to create at least a sample app that would behave like yours and stress it over a long period of time. Would you be able to describe what your clients do with the websocket, how they connect to it, and for how long? I could setup an app like this and run it over days, and take memory dumps if I see the memory growing. It might also be some conflict between the GC and Kubernetes, in a way that the GC doesn't get warned that it's close to the pod's limit. |
|
@richlander is working on a similar issue. Rich does this case (read the last 6 comments only) could be related to what you are working on? |
|
if it makes any difference, I have the same (or very similar) issue. I have a dozen+ .net core 2.1 and 2.2 console apps running on docker - each container with a 512mb memory limit, also using websockets (client), and the apps hit the container memory limit every ~3 days. The container then shuts down and restarts. Everything is using authenticated services, so I can't provide what I have, but I might be able to put something together that uses a test site to reproduce the issue. |
|
What parameters do you use to set the memory limites? Just When I test it, I can see it's taken into account very well, never going over the limit I set, even with a super low limit like 16MiB, however it swaps on disk like crazy. And I am testing with an app that does db queries (EF) and Razor views rendering. |
|
@sebastienros absolutely, I created #6803 Let me know if you need more information. |
|
I'm currently experiencing memory issues. After an hour in production all memory is used by the w3wp.exe process (running .NET Core InProcess). Changing the GC to Workstation, did not do the trick for me. After analyzing a memory dump, I found this similar issue, #6102. I'm hoping to test it out in production later today, after upgrading to the latest .NET Core run time, currently 2.2.3. I'll let you know how it goes. |
|
I am having similar problems with memory use. If I set limits on my Linux containers, it just makes it OOM faster. It even happens using the basic templates in Visual Studio. One thing I've found - Core 2.1 and 2.2 are affected. Core 2.0 is not - but it's EOL :( |
|
See above
|
|
Sadly workstation mode doesn't help at all - sadly I'm not really in a position to try one of the 3.0 previews or similiar. |
|
@PrefabPanda make sure you are actually running in workstation GC mode by checking that |
|
Then this could be genuine memory leak. Open a separate issue maybe the best step. |
|
@wanton7 - thanks, I've double-checked and that is definitely set. @DAllanCarr - will do |
|
I am almost certain it's not a memory leak. More like Docker settings might not be enforced correctly and the GC doesn't kick in before the limit is reached. I know that 3.0 introduces fixes in this sense. @richlander does this issue look like something that is known not to work in 2.2? @PrefabPanda would you mind sharing the exact docker version you are using and the docker compose file? I am trying to repro but between docker and docker-compose versions I have a hard time replicating this issue locally. |
|
@sebastienros , @richlander - Thanks for getting back to me. I really appreciate it. My Docker versions: Docker Desktop Community Engine: 18.09.1 See attached the entire test project: Just in case, my Dockerfile: FROM mcr.microsoft.com/dotnet/core/aspnet:2.2 AS base FROM mcr.microsoft.com/dotnet/core/sdk:2.2 AS build FROM build AS publish FROM base AS final docker-compose.yml: version: '2.4' services: docker-compose-override.yml: version: '2.4' services: |
|
@sebastienros - even if there's a way I can put a separate environment variable into the container for the GC to look at, that would work just fine for me. I have tried calling it explicitly, but it doesn't help - I assume even when calling it in code it still sees the wrong memory size of the container/machine. |
|
@PrefabPanda when you said "I have tried calling it explicitly", could you please elaborate what means exactly? GC sees the correct container memory limit if you have one specified, whether it's triggered naturally or induced. if you called GC.Collect(), it will do a full blocking collection; and if you do GC.Collect(2, GCCollectionMode.Default, true, true) it will do a full compacting GC, when this returns the heap is at the smallest size possible, regardless of the container limit or anything else. |
|
Hi @Maoni0 - I've tried GC.Collect(2, GCCollectionMode.Default, true, true) I've just seen another comment saying 256MB is too small for 2.2, but might be 'fixed' in 3.0. Looks like I'll need to experiment some more... |
|
if you've tried GC.Collect(2, GCCollectionMode.Default, true, true) and the memory did not go down as you expect, it means you have a true memory leak. not sure how much tooling is available in your environment. can you run sos commands at all? if so you could always look to see what remains on the heap after your induced GC |
|
Thanks @Maoni0 - bear in mind I'm using a template in Visual studio - there is literally no code of my own in this test project I attached. I've got some other feedback to work through, I'll be in touch. Many thanks. |
|
@Maoni0 - I tried setting the higher limit, no difference. Looks like I'll have to try out the 3.0 preview |
|
I'd like to lock the comments on this issue as it's a very old one that got all its cases treated in separate issues. I commented on this one by mistake thinking I was commenting on #10200 Thanks |
I can't understand why Asp.net core doesn't seem to be collecting garbage. Last week I let a web service run for a few of days, and my memory usage reached 20GB. GC doesn't seem to be working properly. So to test this I wrote a very simple web method that return a large collection of strings. The application started off using only 124MB, but with each time I called the web method, the memory usage kept getting higher and higher until it reached 411MB. It would have gone higher if I had kept calling the web method. But I decided to stop testing.
My test code was this:
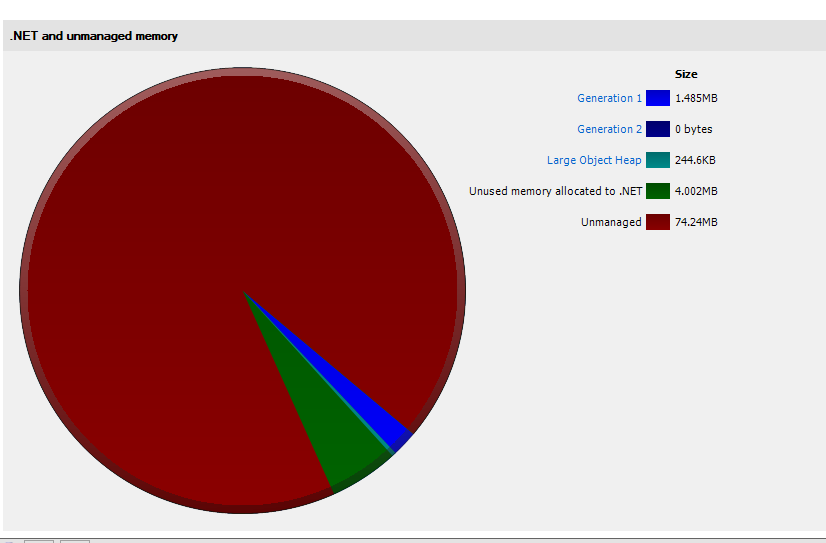
Although I might be overlooking something... To my understanding, the memory usage should not be increasing with every call to this method. After the object is created and sent to the UI, the memory should have been freed.
As you can see from the screenshot below, even after the GC got called, the memory was not released.

Thanks for the help!
Jay
The text was updated successfully, but these errors were encountered: