The newest documentation is now being maintained at debug-memory-leak. This documentation is no longer being updated.
http://localhost:5000/api/diagscenario/memleak/{kb}
In this scenario, the endpoint will slowly start leaking memory (amount specified by {kb}) and eventually will result in an out of memory exception. In order to diagnose this scenario, we need several key pieces of diagnostics data.
Before we dig into collecting diagnostics data to help us root cause this scenario, we need to convince ourselves that what we are actually seeing is a memory leak (memory growth). On Windows we could use the myriad of .NET performance counters, but what about on Linux? It turns out .net core has been instrumented to expose metrics from the runtime and we can use the dotnet-counters tool to get at this information (please see 'Installing the diagnostics tools' section).
Next, lets run the webapi (dotnet run) and before hitting the above URL that will cause the leak, lets check our managed memory counters:
dotnet-counters monitor --refresh-interval 1 -p 4807
4807 is the process identifier which can be found using dotnet-trace ps. The refresh-interval is the number of seconds before refreshes.
The output should be similar to the below:

Here we can see that right after startup, the managed heap memory is 4MB.
Now, let's hit the URL (http://localhost:5000/api/diagscenario/memleak/200000)
Re-run the dotnet-counters command. We should see an increase in memory usage as shown below:

Memory has now grown to around 265MB.
Note that this shows all the counters. If you want to specify individual counters please use the System.Private[counter1, counter2,...] syntax. For example, to display just the gc-heap-counter, use:
dotnet-counters monitor System.Runtime[gc-heap-size] --refresh-interval 1 -p 4923
At this point, we can safely say that memory is leaking (or at the very least is growing and doesn't seem to come back down once request is finished). The next step is now to run a collection tool that can help us collect the right data for memory analysis.
Most commonly when analyzing possible memory leaks, we need access to as much of the apps memory as possible. We can then analyze the memory contents and relationships between objects to create theories on why memory is not being freed. A very common diagnostics data source is a memory dump (Win) and the equivalent core dump (on Linux). In order to generate a core dump of a .net core application, we can use the dotnet-dump tool (please see 'Installing the diagnostics tools' section). Using the previous webapi run, run the following command to generate a core dump:
sudo ./dotnet-dump collect -p 4807
4807 is the process identifier which can be found using dotnet-trace ps. The result is a core dump located in the same folder. Please note that to generate core dumps, dotnet-dump requires sudo.
Now that we have a core dump generated, what options do we have to analyze the core dump? On Windows, we would typically use a combination of WinDBG and SOS and the same strategy applies to Linux (albeit with a different tool set). On Linux, there are a couple of different options with some caveats:
- LLDB/SOS. LLDB is the Linux debugger that must be used when debugging using SOS.
- dotnet-dump analyze <dump_path> provides an SOS REPL experience on the specified core file.
In both cases, you have to be careful to roughly match the environment up with the production server. For example, if I am running .net core preview 5 on Ubuntu 16.04 the core dump must be analyzed on the same architecture and environment.
For the LLDB/SOS experience, please see - https://github.com/dotnet/runtime/blob/main/docs/workflow/building/coreclr/debugging-instructions.md.
To use the dotnet-dump tool to analyze the dump please run:
dotnet-dump analyze core_20190430_185145
(where core_20190430_185145 is the name of the core dump you want to analyze)
Note: If you see an error complaining that libdl.so cannot be found, you may have to install the libc6-dev package.
You will be presented with a prompt where you can enter SOS commands. Commonly, the first thing we want to look at is the overall state of the managed heap by running:
dumpheap -stat
The (partial) output can be seen below:
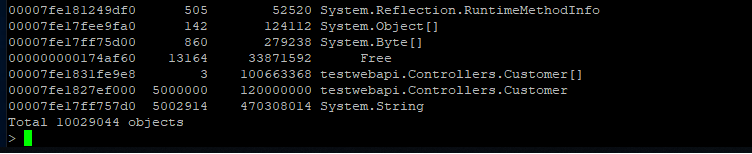
Here we can see that we have quite a few strings laying around (as well as instances of Customer and Customer[]). We can now use the gcroot command on one of the string instances to see how/why the object is rooted:
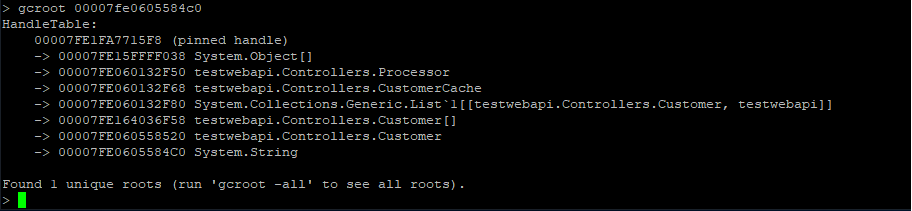
The string instance appears to be rooted from top level Processor object which in turn references a cache. We can continue dumping out objects to see how much the cache is holding on to:
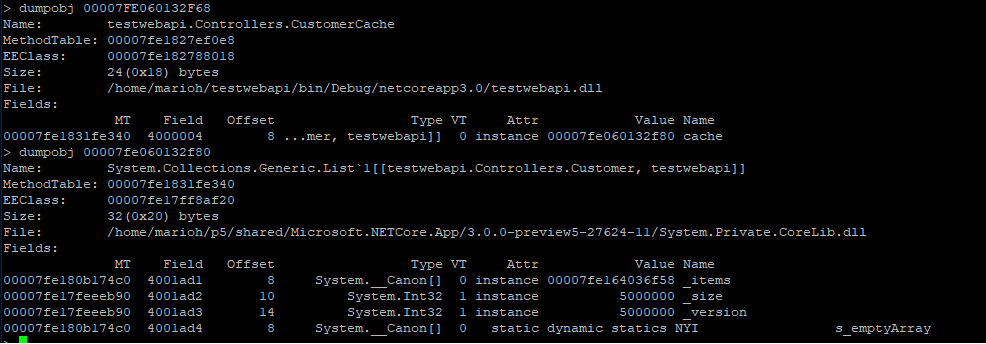
From here we can now try and back-track (from code) why the cache seems to be growing in an unbound fashion.