Elastic stack (aka ELK) is a popular log-aggregation system that gives you a powerful log search and dashboard engine with views across all of your services.
Tye can push logs to Elastic stack easily without the need for any SDKs or code changes in your services.
💡 If you want an existing sample to run, the sample here will do. This recipe will show examples of UI and data based on that sample. You own application will work fine, but the data and examples will look different.
The first step is to add the elastic extension to your tye.yaml. Add the extensions node and its children from the example below.
name: frontend-backend

extensions:
- name: elastic
  logPath: ./.logs

services:
- name: backend
  project: backend/backend.csproj
- name: frontend
  project: frontend/frontend.csproj
The logPath property here configures the path where elasticsearch will store its data.
💡 Tye can successfully launch Elastic stack without
logPath, but ... It's highly recommended that you specify a path to store the logs and configuration (add to.gitignoreif it's part of your repository). Kibana has some mandatory setup the first time you use it, and without persisting the data, you will have to go through it each time.
Now launch the application with Tye:
tye runIf you navigate to the Tye dashboard you should see an extra service (elastic) in the list of services.
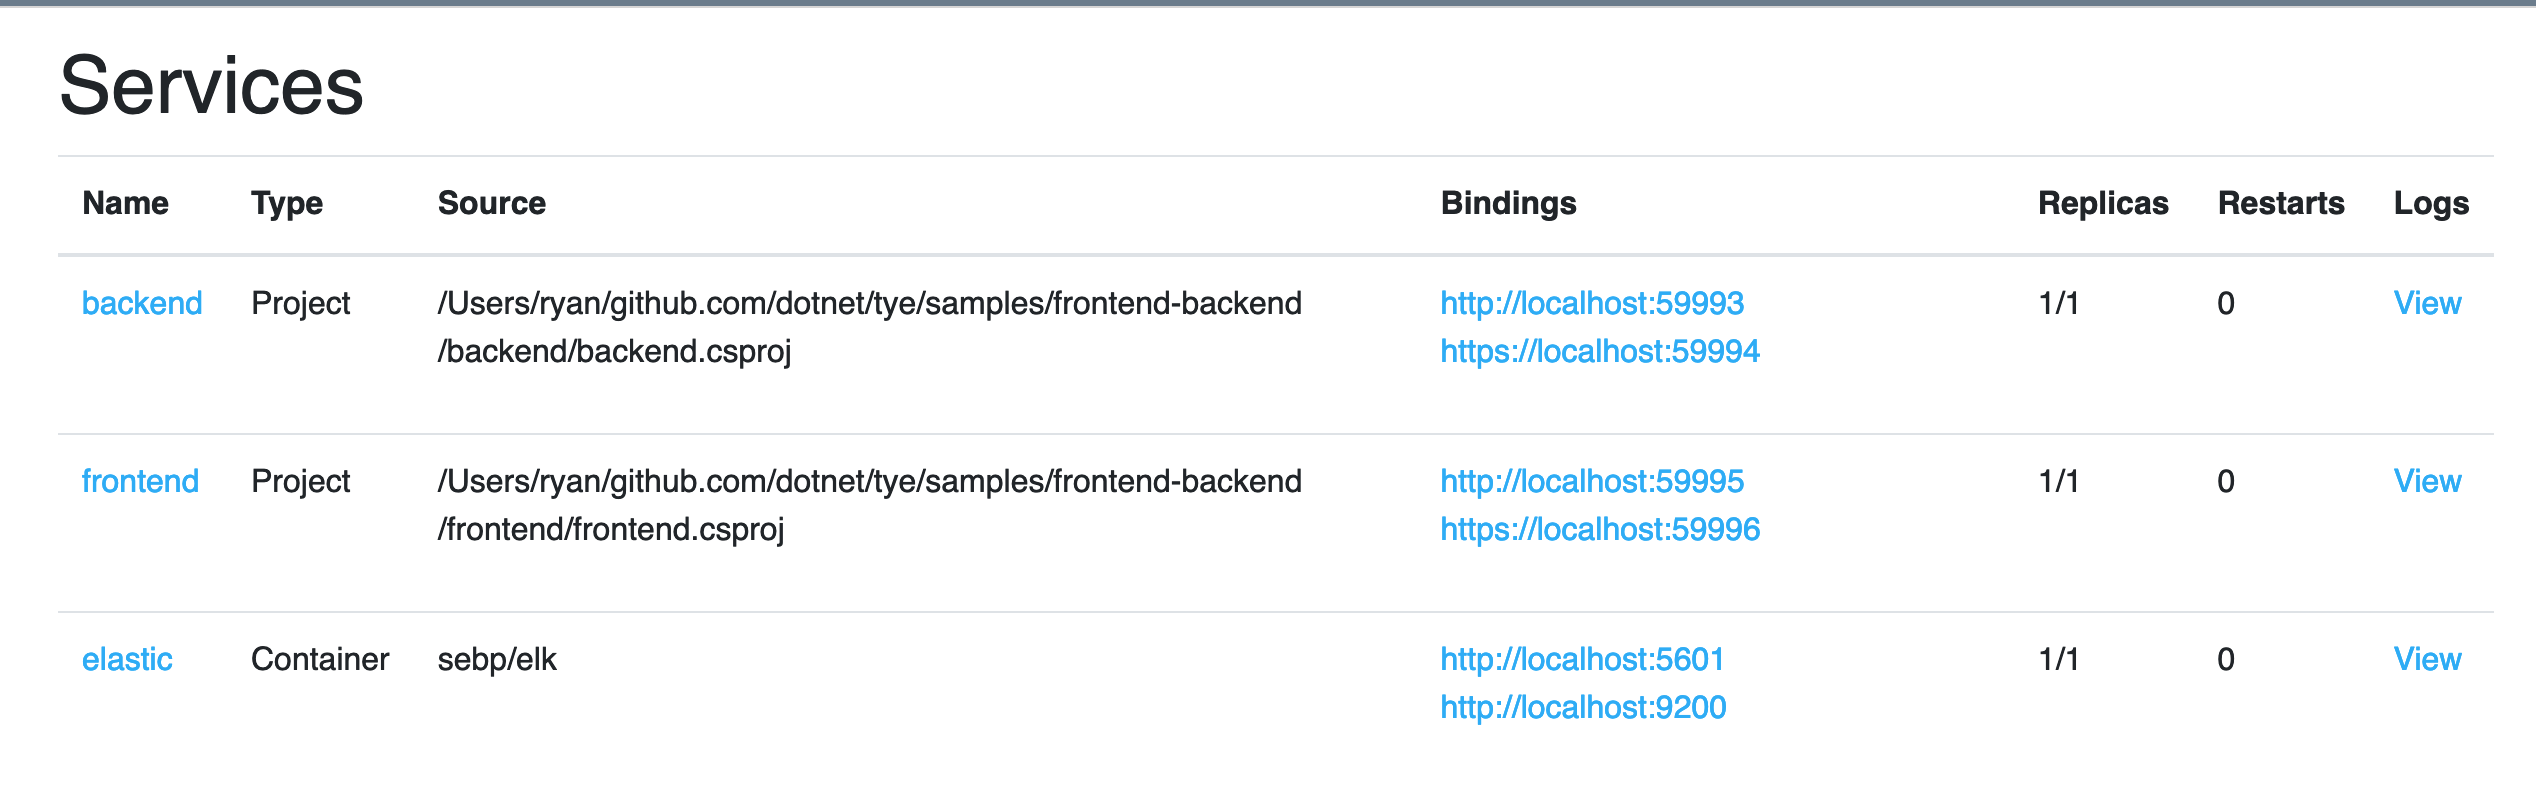
Elastic stack can take 30s to a few minutes to start. Visit the first URI (http://localhost:5601) in your browser to access the Kibana dashboard. This make some patience (you can watch the logs from the dashboard).
Once is up you should see a welcome screen asking you to do some configuration:
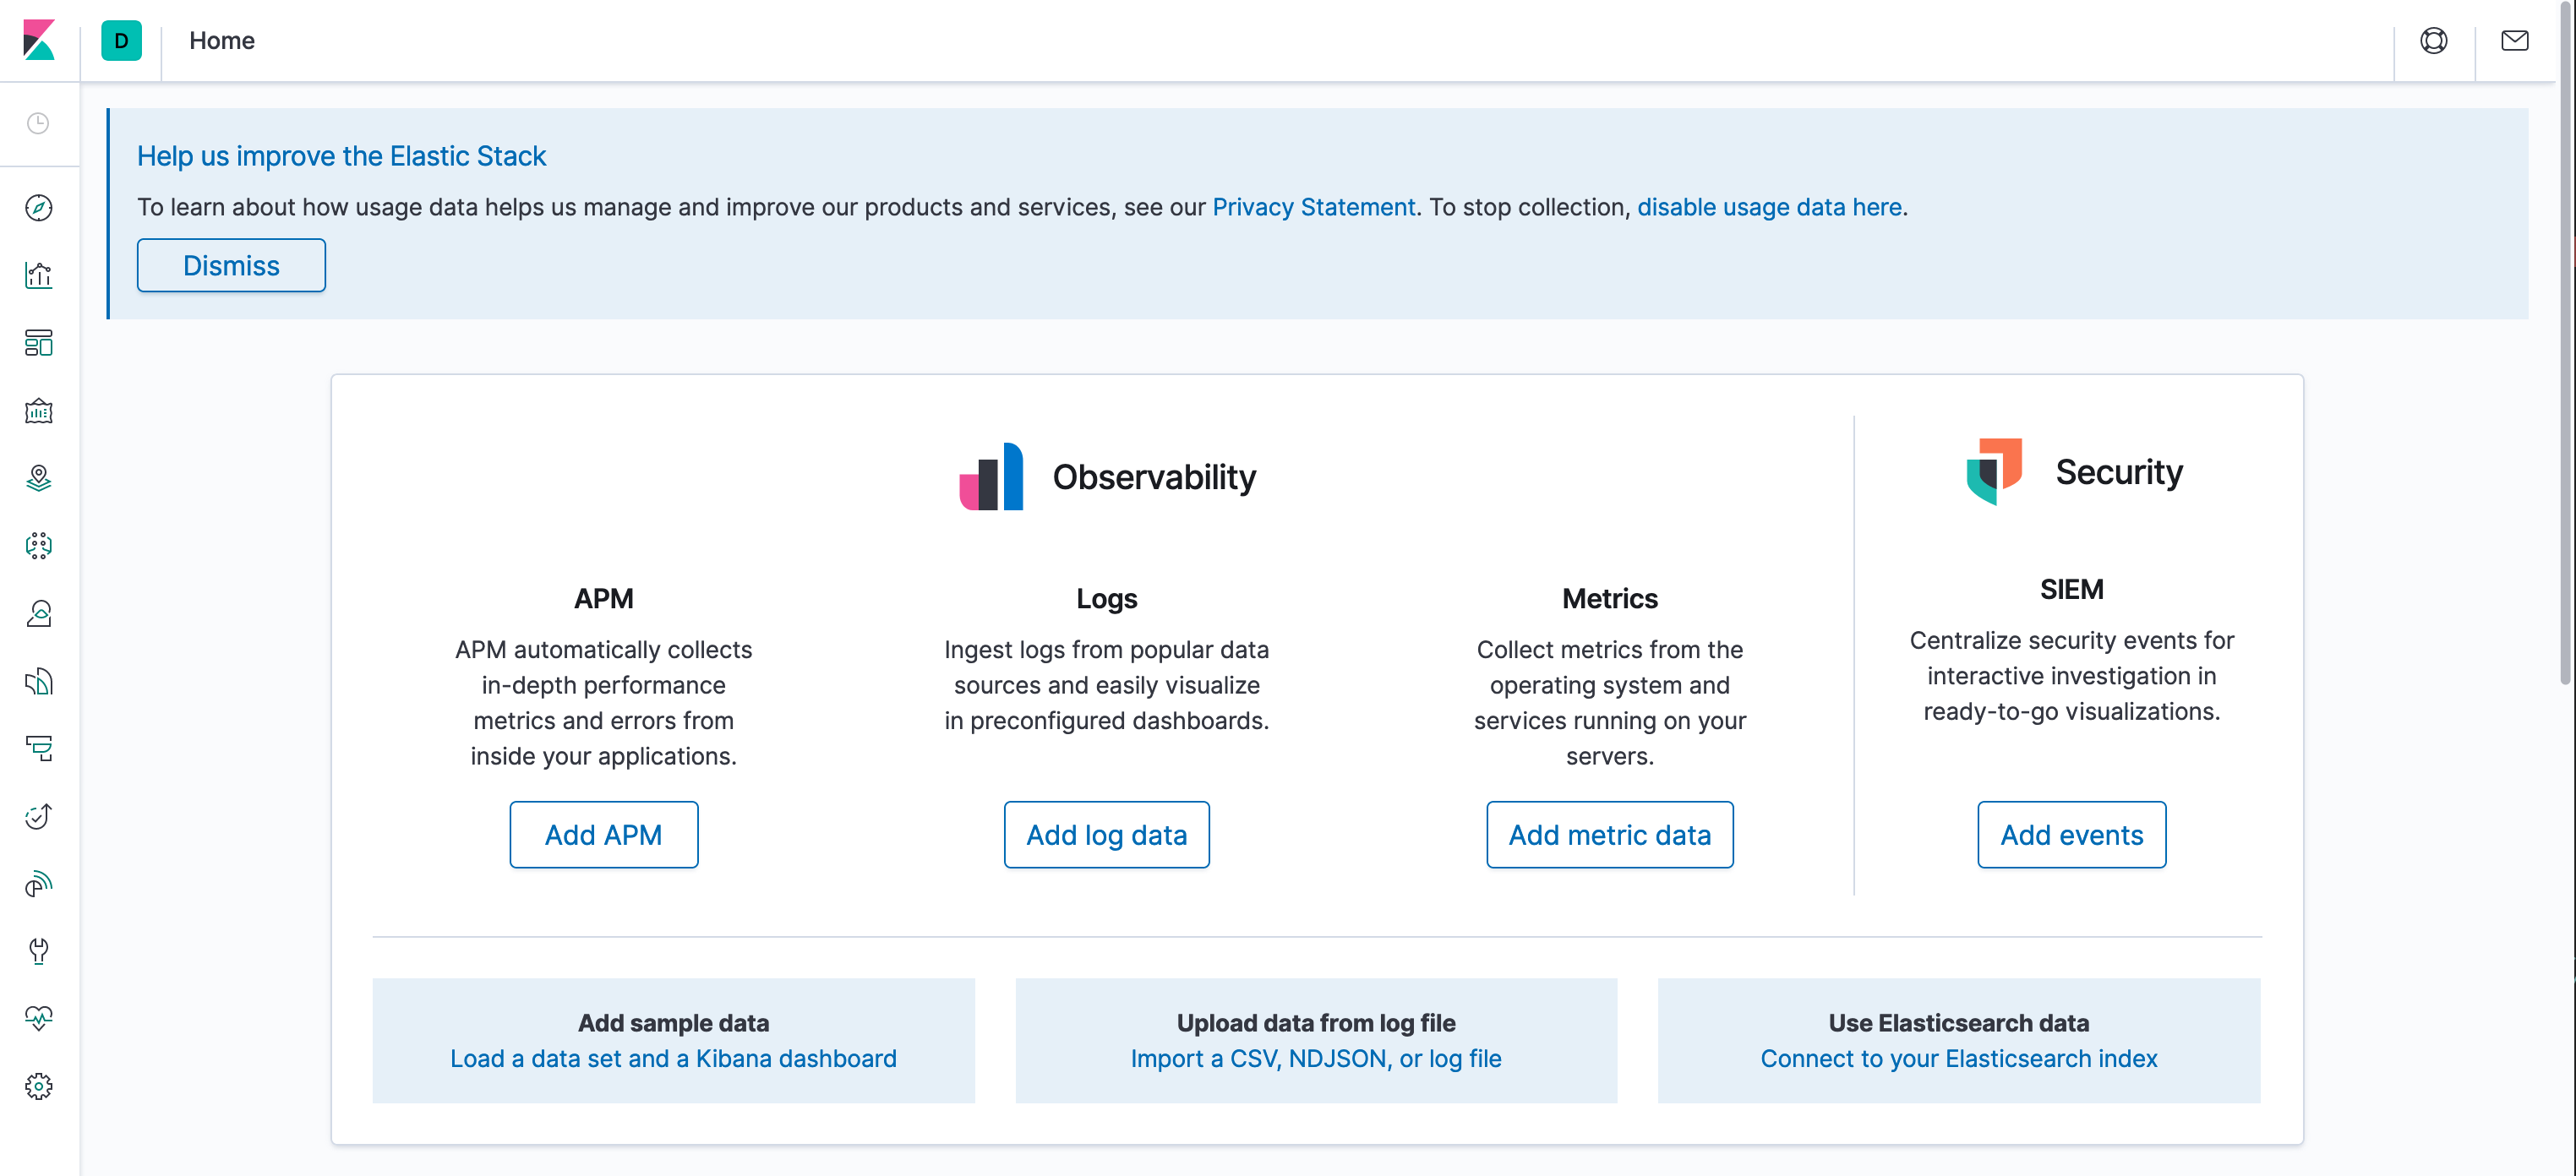
To configure Kibana click on the link near the bottom right of this screenshot: Connect to your Elasticsearch Index.
The next step will ask you to configure the index, enter logstash-* in the textbox and shown below:
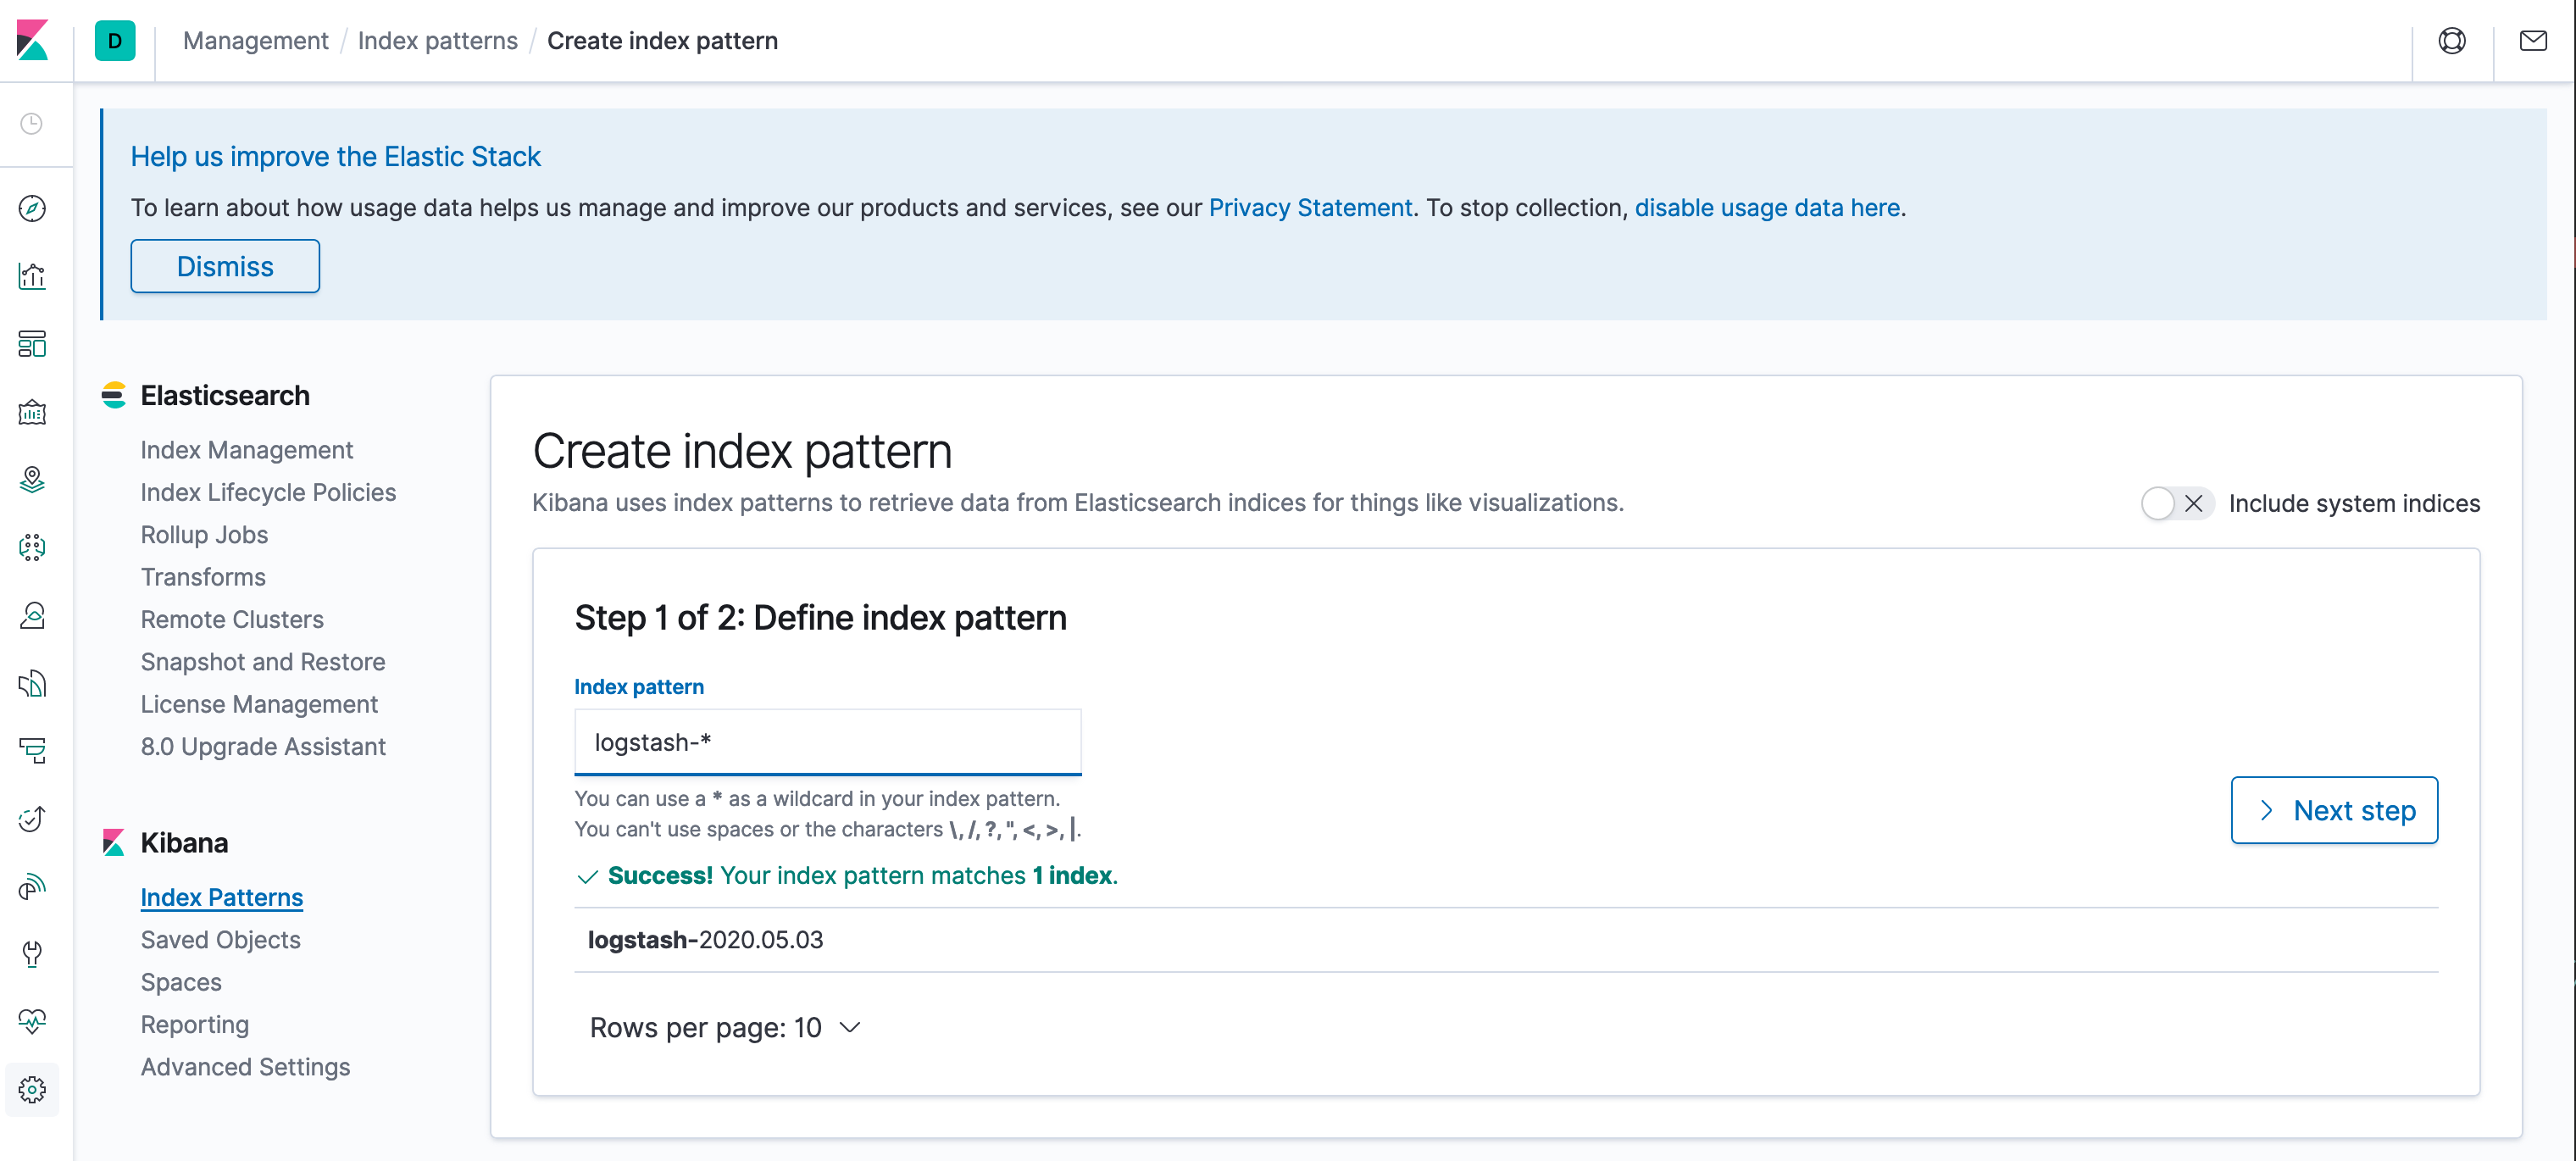
And click on > Next step to advance.
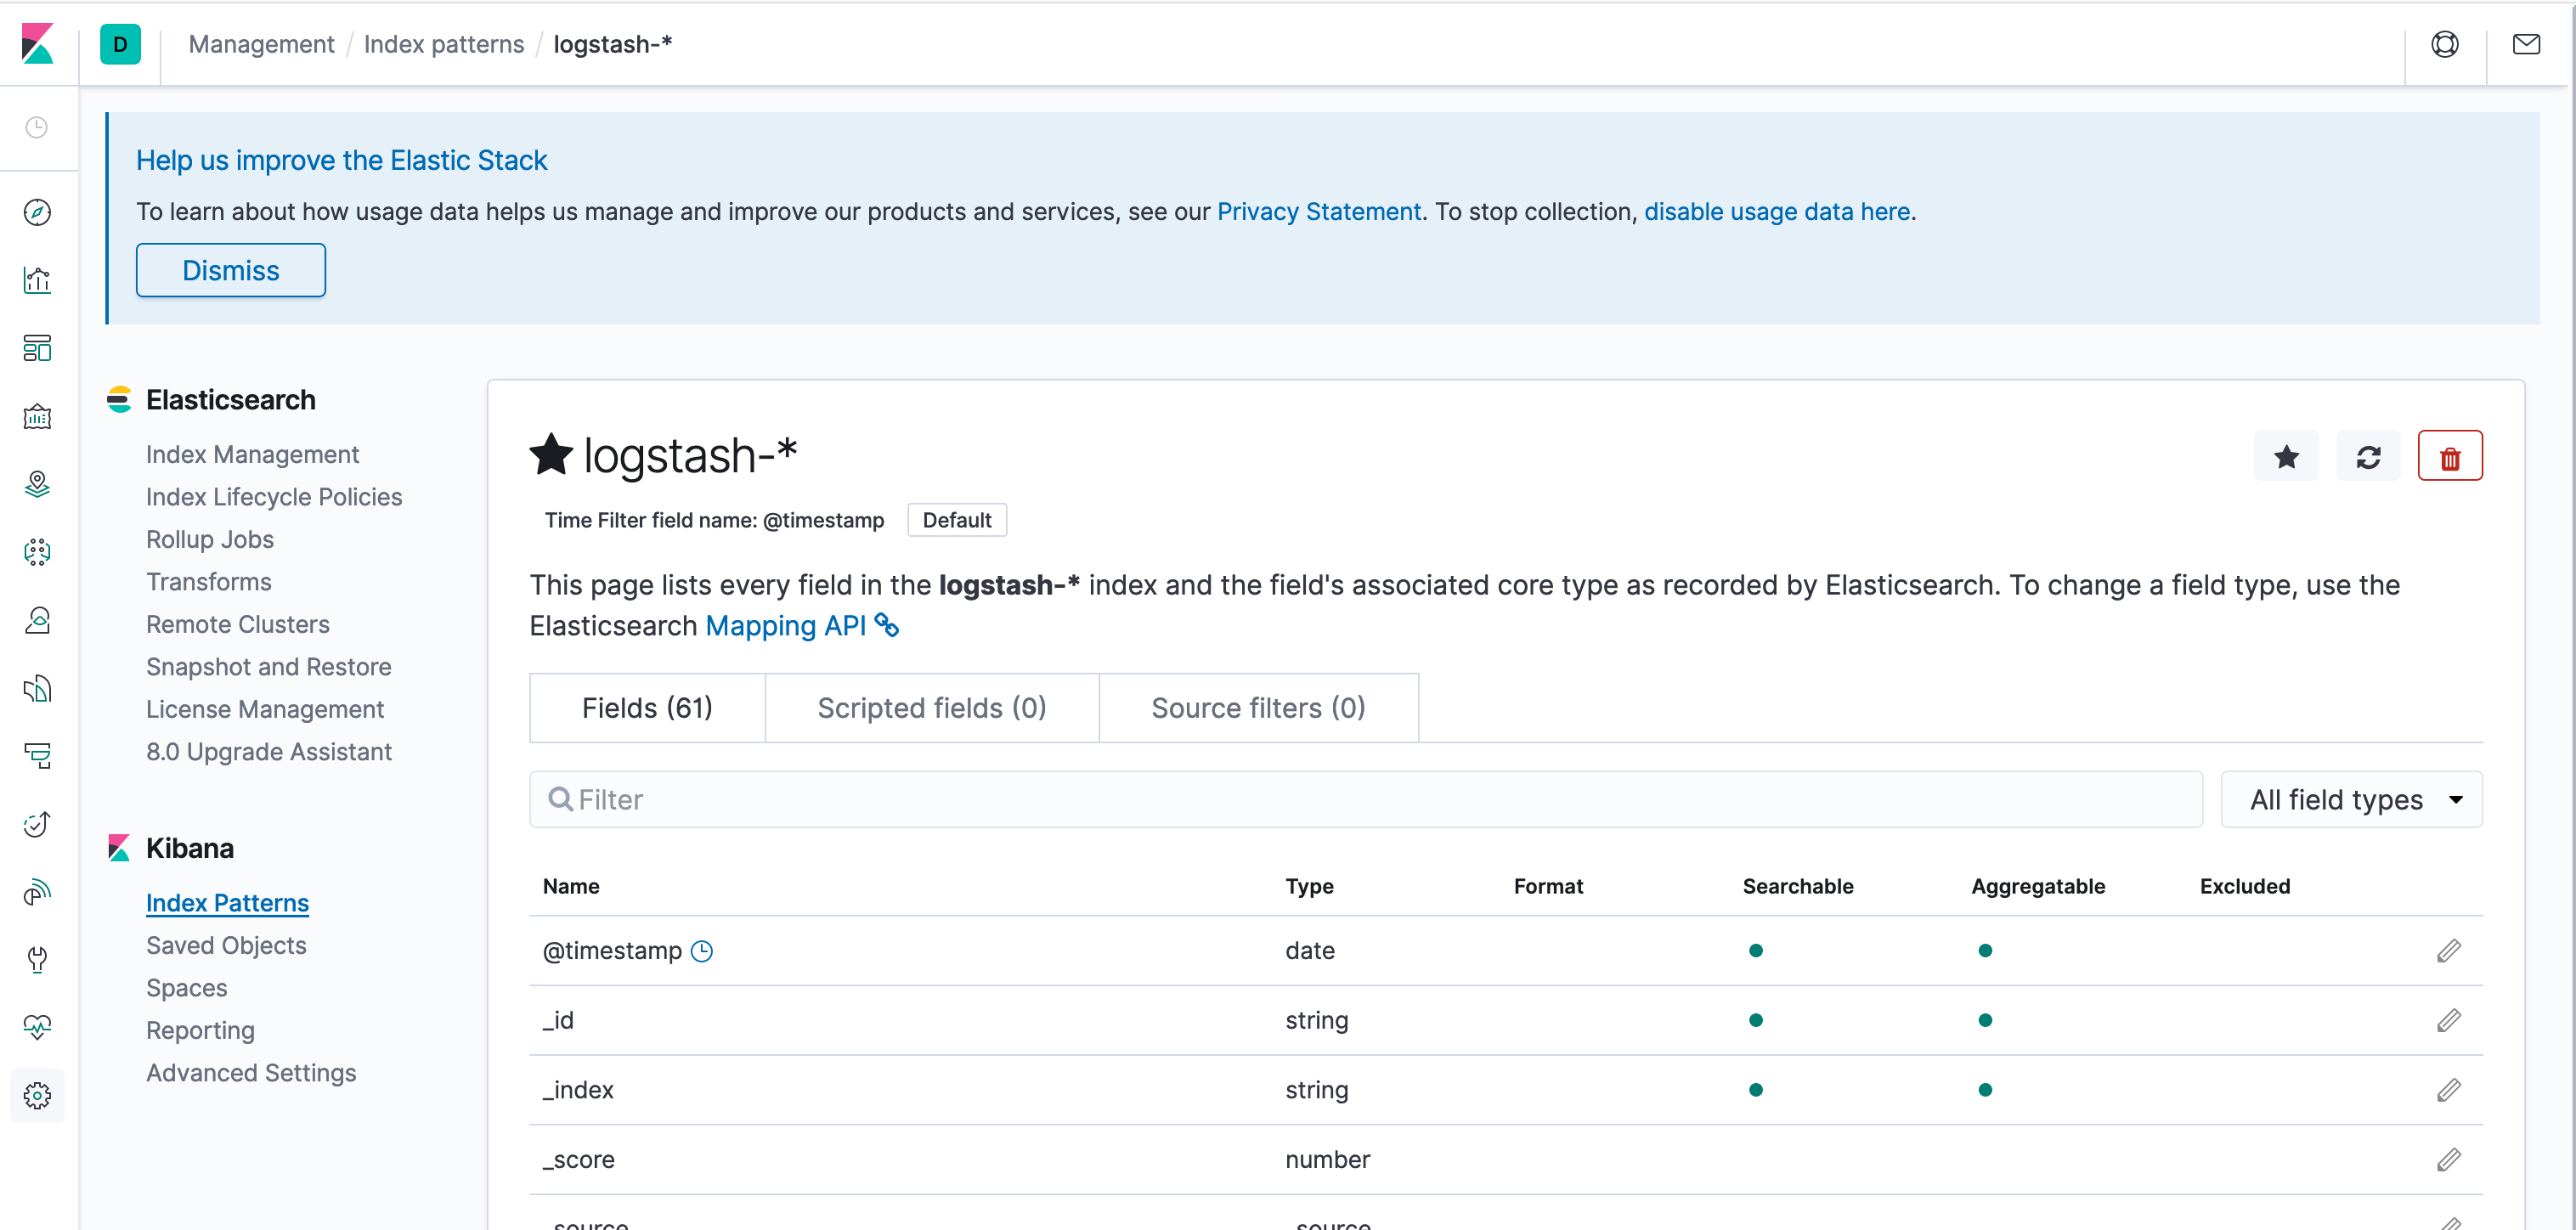
The last configuration step will ask you to choose the field from your log data that represents times. Choose @timestamp.
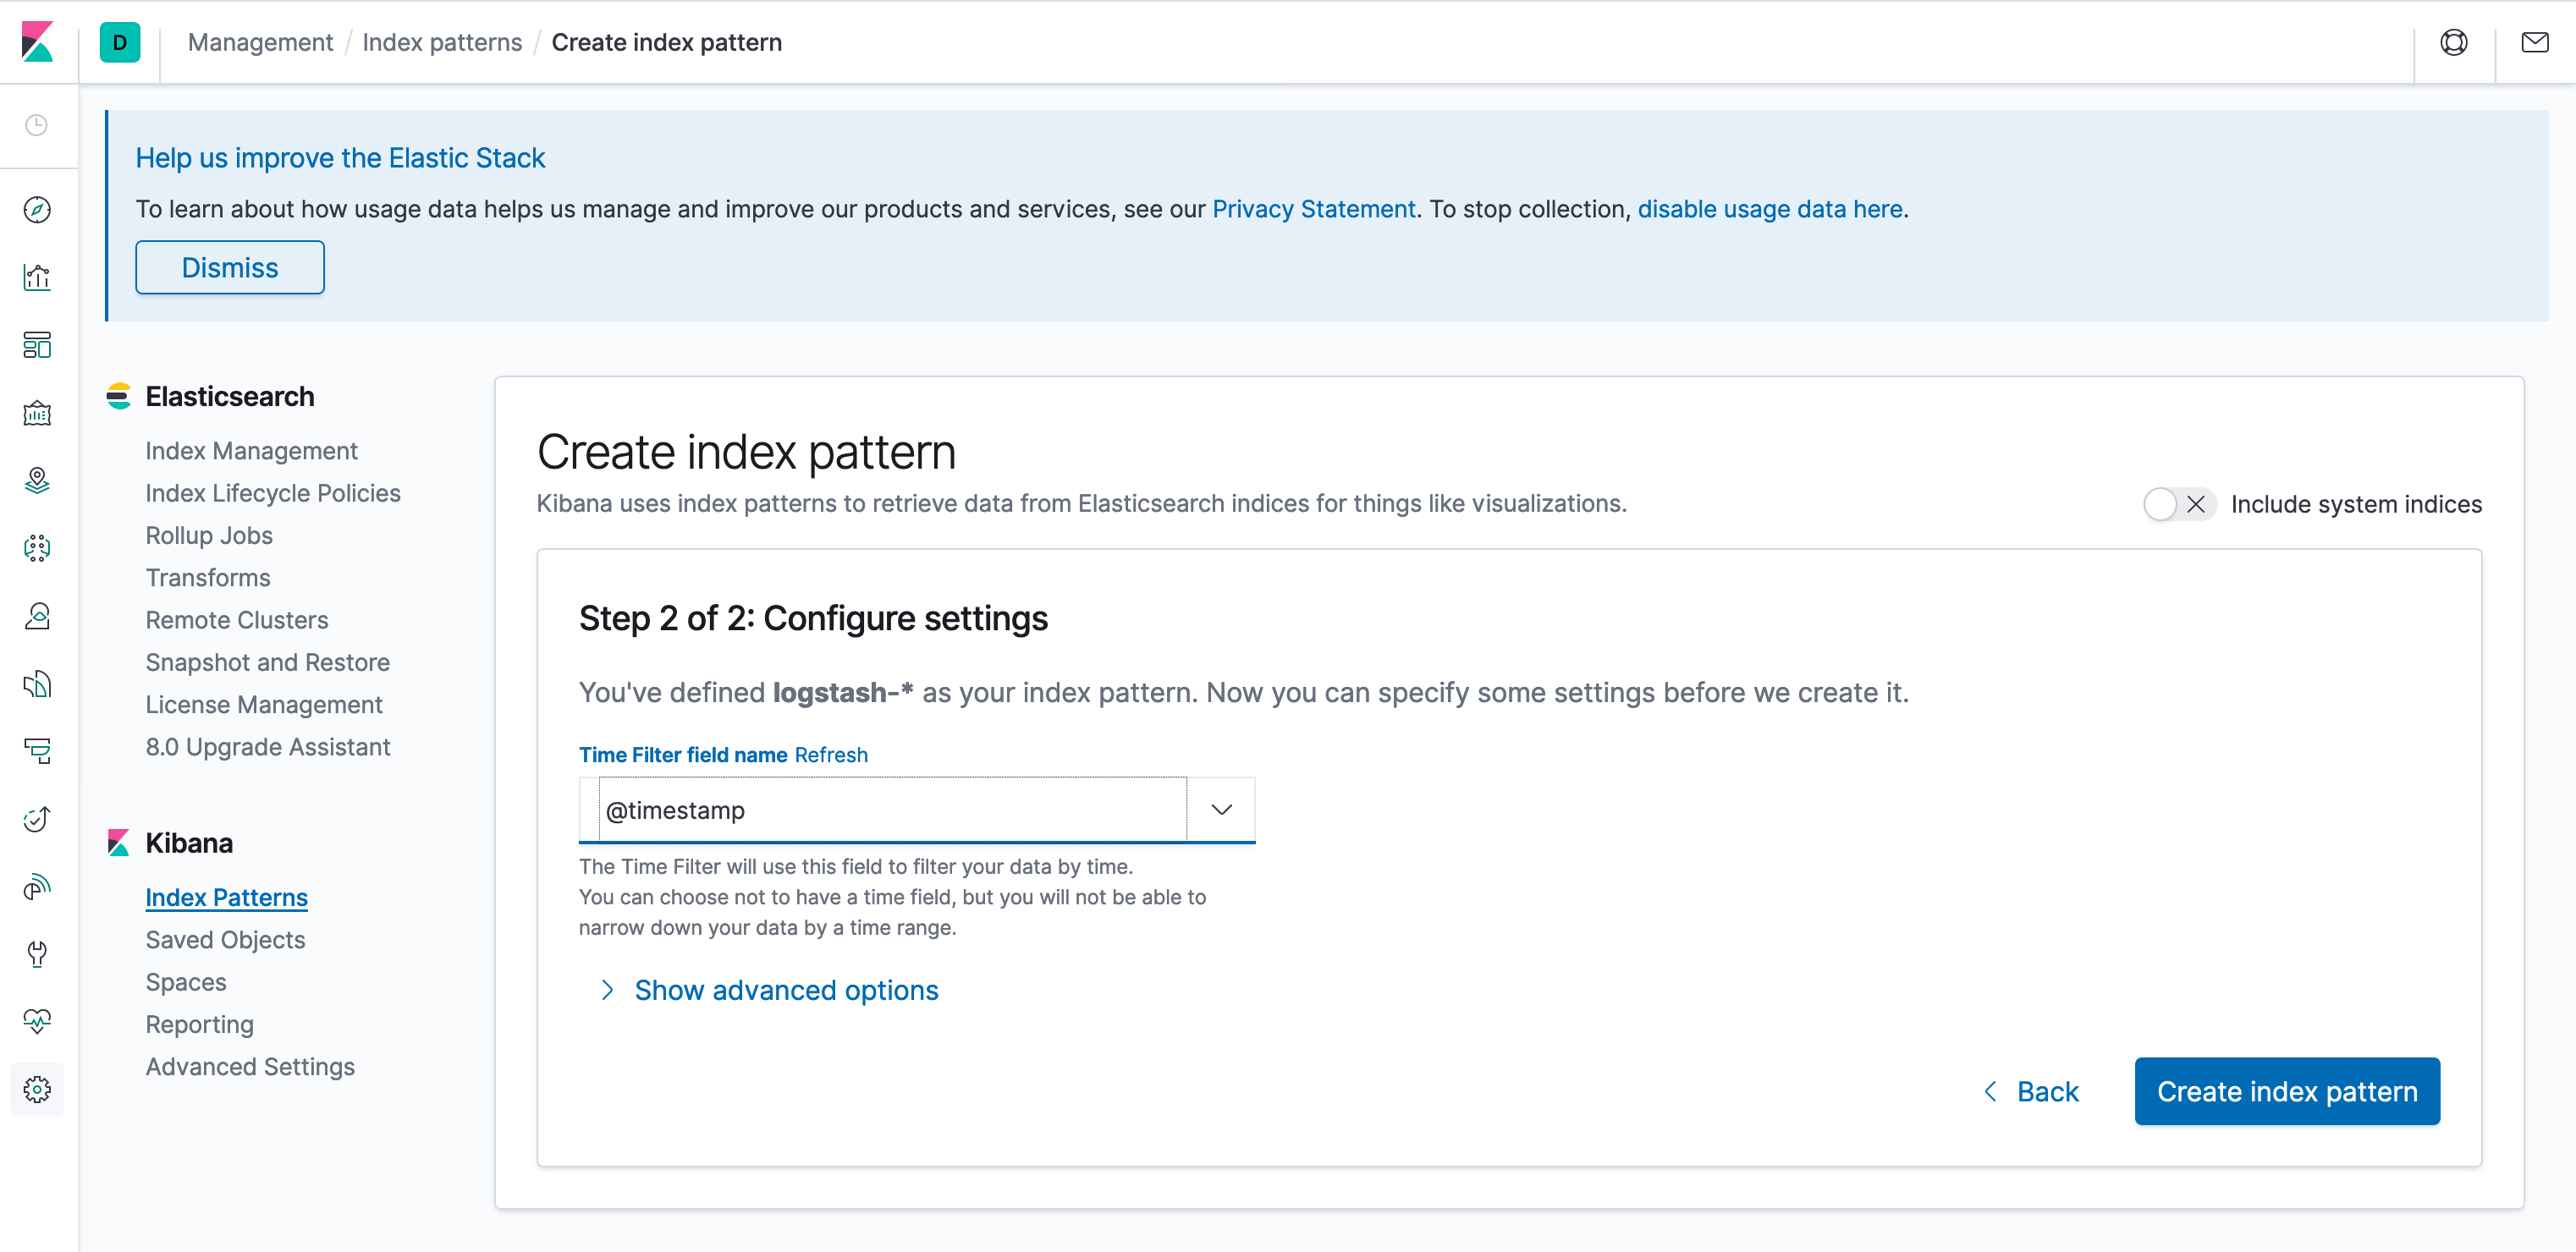
Click Create index pattern to save. It should look roughly like the screenshot below when complete:
Now you're ready to view the data! Click the Discover icon. That's the icon on the toolbar on the left at the top. It looks like a compass.
After that loads, it should look like the screenshot below:
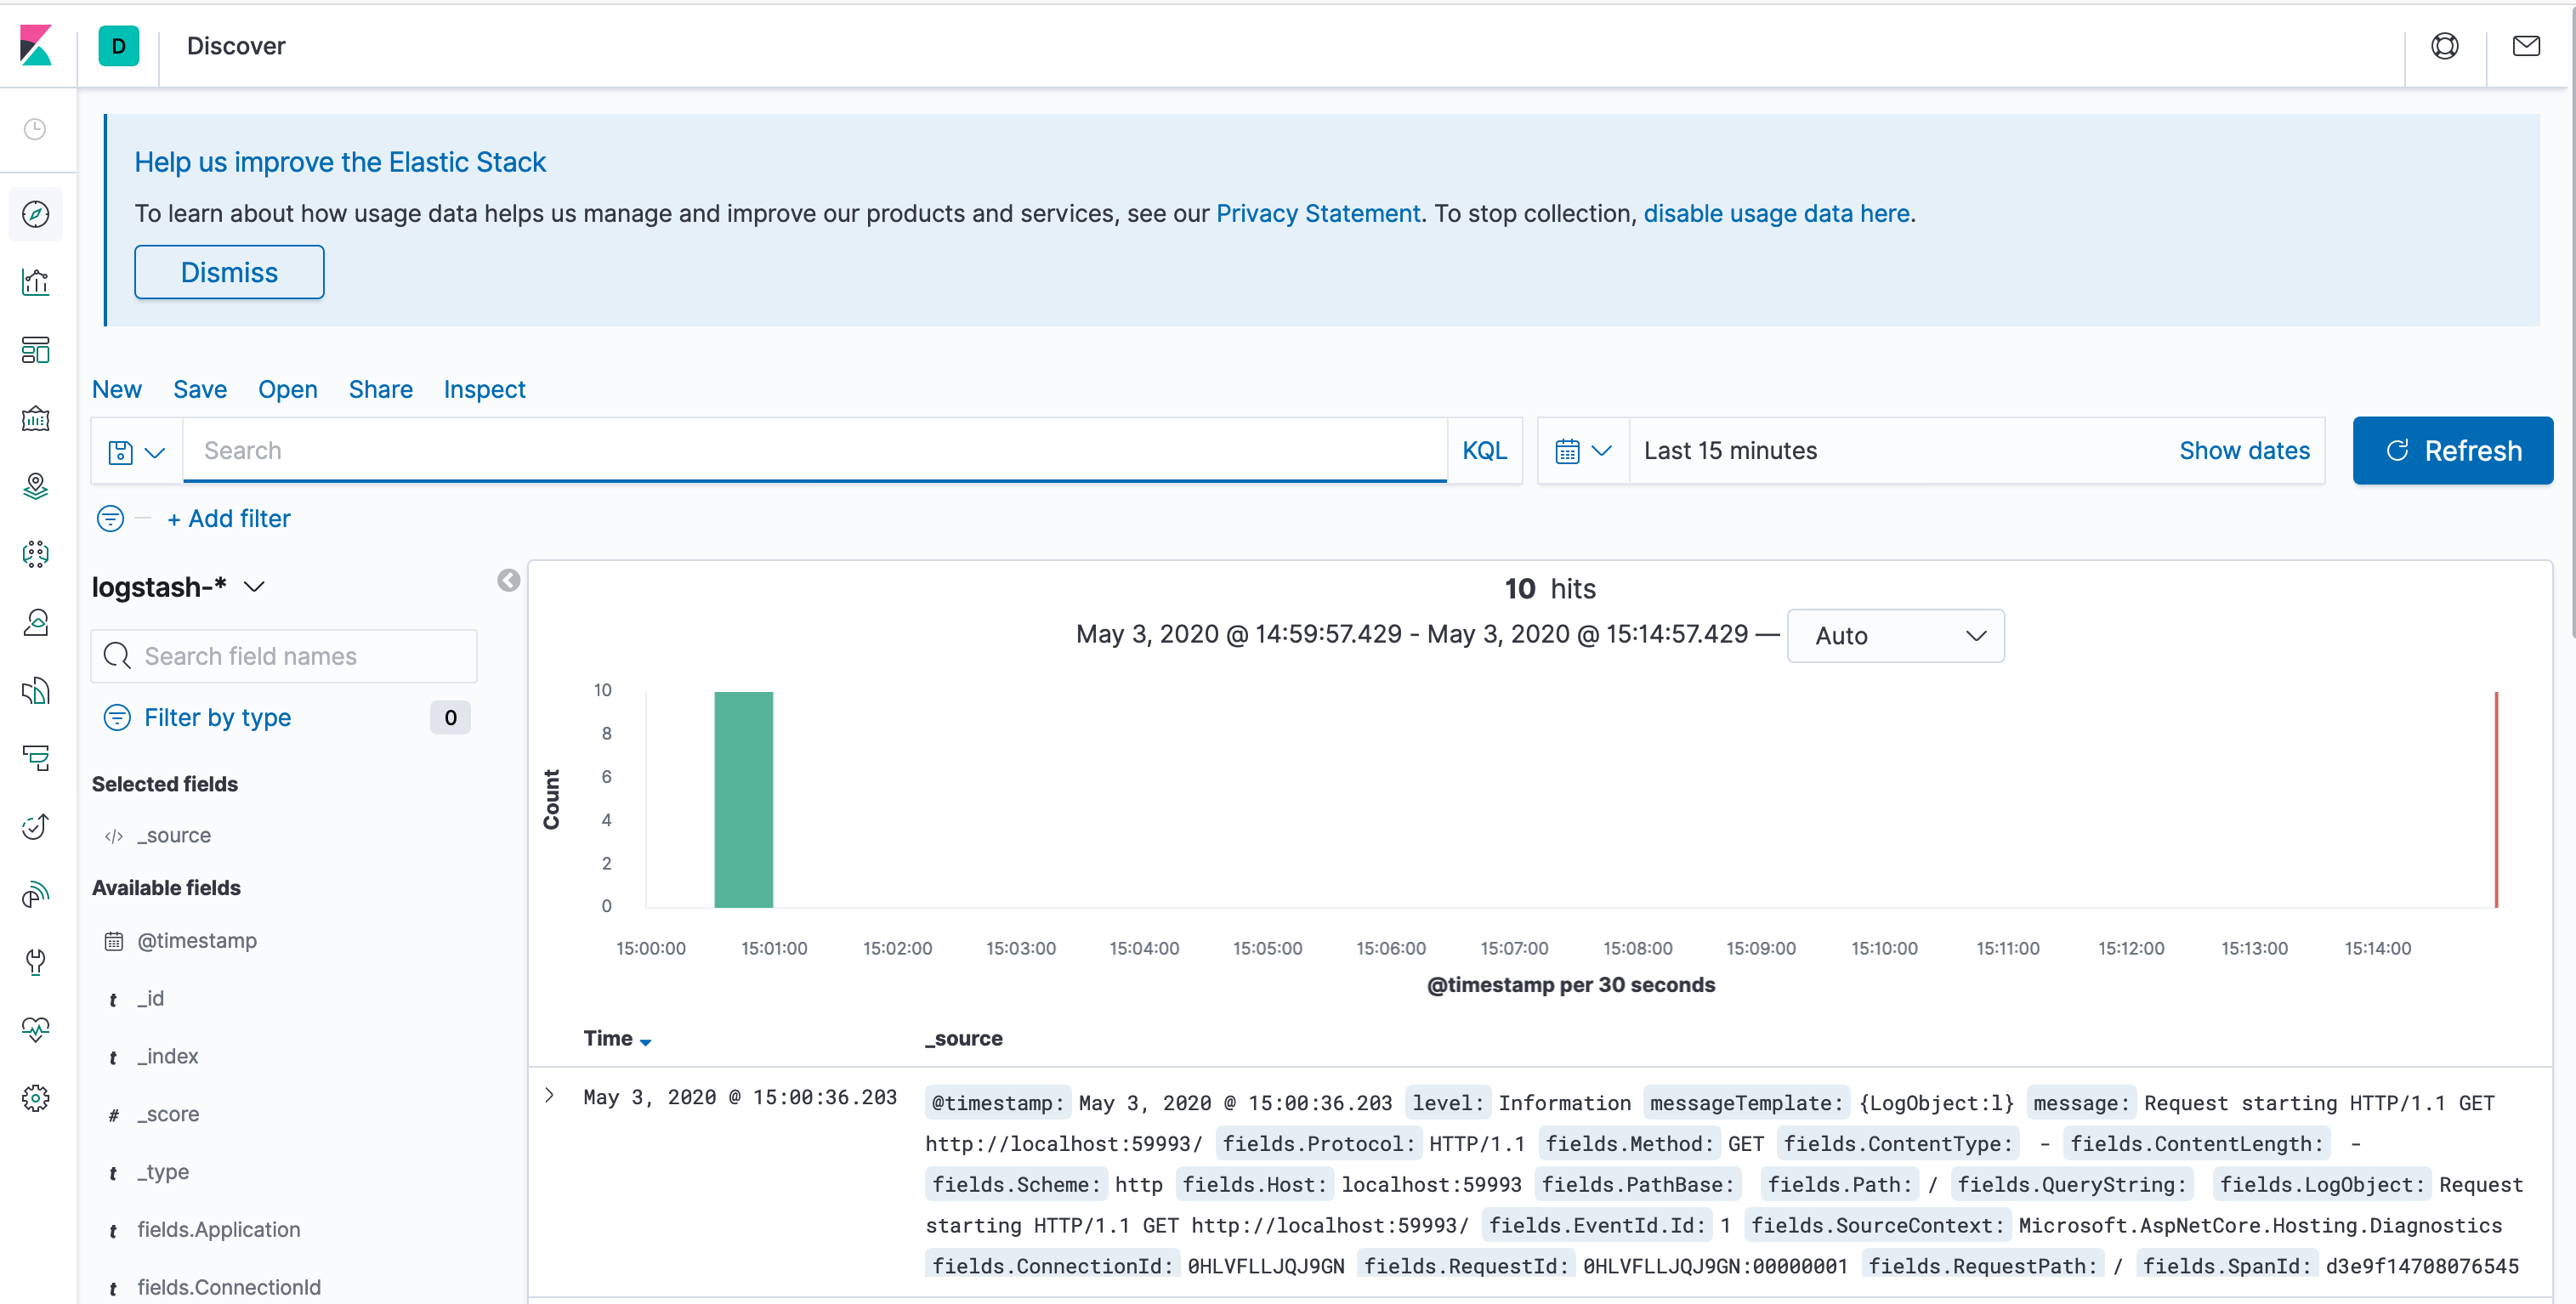
Now you can see the logs from your application with each field broken out into structured format. If you take advantage of structured logging then you'll see your own data included in structured form here alongside framework logs.
Now that we've got a logging dashboard, let's do a query to understand the connection between tracing and log aggregation.
The basic idea is that because log aggregation pulls all of the logs together across all of your services, and distributed tracing flows context across services, you can easily query all of the logs for a logical operation.
We'll use the discover tab to build a basic query.
First, perform some operation that will trigger a cross-service call so we have some data to use. If you're using the sample here then visiting the frontend application in the browser will do.
Next, let's add some fields to the query. The left pane in Kibana has all of the known fields. Select the following by clicking on the Add button near each of them:
messagefields.TraceIdfields.Application
It should like the screenshot below:
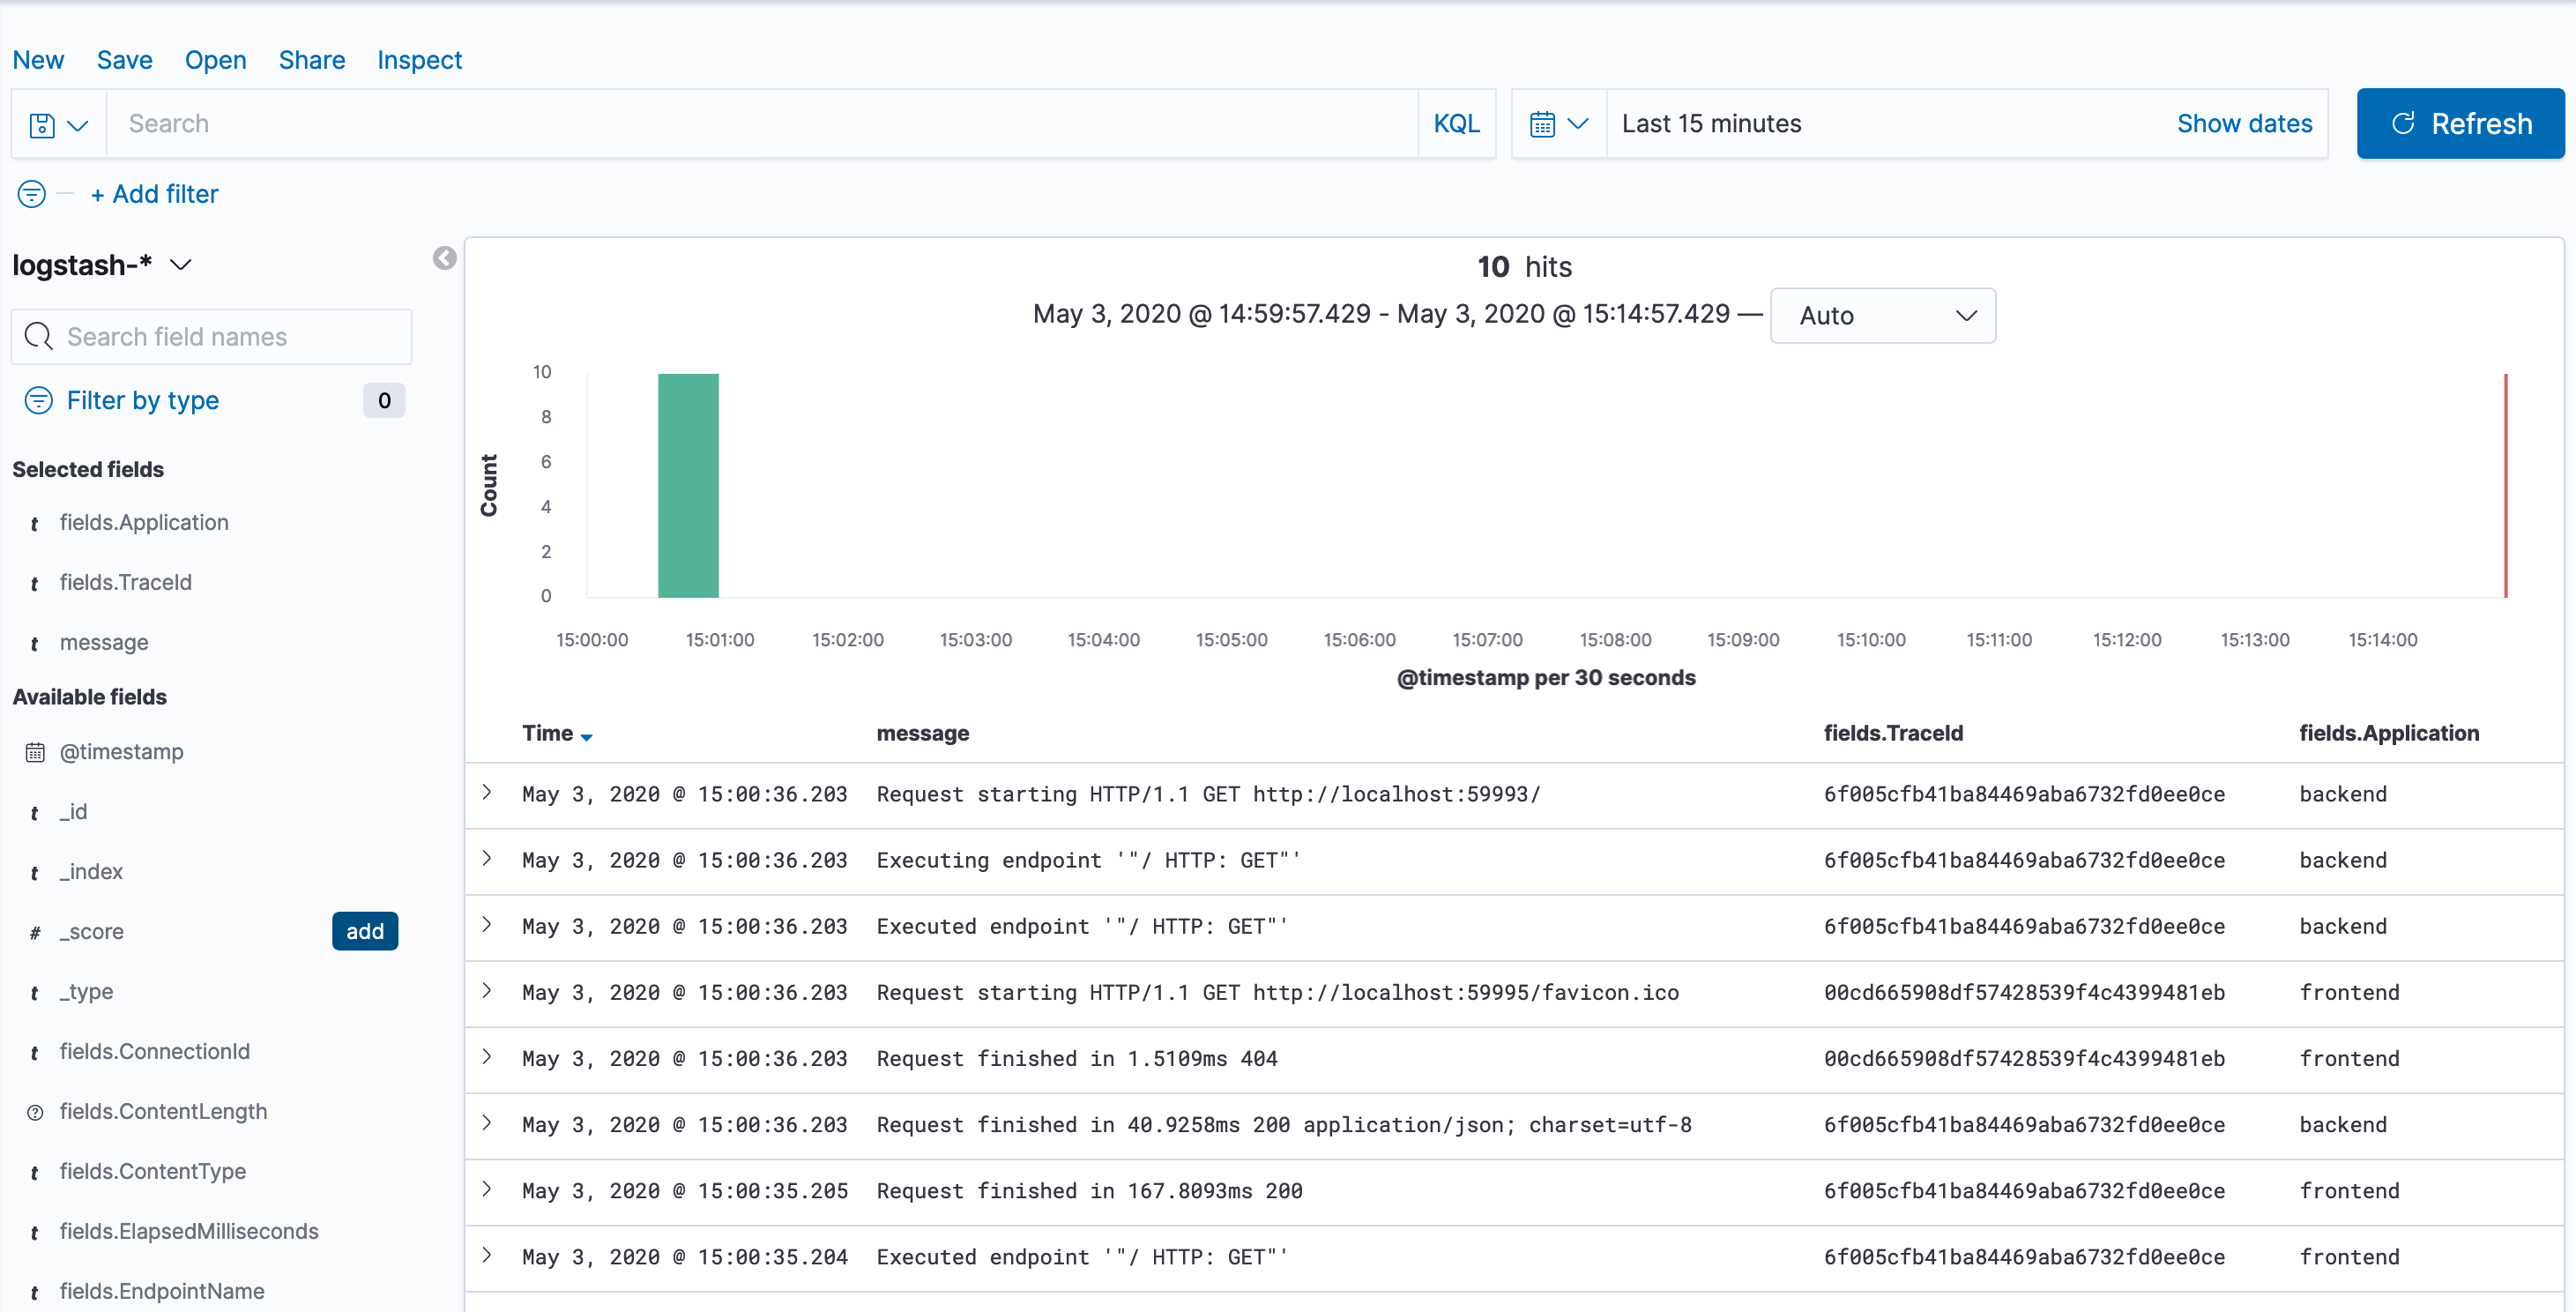
You can expand an individual message by clicking the > icon on the left if you want to see the values of non-selected fields.
Now it's showing just the fields that were selected, but its showing all log messages, not the ones from a specific request.
Hover over on of the values of fields.TraceId for a request to backend and click the icon for Filter for value (magnifying glass with the +).
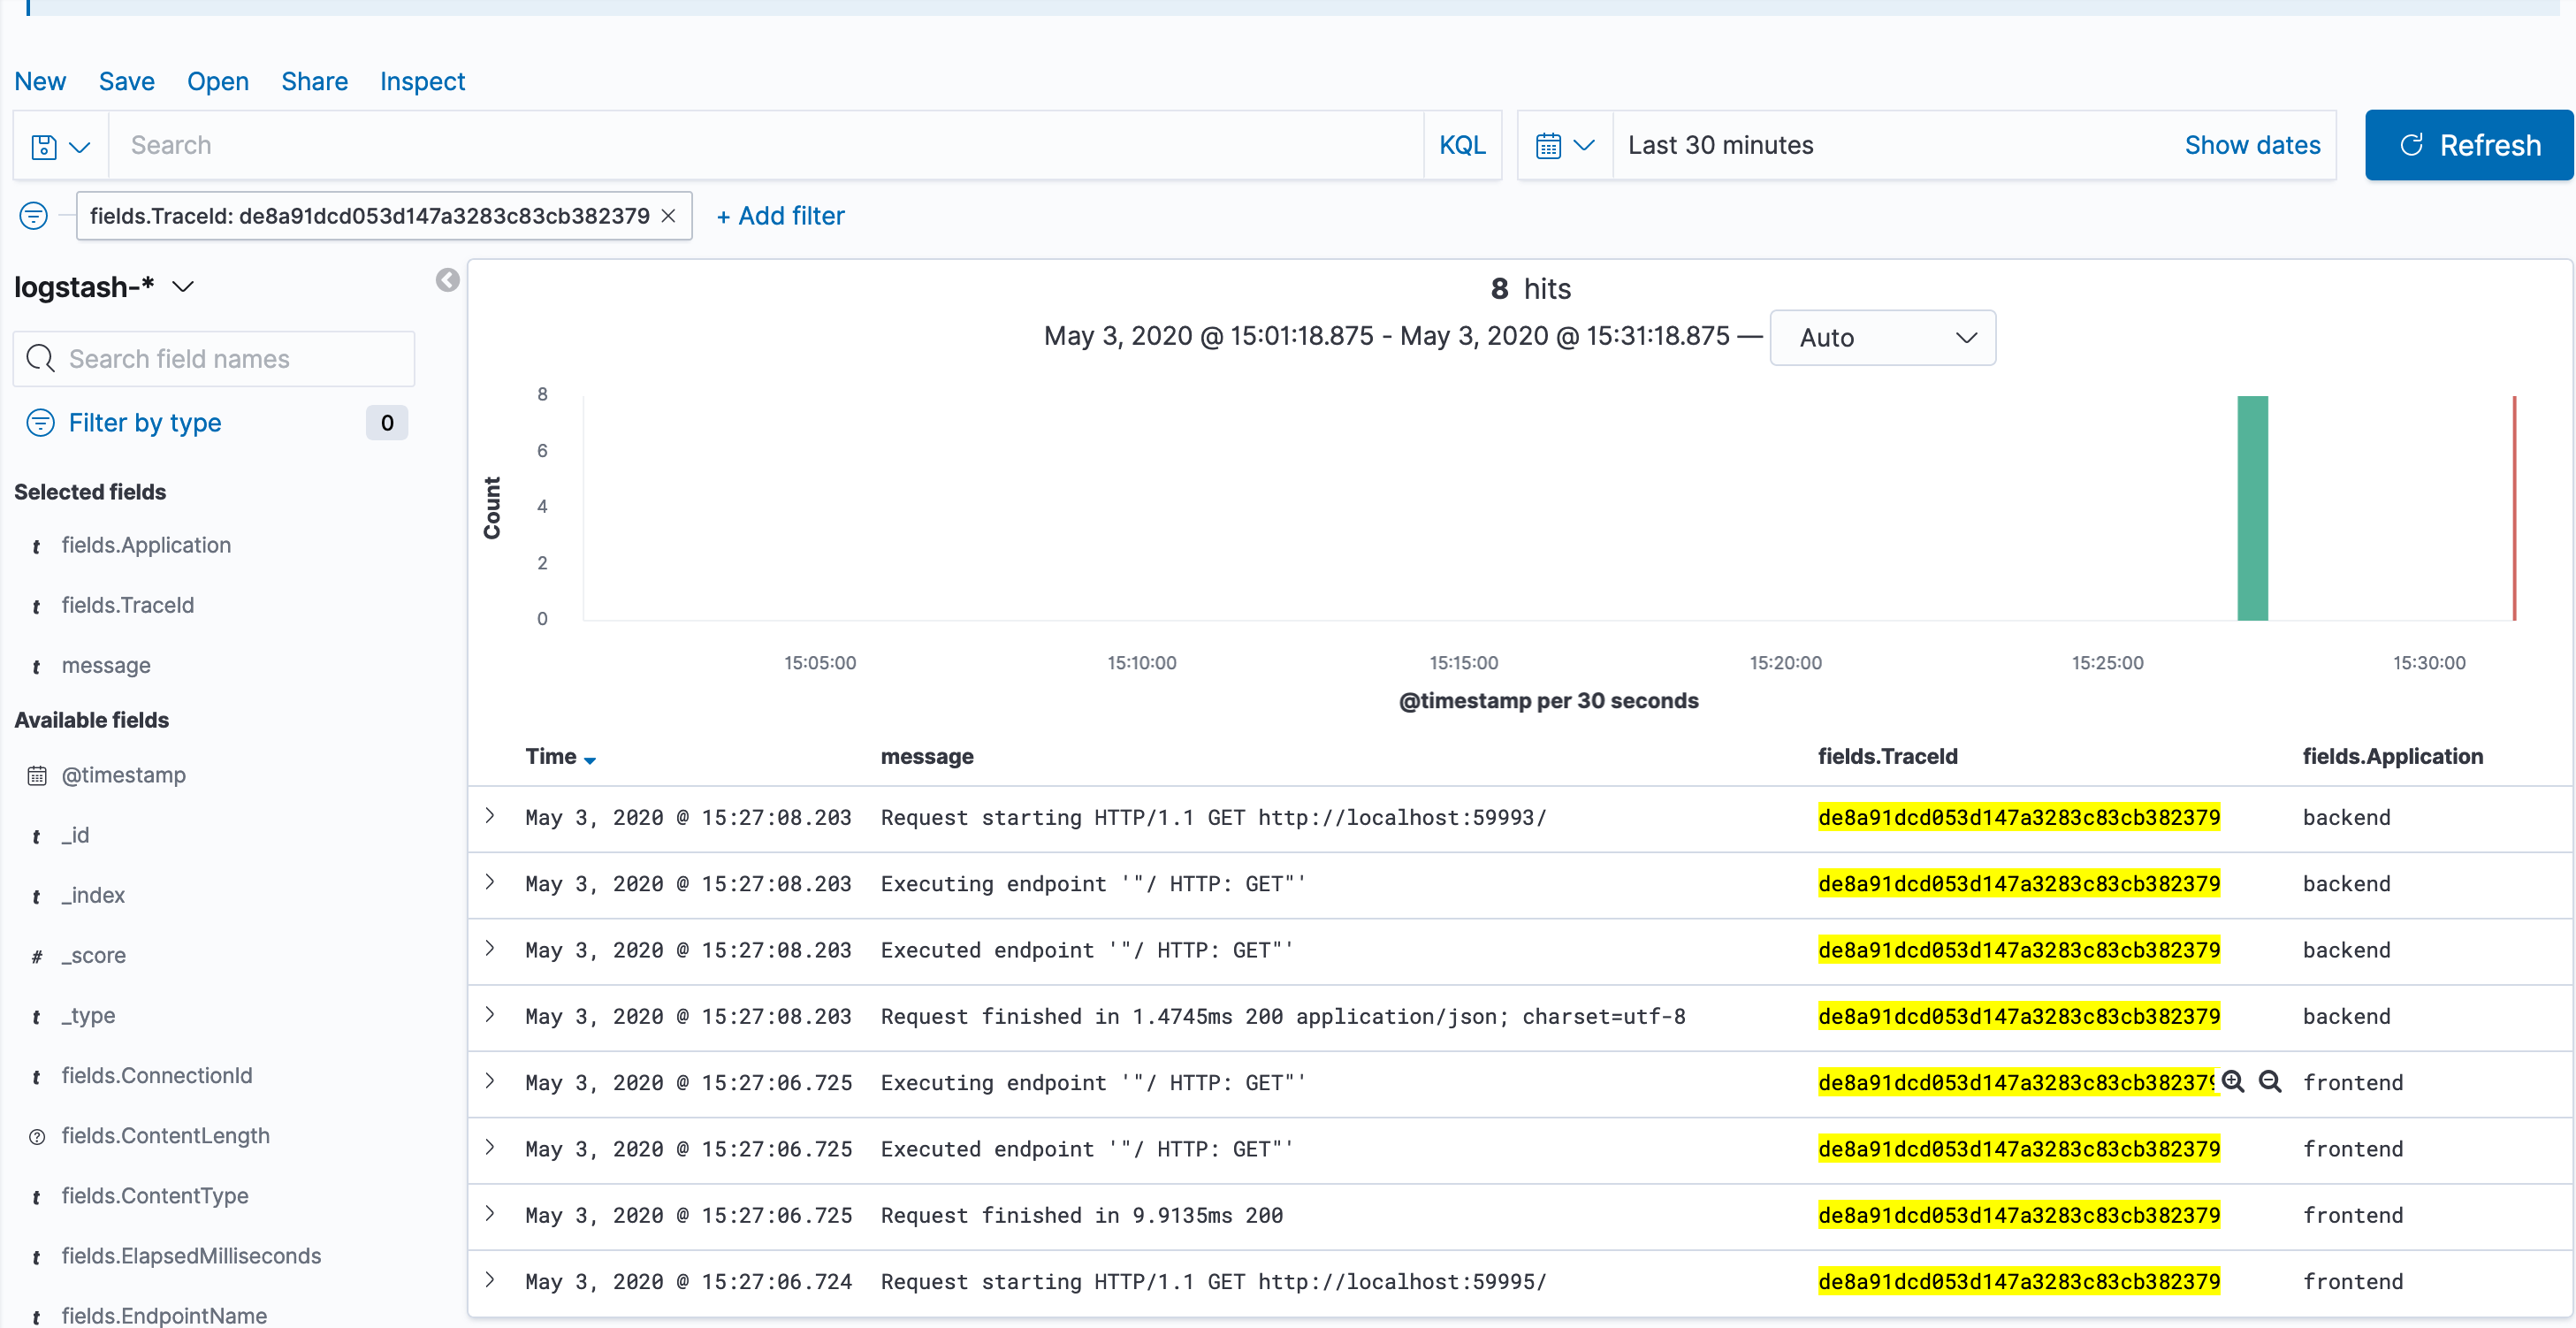
Now you can see all of the log messages for just that operation, across both the frontend and backend services. This kind of query can be useful when you want to investigate a problem that occured in the past, and see exactly what was logged by each service that participated in the operation.