Python script for plotting probability density functions, stored as importance-weighted lists of samples.
Phil Marshall and Daniel Foreman-Mackey since 12 December, 2011
setenv PAPPY_DIR ${HOME}/python/pappy
setenv PATH ${PATH}:${PAPPY_DIR}
setenv PYTHONPATH ${PAPPY_DIR}:${PYTHONPATH}
CornerPlotter.py --test
This suggests the following examples:
CornerPlotter.py -o test1.png examples/thetas.cpt,blue,shaded
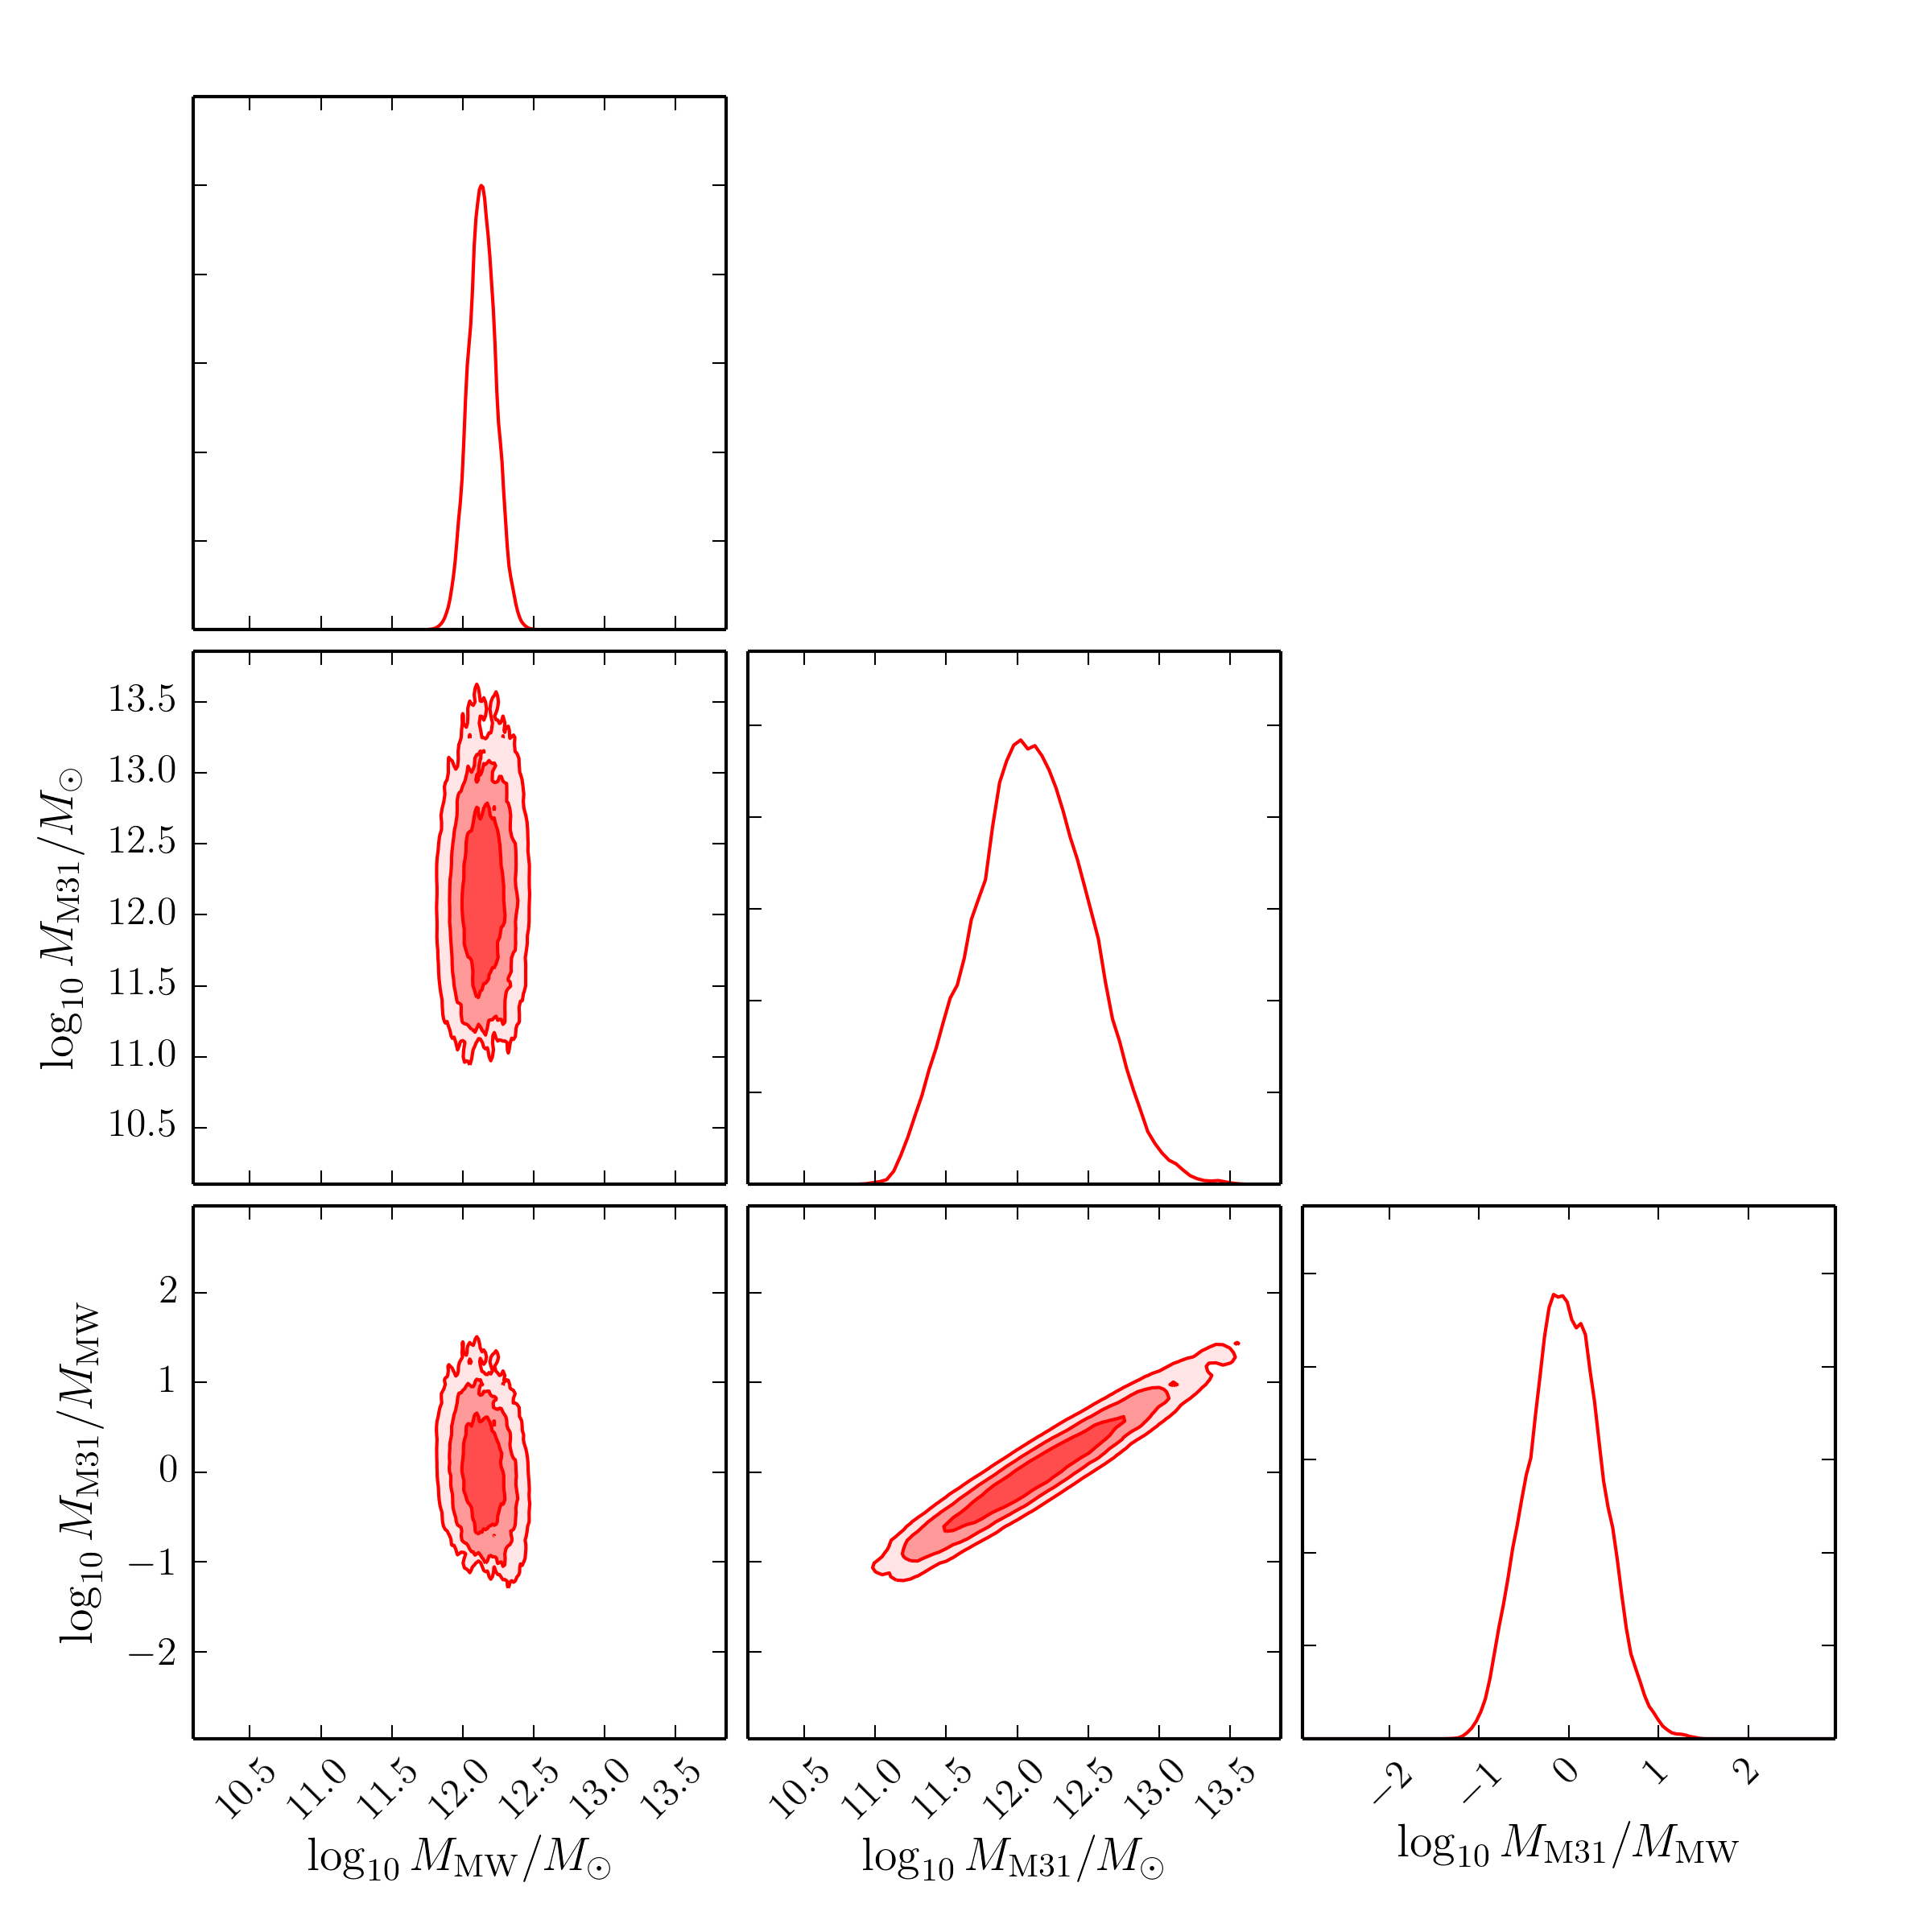
CornerPlotter.py -o test2.png -w 1 -n 2,3,4 examples/localgroup.cpt,red,shaded
CornerPlotter.py -o test3.png --just-2D -w 1 -n 3,4 examples/localgroup.cpt,purple,shaded
CornerPlotter.py -o test4.png --conditional --plot-points -n 2,3,4 examples/localgroup.cpt,green,shaded
Note the data format required: plain text with an informative header, that defines the axis labels and ranges. For example:
# importance, $\log_{10} M_{\rm MW} / M_{\odot}$,  $\log_{10} M_{\rm M31} / M_{\odot}$,  $\log_{10} M_{\rm M31} / M_{\rm MW}$,  $\log_{10} M\prime_{\rm LG} / M_{\odot}$,
# 0,1,        10.0,14.0,    10.0,14.0,    -3.0,3.0,     10.0,14.0,
1.228662286689141346e-10 1.148898129665888135e+01 1.206671702374781496e+01 5.777357270889337260e-01 1.216860210104861117e+01
9.115455789900011041e-01 1.220497250067228023e+01 1.144655000180502746e+01 -7.584224988672524370e-01 1.227479314997625259e+01
...
Here's the test2.png corner plot: