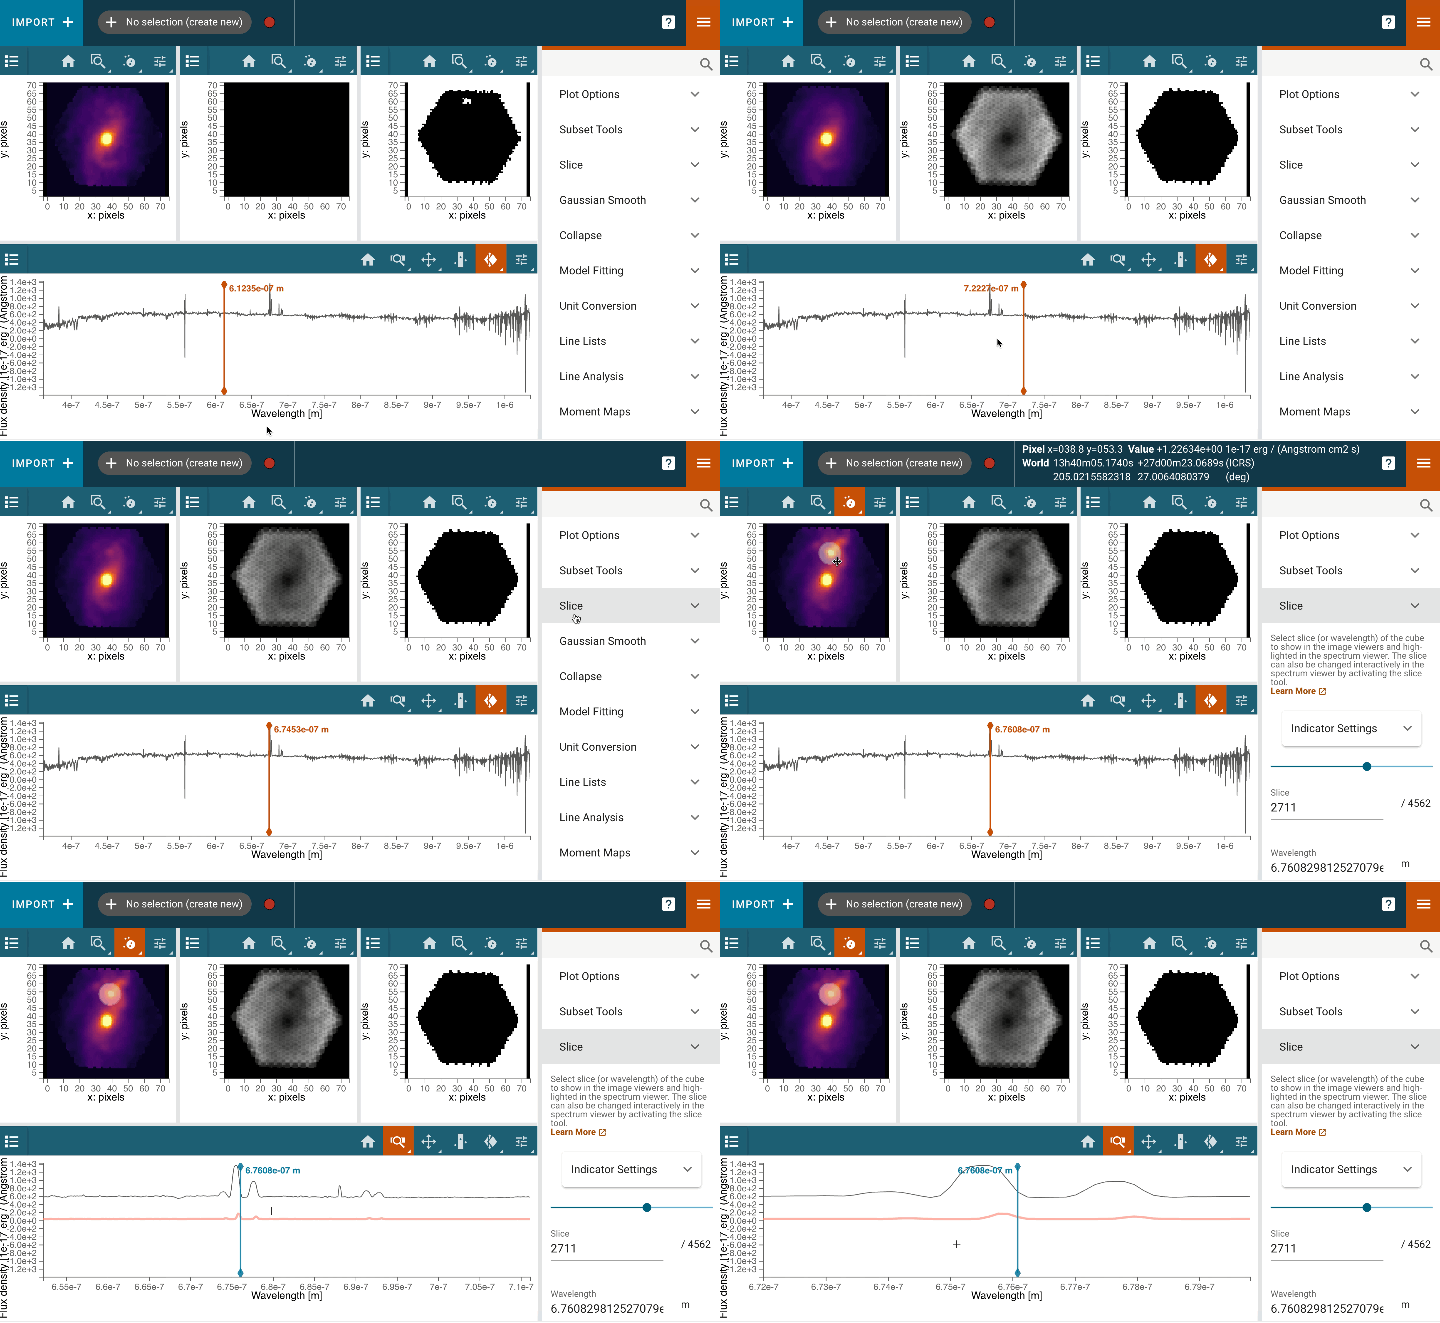
Cubeviz is a visualization and analysis toolbox for data cubes from integral field units (IFUs). It is built as part of the glue visualization tool. Cubeviz is designed to work with data cubes from the NIRSpec and MIRI instruments on JWST, and will work with IFU data cubes. It uses the specutils package from Astropy .
Cubeviz incorporates visualization tools with analysis capabilities, such as Astropy regions and :ref:`specutils` packages. Users can interact with their data from within the tool. Cubeviz allows spectra of regions within the cube to be easily plotted and examined, offering all the same capabilities as :ref:`specviz`.
In addition, Cubeviz also allows users to interact with their cube to:
- view the wavelength slices (RA, DEC),
- view flux and error or data quality cubes simultaneously,
- view spectra from selected spatial (RA, DEC) regions,
- smooth cubes spatially (RA, DEC) and spectrally (wavelength),
- create and display contour maps,
- collapse cubes over selected wavelength regions,
- fit spectral lines,
- create moment maps, including line flux and kinematic maps (rotation velocity and velocity dispersion),
- overlay spectral line lists,
- save edited cubes,
- save figures,
- fit models to every spaxel
Using Cubeviz
.. toctree::
  :maxdepth: 2

  import_data
  displaycubes
  displayspectra
  plugins
  export_data
  examples
