


thinkcell is a simple unofficial python library that helps you generate presentations in a quick and automated way.
In order to use it you will need a valid and working think-cell license and installation.
thinkcell is available on PyPi.
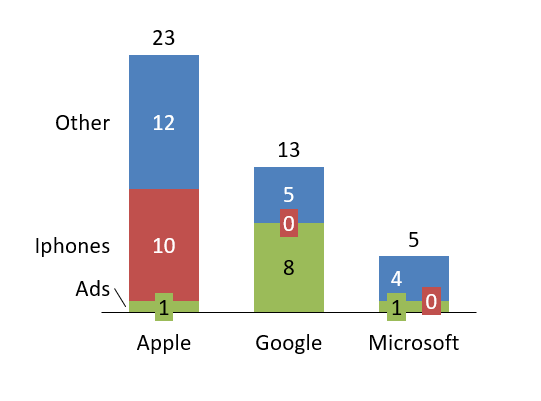
$ pip install thinkcellLet us say you have generated a template according to think-cell's automation guidelines called simple-template.pptx with the following chart called Chart1:
The thinkcell library helps you generate a .ppttc file so that you can generate presentations based on that template using python:
from thinkcell import Thinkcell

template_name = "simple-template.pptx"
categories = ["Ads", "Revenue", "Losses"]
chart_name = "Chart1"
field_name = "chart_caption"
text = "Some relevant KPIs"
filename = "simple-example.ppttc"

data = [["Amazon", 1, 11, 14], ["Slack", 8, 2, 15], ["Ford", 1, 2, 12]]

tc = Thinkcell() # create thinkcell object
tc.add_template(template_name) # add your template
tc.add_textfield(
    template_name=template_name,
    field_name=field_name,
    text=text,
) # add your text field
tc.add_chart(
    template_name=template_name,
    chart_name=chart_name,
    categories=categories,
    data=data,
) # add you categories and data

tc.save_ppttc(filename=filename)
Once done, go ahead and double click the generated simple-example.ppttc file, and your chart will open. Save it and you are done!
You can also derive your chart from a Pandas dataframe.
Make sure you have pandas installed (e.g., pip install pandas)
from thinkcell import Thinkcell
import pandas

template_name = "simple-template.pptx"
chart_name = "Chart1"
filename = "simple-example.ppttc"
dataframe = pandas.DataFrame(
    columns=["Company", "Ads", "Revenue", "Losses"],
    data=[["Amazon", 1, 11, 14], ["Slack", 8, 2, 15], ["Ford", 1, 2, 12]],
)

tc = Thinkcell() # create thinkcell object
tc.add_template(template_name) # add your template
tc.add_chart_from_dataframe(
    template_name=template_name,
    chart_name=chart_name,
    dataframe=dataframe,
) # add your dataframe

tc.save_ppttc(filename=filename)
Visit the examples folder for more examples and source files.
If you wish to learn more about this process, visit the think-cell automation documentation.
Start by forking this repo.
Install the development dependencies (you probably want to do this in a virtual environment):
$ pip install -r requirements-dev.txtMake sure the tests run:
$ pytestThen you can create a branch and submit a pull request.
- Create docstrings.
- Handle duplicate template names.
- Produce documentation.
- Pandas dataframe support.
Note: This project is in no way affiliated with think-cell Sales GmbH & Co. KG. I just wanted to make my (and hopefully your) life easier.