Skip to content
New issue

Have a question about this project? Sign up for a free GitHub account to open an issue and contact its maintainers and the community.

By clicking “Sign up for GitHub”, you agree to our terms of service and privacy statement. We’ll occasionally send you account related emails.

Already on GitHub? Sign in to your account

Chart doesn't fit in grid - 4.0.2 #7549

Closed
BorisTB opened this issue Jan 21, 2018 · 1 comment
Closed

Chart doesn't fit in grid - 4.0.2 #7549

BorisTB opened this issue Jan 21, 2018 · 1 comment
Labels
stale Inactive for a long time. Will be closed in 7 days.

Comments

@BorisTB
Copy link

BorisTB commented Jan 21, 2018

One-line summary [问题简述]

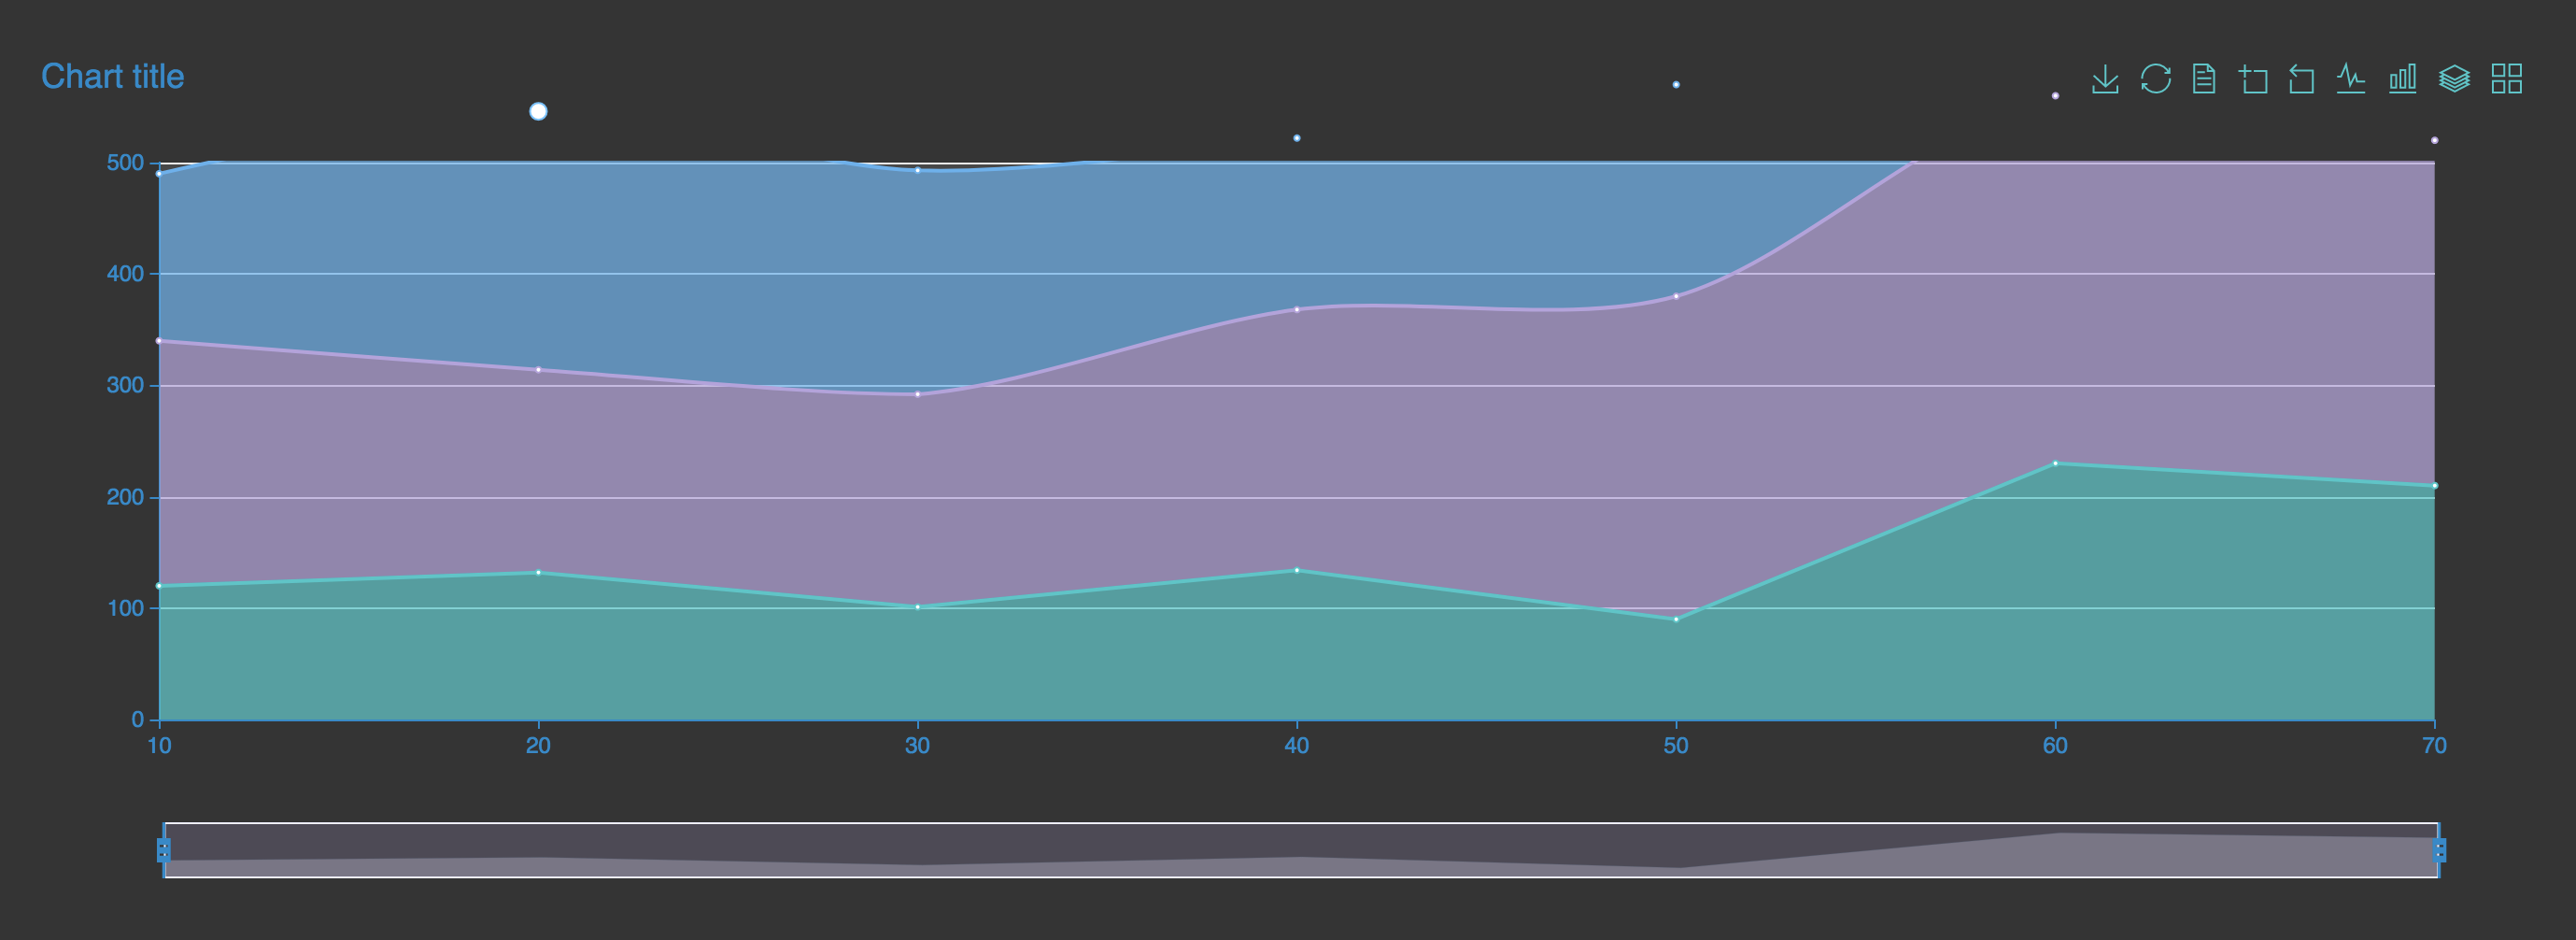
Since version 4, my chart doesn't fit inside grid and some points are outside and not visible when stacked.

Version & Environment [版本及环境]

  • ECharts version [ECharts 版本]: 4.0.2
  • Browser version [浏览器类型和版本]: Chrome 63.0.3239.132
  • OS Version [操作系统类型和版本]: OS X 10.13.2

Expected behaviour [期望结果]

All points of chart should be visible like in previous version. Now it looks like chart doesn't fit inside the grid.

ECharts option [ECharts配置项]

option = {
  title: {
    text: 'Chart title',
  },
  tooltip: {
    trigger: 'axis',
  },
  legend: {
    data: ['Prve', 'Druhe', 'Tretie'],
  },
  toolbox: {
    feature: {
      saveAsImage: {
        title: 'Download',
      },
      restore: {
        title: 'Restore',
      },
      dataView: {
        title: 'Data View',
        lang: ['Data View', 'Cancel', 'Apply'],
      },
      dataZoom: {
        title: {
          zoom: 'Zoom',
          back: 'Reset zoom',
        },
      },
      magicType: {
        type: ['line', 'bar', 'stack', 'tiled'],
        title: {
          line: 'Line',
          bar: 'Bar',
          stack: 'Stack',
          tiled: 'Tiled',
        },
      },
    },
  },
  dataZoom: [
    {
      id: 'dataZoomX',
      type: 'slider',
      xAxisIndex: [0],
      filterMode: 'empty',
    },
  ],
  grid: {
    left: '3%',
    right: '4%',
    bottom: '16%',
    containLabel: true,
  },
  xAxis: [
    {
      type: 'category',
      boundaryGap: false,
      data: ([10, 20, 30, 40, 50, 60, 70]),
    },
  ],
  yAxis: [
    {
      type: 'value',
    },
  ],
  series: [
    {
      type: 'line',
      name: 'First line',
      smooth: false,
      stack: 'stack1',
      areaStyle: { normal: {} },
      data: [120, 132, 101, 134, 90, 230, 210],
    },
    {
      type: 'line',
      name: 'Second line',
      stack: 'stack1',
      areaStyle: { normal: {} },
      data: [220, 182, 191, 234, 290, 330, 310],
    },
    {
      type: 'line',
      name: 'Third line',
      stack: 'stack1',
      areaStyle: { normal: {} },
      data: [150, 232, 201, 154, 190, 330, 410],
    },
  ],
}

Other comments [其他信息]

On screenshot you can see that chart doesn't fit the grid and there are some points outside of the grid
screen shot 2018-01-21 at 20 13 02

@stale
Copy link

stale bot commented Apr 2, 2020

This issue has been automatically marked as stale because it has not had recent activity. It will be closed if no further activity occurs. Thank you for your contributions.

@stale stale bot added the stale Inactive for a long time. Will be closed in 7 days. label Apr 2, 2020
@stale stale bot closed this as completed Apr 9, 2020
Sign up for free to join this conversation on GitHub. Already have an account? Sign in to comment
Labels
stale Inactive for a long time. Will be closed in 7 days.
Projects
None yet
Development

No branches or pull requests

1 participant