Skip to content
New issue

Have a question about this project? Sign up for a free GitHub account to open an issue and contact its maintainers and the community.

By clicking “Sign up for GitHub”, you agree to our terms of service and privacy statement. We’ll occasionally send you account related emails.

Already on GitHub? Sign in to your account

Formatting of stacktraces #25

Closed
felixbarny opened this issue Sep 11, 2019 · 11 comments
Closed

Formatting of stacktraces #25

felixbarny opened this issue Sep 11, 2019 · 11 comments

Comments

@felixbarny
Copy link
Member

Currently, the exception stack trace is just part of the message. There are some advantages and disadvantages to this.

The advantage is that it integrates nicely in the logs UI:
logs-ui

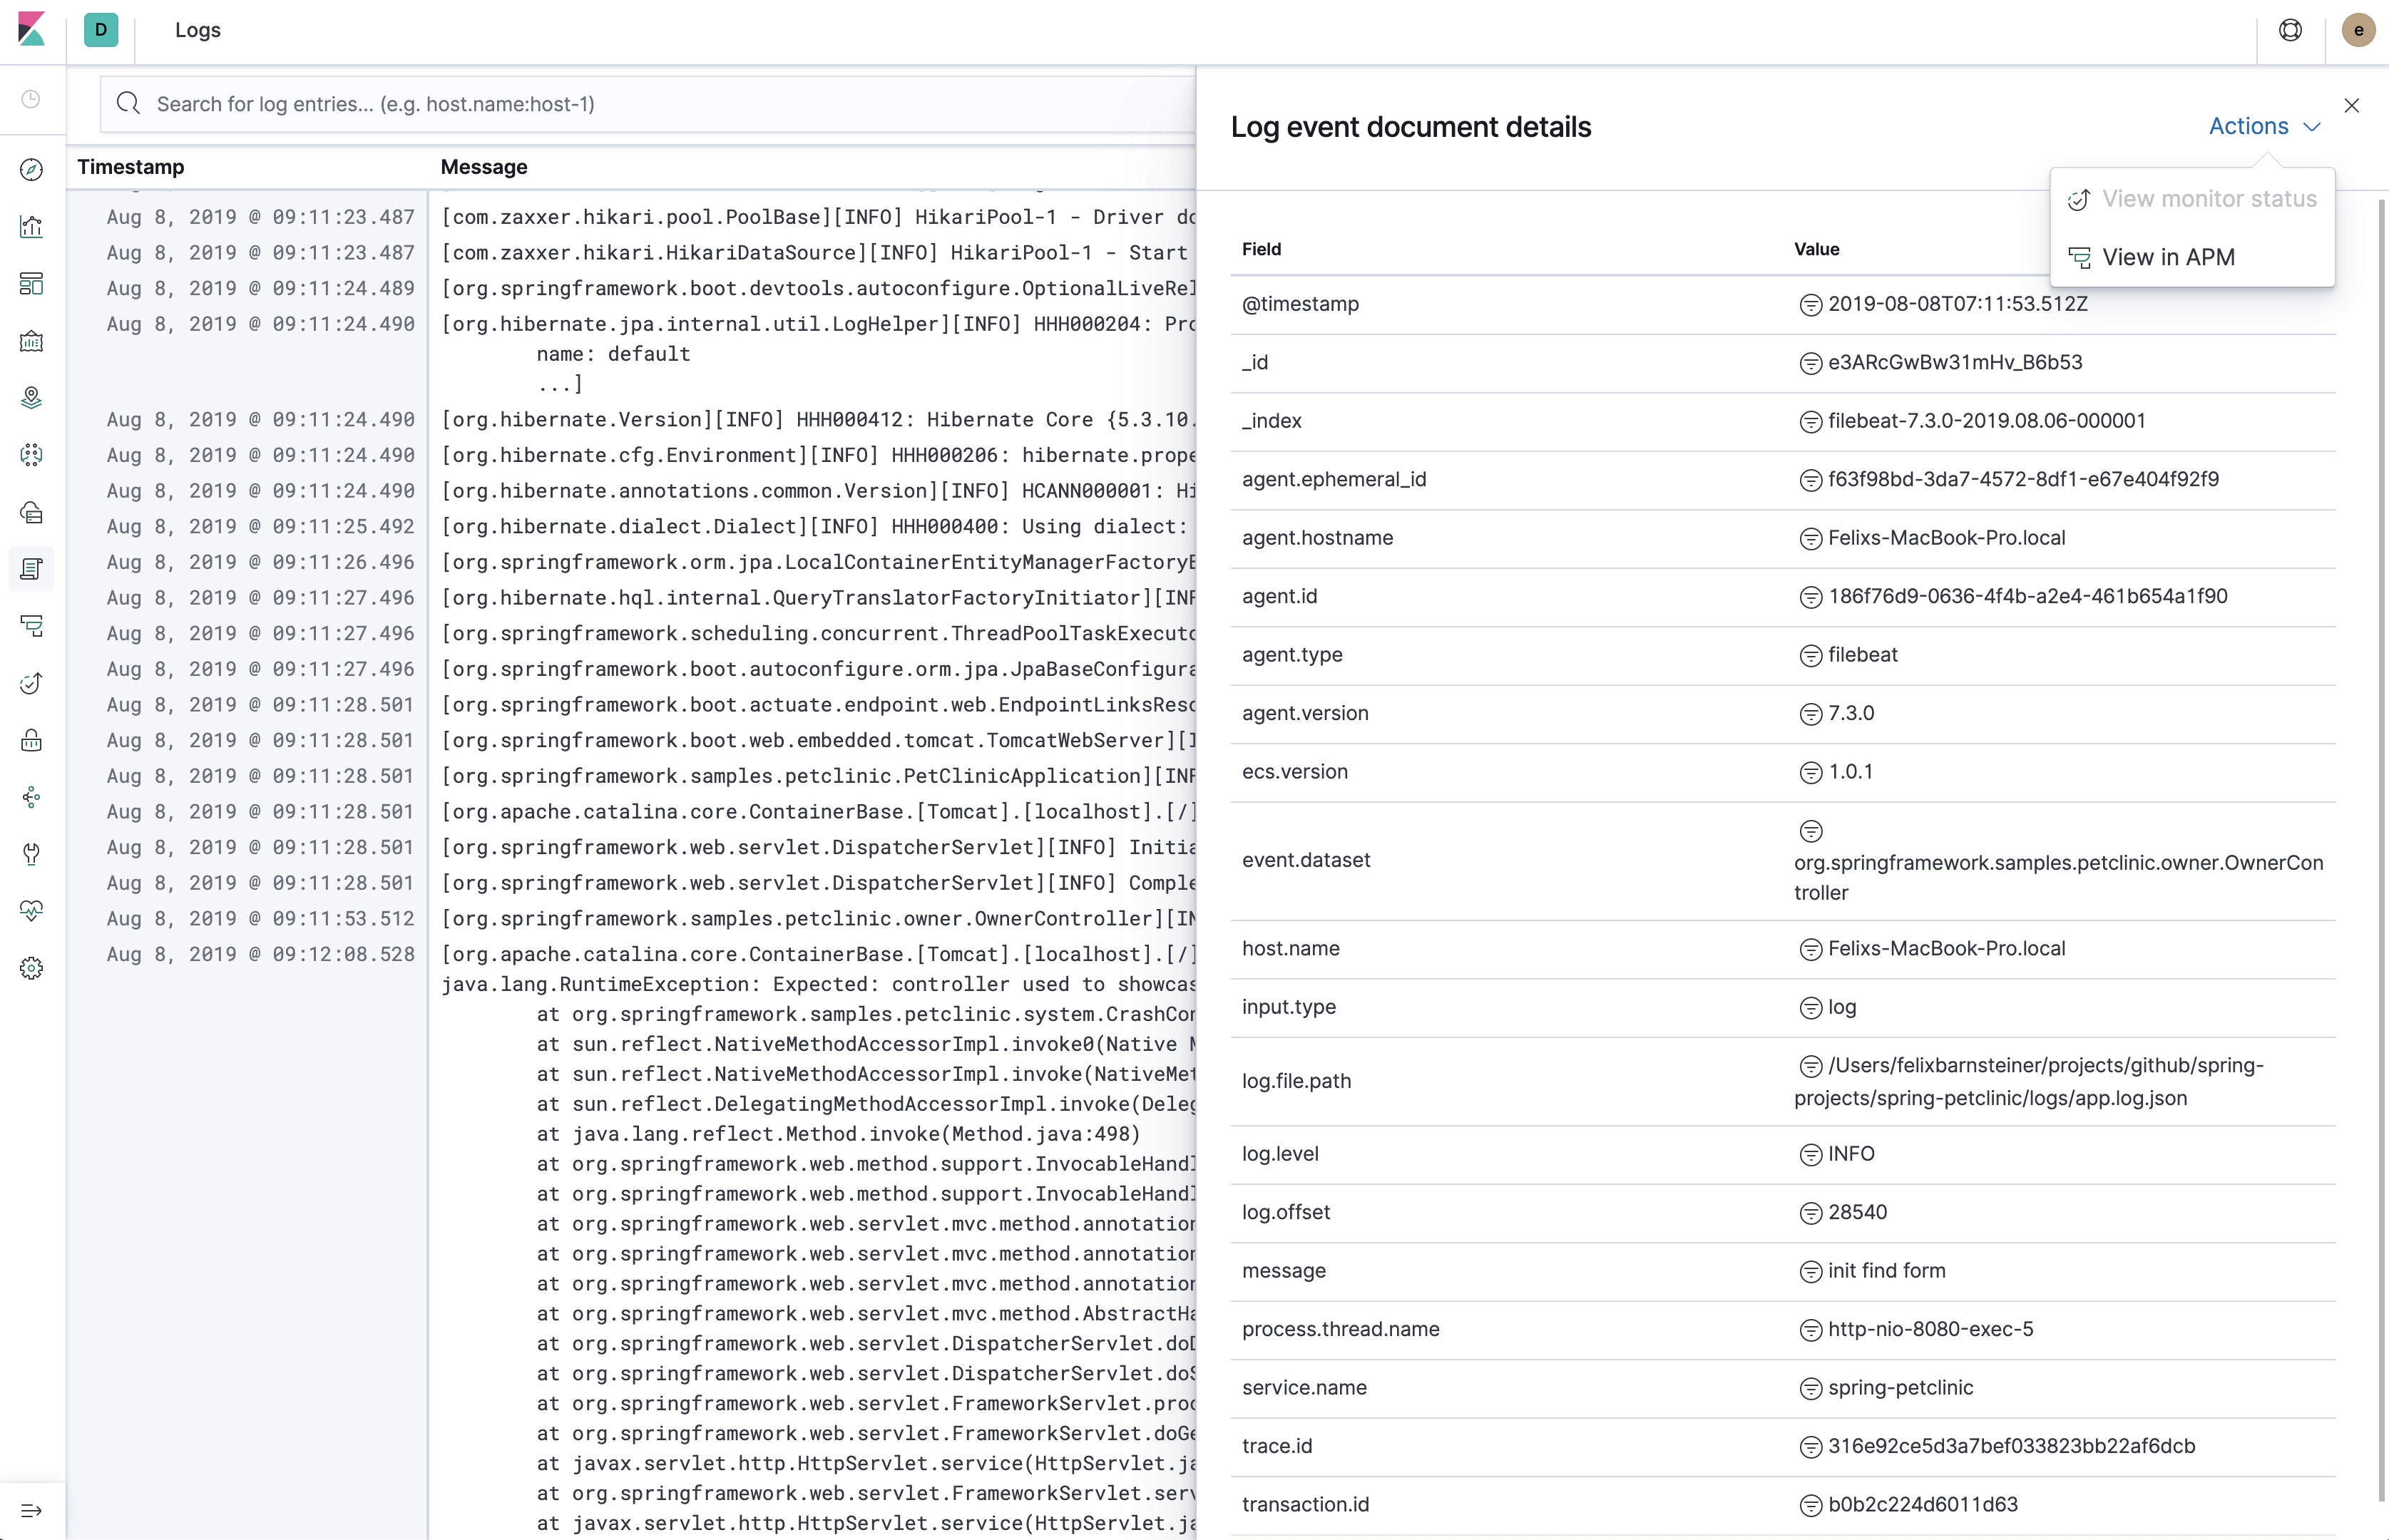
There's no additional configuration required to see a stack trace which is natively rendered and looks just the same as in a regular log file.

The disadvantage is that the whole stack trace is squashed into a single JSON line which makes them non-human readable.

Alternatives:

  • Rely on tools such as https://github.com/koenbollen/jl to view JSON logs and live with the fact that viewing them in plain does not give you a great experience when it comes to stack traces
  • Rely on plain-text logs which are logged alongside the JSON logs
  • Log the stack trace lines as JSON array elements
    • I'll have to check if Filebeat can cope with multi-line JSON but it probably can
    • Would it be instead of or in addition to printing the stacktrace in the message field?
      • If it's instead of, how do we make the Logs UI aware of it?
      • If it's in addition to, it means some overhead on disk. We could provide example Filebeat configurations on how to ignore the additional stacktrace array.
  • Render the exception in a more structured way, possibly in a format similar to https://github.com/elastic/apm-server/blob/master/docs/spec/errors/error.json#L52
    • Each stack trace element could be rendered in a new line so that it's easier human-readable.
    • Similar set of questions (in addition to or instead of stacktrace in message?)
      • If it's instead of, how do we make sure the log UI re-constructs the stacktrace in a way that's native to the corresponding programming language?

cc @pgomulka @ruflin @webmat @weltenwort

related: elastic/ecs#154

@weltenwort
Copy link
Member

There's no fundamental problem with making the Logs UI aware of a well-defined exception format and with rendering such exceptions.

If it's instead of, how do we make sure the log UI re-constructs the stacktrace in a way that's native to the corresponding programming language?

If the exception itself contained a language specifier we could add formatters for them (at an increased maintenance cost). But wouldn't one of the big advantages of an abstract exception format be that it is language-independent?

@pgomulka
Copy link
Contributor

in Elasticsearch exceptions are formatted as a JSON array where each element represent a line from a stactrace. This the allows to be formatted nicely in logs and hopefully is still readable.
a sample here: https://github.com/elastic/beats/pull/9988/files - filebeat is already compatible with this.
I would avoid formatting exception in a message field as this can really end up very complex and unusable for people personally looking into logs.
If possible I would aim to use only one type of layout, otherwise we end up with configuration duplication. Plaintext and json logs are supported in Elasticsearch at the moment only to give users time to migrate to JSON logs (expecting user's script and tools using plaintext logs at the moment)

@weltenwort
Copy link
Member

in Elasticsearch exceptions are formatted as a JSON array where each element represent a line from a stactrace

So it's an array of opaque strings? What's the advantage compared to just one string?

@pgomulka
Copy link
Contributor

readability. if you output a stactrace as a one (escaped) string in a json it will end up very long and won't give you much help.

@felixbarny
Copy link
Member Author

Thanks for the feedback so far.

Here's my proposal:

  • Work on an ECS definition of exception/stacktrace.
  • Add support for that in the Logs UI
  • Add a configuration setting in this library to choose between including the stacktrace as part of the message vs sending it in a structured way.
  • Document the Logs UI version which supports rendering the structured exception and recommend the stacktrace as plain-text for earlier versions.
  • Render the parsed stack trace elements as new lines so that they are decently human-readable

Similar to this:

  ..., "stack": [
  {"class": "org.elasticsearch.common.logging.JsonLoggerTests", "method": "testStacktrace", "line": 125},
  {"class": "org.elasticsearch.common.logging.JsonLoggerTests", "method": "testStacktrace", "line": 125}
]

That means we can start out with the status quo, which is including the opaque stack trace in the message field and transition to sending a structured stack trace.

The structured stack trace should support cause chains, suppressed exceptions and omission of common frames (... 42 more]). See also
https://docs.oracle.com/javase/7/docs/api/java/lang/Throwable.html#printStackTrace()

Example:

 Exception in thread "main" java.lang.Exception: Main block
  at Foo4.main(Foo4.java:6)
  Suppressed: Resource2$CloseFailException: Resource ID = 1
          at Resource2.close(Resource2.java:20)
          at Foo4.main(Foo4.java:5)
  Caused by: java.lang.Exception: Rats, you caught me
          at Resource2$CloseFailException.(Resource2.java:45)
          ... 2 more

@pgomulka
Copy link
Contributor

@felixbarny sounds like a plan, but I am a bit worried that the logs would end up too verbose. Give it a go, maybe the it won't be that bad. We can also ask for others opinions on whether this is acceptable.
Also bear in mind that splitting the stacktrace into separate field would break the tools that let you analyse stacktraces/logs which would make development inconvenient. See that Intellij IDEA won't see these logs as stactrace and won't help you navigate from logs to code. (both in IDE console & analyze window)

@felixbarny
Copy link
Member Author

I don't think that JSON logs have to be as readable as plain-text ones. After all, the intention is to view them via the Logs UI, for example. But I agree that they should be decently readable in scenarios where the logs don't make it to Elasticsearch for whatever reason.

For development, you'd probably use plain-text logs anyways, no?

@pgomulka
Copy link
Contributor

I agree they certainly won't be as readable as plain-text, but at the same time the goal behind using JSON is to keep them human readable. Verbosity and formatting are crucial I guess.

Plain text logs are just kept for backwards compatibility - to give time users to migrate. We will likely remove them in the future. Not sure which version yet.

Users and developers who will keep on visually check they logs should also be taken into consideration here once we will keep JSON logs only.

@webmat
Copy link

webmat commented Sep 12, 2019

From a schema perspective, the message field is meant to be human readable. I think it's fine to make it configurable for the user whether message contains only the exception message or the full plaintext stack trace (exception message followed by plaintext trace with indentation). This field is meant to be readable to the user, let's let these humans choose what goes in there ;-)

Windows event logs are another event source that have main messages that are (really) big pieces of structured text. So multiline message fields are not going away any time soon.

The idea of breaking out the stack trace into structured parts is interesting, and definitely worth looking into. But I don't think it has to be one or the other, however. I think it could also be an option that people enable, if they see the value, and agree with the added storage.

But after all, whether it's additive or replaces / streamlines the content of message is not a decision that needs to be encoded in the schema. The structure of the parsed out stack trace should be defined in the schema, but the content of message can totally be a user decision :-)

@felixbarny
Copy link
Member Author

felixbarny commented Sep 16, 2019

I have thought about that a little more and I think we don't have to come up with a schema for parsed stack traces just yet. I've created elastic/ecs#562 to have a dedicated error.stack_trace field.

I've prototyped adding the plain-text stack trace as an array so that it's human-readable:

{"@timestamp":"2019-09-15T15:22:41.048Z", "log.level":"ERROR", "message":"Servlet.service() for servlet [dispatcherServlet] in context with path [] threw exception [Request processing failed; nested exception is java.lang.RuntimeException: Expected: controller used to showcase what happens when an exception is thrown] with root cause", "process.thread.name":"http-nio-8080-exec-1","log.logger":"org.apache.catalina.core.ContainerBase.[Tomcat].[localhost].[/].[dispatcherServlet]","error.code":"java.lang.RuntimeException","error.message":"Expected: controller used to showcase what happens when an exception is thrown","error.stack_trace_lines":[
	"java.lang.RuntimeException: Expected: controller used to showcase what happens when an exception is thrown",
	"\tat org.springframework.samples.petclinic.system.CrashController.triggerException(CrashController.java:33)",
	"\tat sun.reflect.NativeMethodAccessorImpl.invoke0(Native Method)",
	"\tat sun.reflect.NativeMethodAccessorImpl.invoke(NativeMethodAccessorImpl.java:62)",
	"\tat sun.reflect.DelegatingMethodAccessorImpl.invoke(DelegatingMethodAccessorImpl.java:43)",
	"\tat java.lang.reflect.Method.invoke(Method.java:498)",
	"\tat org.springframework.web.method.support.InvocableHandlerMethod.doInvoke(InvocableHandlerMethod.java:190)",
	"\tat org.springframework.web.method.support.InvocableHandlerMethod.invokeForRequest(InvocableHandlerMethod.java:138)",
	"\tat org.apache.coyote.AbstractProtocol$ConnectionHandler.process(AbstractProtocol.java:853)",
	"\tat org.apache.tomcat.util.net.NioEndpoint$SocketProcessor.doRun(NioEndpoint.java:1587)",
	"\tat org.apache.tomcat.util.net.SocketProcessorBase.run(SocketProcessorBase.java:49)",
	"\tat java.util.concurrent.ThreadPoolExecutor.runWorker(ThreadPoolExecutor.java:1149)",
	"\tat java.util.concurrent.ThreadPoolExecutor$Worker.run(ThreadPoolExecutor.java:624)",
	"\tat org.apache.tomcat.util.threads.TaskThread$WrappingRunnable.run(TaskThread.java:61)",
	"\tat java.lang.Thread.run(Thread.java:748)"]}

The Filebeat configuration is a bit more complex with that setup, that's why I would disable that by default.

When it's enabled it's actually feasible to only have JSON logs as they are pretty human-readable.

@felixbarny
Copy link
Member Author

closed via #28

Sign up for free to join this conversation on GitHub. Already have an account? Sign in to comment
Labels
None yet
Projects
None yet
Development

No branches or pull requests

4 participants