Skip to content
New issue

Have a question about this project? Sign up for a free GitHub account to open an issue and contact its maintainers and the community.

By clicking “Sign up for GitHub”, you agree to our terms of service and privacy statement. We’ll occasionally send you account related emails.

Already on GitHub? Sign in to your account

Make "null values" visualization warning less obtrusive #14905

Closed
cjcenizal opened this issue Nov 10, 2017 · 4 comments
Closed

Make "null values" visualization warning less obtrusive #14905

cjcenizal opened this issue Nov 10, 2017 · 4 comments
Labels
Feature:Visualizations Generic visualization features (in case no more specific feature label is available) release_note:enhancement Team:Platform-Design Team Label for Kibana Design Team. Support the Analyze group of plugins. Team:Visualizations Visualization editors, elastic-charts and infrastructure

Comments

@cjcenizal
Copy link
Contributor

CC @elastic/kibana-design @elastic/kibana-visualizations

From https://discuss.elastic.co/t/kibana-keeps-displaying-notice-about-area-charts-and-null-values-even-after-i-change-the-chart-type/107094/3:

This [warning] happened after I added some new fields to my index and started populating them with data. If I'm graphing a timeframe that includes the time before those fields were added then they are in fact null and thus the message appears. If I change the timeframe to only include the time after I started populating those new fields then the message goes away.

image

This is a suboptimal UX because the message is misleading and the warning interferes with the visualization. I think we can address this with a couple changes:

  • We should probably remove the sentence, "A line chart is recommended when displaying data with null values," since it's confusing if the user is already using a line chart.
  • We should also probably hide the message itself and show an unobtrusive "warning" icon instead. Clicking the icon should display the message and allow you to dismiss both the message and the icon. @snide What do you think?

@elastic/kibana-sharing I'm CC'ing you too because this will have an impact on Dashboard panels.

@cjcenizal cjcenizal added Team:Platform-Design Team Label for Kibana Design Team. Support the Analyze group of plugins. Feature:Visualizations Generic visualization features (in case no more specific feature label is available) release_note:enhancement labels Nov 10, 2017
@ppisljar ppisljar assigned ppisljar and unassigned ppisljar Nov 17, 2017
@timroes timroes added the Team:Visualizations Visualization editors, elastic-charts and infrastructure label Sep 16, 2018
@willemdh
Copy link

willemdh commented Oct 9, 2018

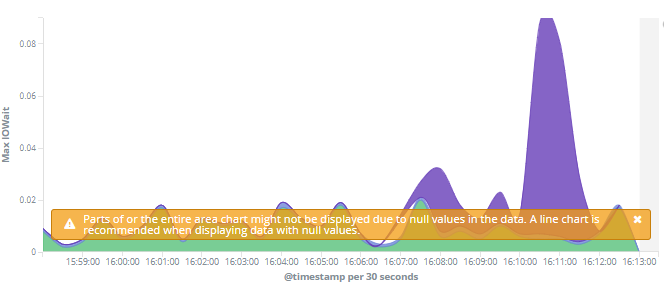
It would be much nicer if just a very small clickable warning icon would be shown instead of this huge orange warning...

image

In the above case I want to show the cumulative iowait, but this warning makes this graph unusable..

What makes it even worse, is that when change this into a line graph, the warning persists...

image

Grtz

@snide
Copy link
Contributor

snide commented Oct 9, 2018

These were the designs we had for this stuff originally. I agree that it shouldn't show inline unless the entire chart can't render.

image

@cchaos
Copy link
Contributor

cchaos commented Jan 15, 2019

If someone can help me get null values into the sample data, I can take a look into this one.

@ghudgins
Copy link

We no longer display errors in this format. Resolving this issue as we now show errors in toast messages

Sign up for free to join this conversation on GitHub. Already have an account? Sign in to comment
Labels
Feature:Visualizations Generic visualization features (in case no more specific feature label is available) release_note:enhancement Team:Platform-Design Team Label for Kibana Design Team. Support the Analyze group of plugins. Team:Visualizations Visualization editors, elastic-charts and infrastructure
Projects
None yet
Development

No branches or pull requests

7 participants