Empty row showing up in Kibana cluster status #55922
Labels
Team:Monitoring
Stack Monitoring team
Comments
|
Pinging @elastic/stack-monitoring (Team:Monitoring) |
Sign up for free
to join this conversation on GitHub.
Already have an account?
Sign in to comment
Kibana version:
7.4.2
Elasticsearch version:
7.4.2
Server OS version:
Browser version:
Browser OS version:
Original install method (e.g. download page, yum, from source, etc.):
Describe the bug:
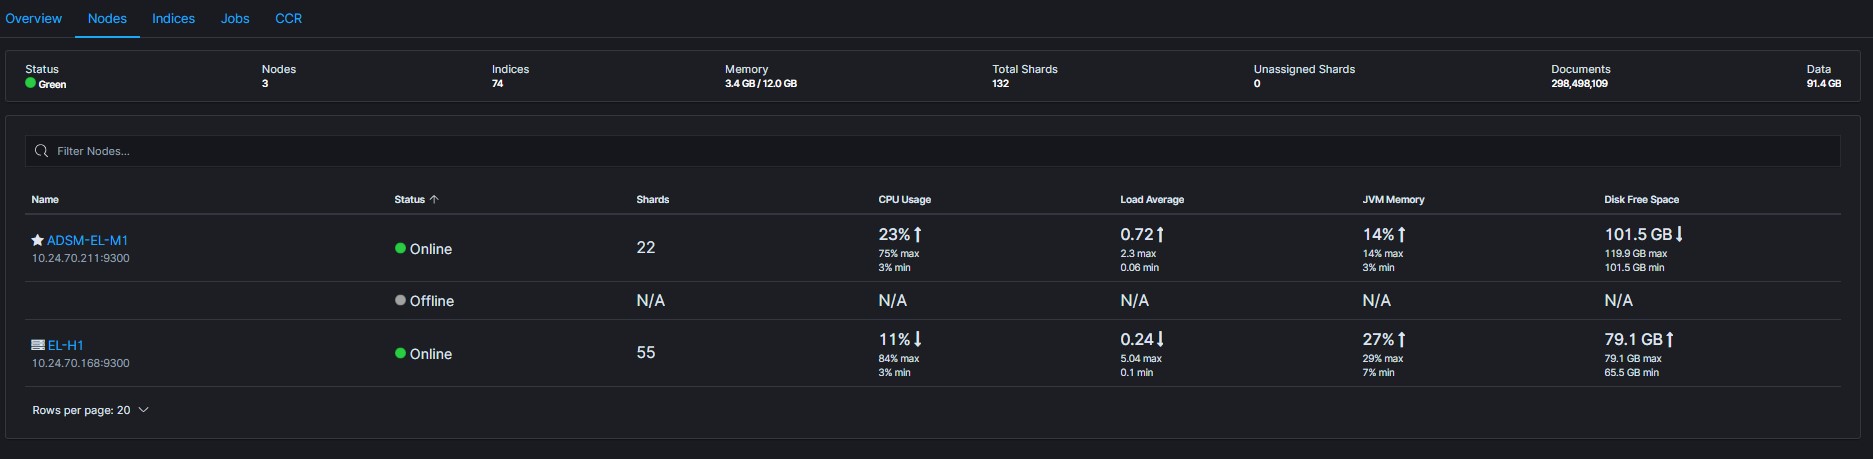
When working in Kibana for the cluster status, One of the nodes is showing offline and N/A for all of its stats, However the node count is showing its there and it is syncing with the cluster as expected on the back end. I have attached a picture of what Kibana, looks like.
the last time this happened after 24 hours the node came back to normal like it never happened. In addition, the last time we cleared the node using a node re-purpose and then kibana showed an extra node and the one online and the one offline but still acted as if there was an additional node. I don't see anything in either the ElasticSearch logs or the Kibana Logs that would indicate issues. additionally if i go back 5 hours in Kibana, the node shows up again.
Steps to reproduce:
Expected behavior:
Screenshots (if relevant):
Errors in browser console (if relevant):
Provide logs and/or server output (if relevant):
ADSM-ARES.log
kibana.log
Any additional context:
The text was updated successfully, but these errors were encountered: