Logging & Monitoring #5
Comments
|
I would like to take this issue if no one's assigned, please let me know of the specifics |
|
Hi @NovusEdge, Thank you for your interest! Of course! We'd be happy if you can contribute. Specs are in the discussion, as we're open to discuss, feel free to suggest or recommend anything related. You may create your branch from mine as a code base. Before start to work on it maybe you may write some description (kindda spec but not much detail - don't wanna take much of time) about the implementation, if we're agree on it, then you may start on it. How that sounds? |
|
My apologies, but it seems I wouldn't be able to work on this issue. 😞 |
|
It’s okay, no worries :)
|
|
Hi there, Also, |
|
Hi @sonerpyci, Thank you for stopping by. You got a point! As a matter of fact, we're already awaiting a reply from AppSignal for that support. Meanwhile can you tell us more what can you exactly provide to us, please? Thanks! |
|
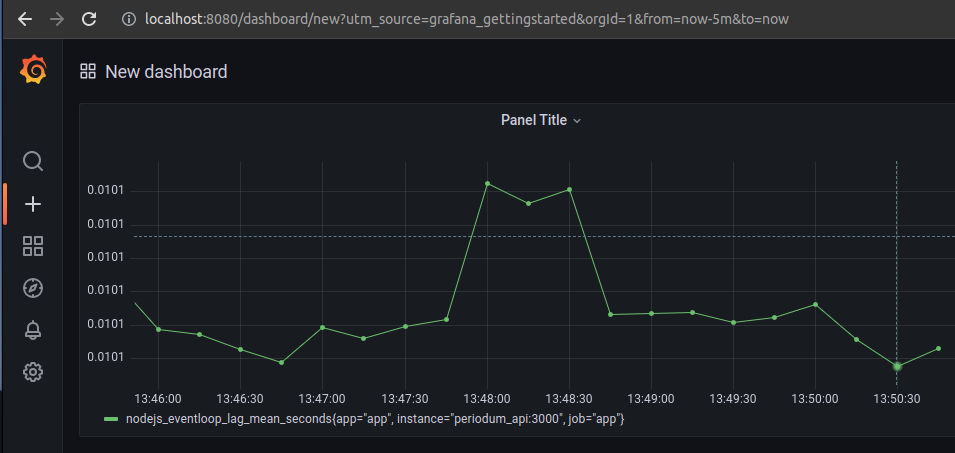
Hi @nesimtunc, When I left a comment on this issue, I've already prepared a working example of periodum-api with grafana and prometheus support on the same docker network. As prometheus is an open-sourced tool that enables collection of custom metrics and totally free, I believe it will be more suitable for this project. Let me attach an example image of my local version,
|
|
Hi @sonerpyci, Sounds good! Why don't send us a PR and we'll look into it. Btw, do you have DevOPS experience? |
|
Hi @nesimtunc, |
|
Hi @sonerpyci, Thank you for the PR, I have reviewed. Since, this is only for monitoring, I wonder do you have a recommended solution for logging? We want to log un/handled exceptions, and some other logs with severity, also needs to aggregate them. With your solution, we can aggregate HTTP status codes via Grafana but we also need a logging system instead of stdout (console) log. |
|
Hi @nesimtunc,
In case of any handled or unhandled exception, the logger middleware should log an additional field that contains exception details. In order to better examine the errors that occur, logs should be saved to a database or elastic search. I think there is no need to use a package to provide what I wrote above, I have designed a logger middleware before that works the same as above. |
|
Hi @nesimtunc, |
We need a logging and monitoring mechanism. We can use Winston
We can discuss here about our options: evrimagaci/periodum#76
This task can be done after #1 completed
The text was updated successfully, but these errors were encountered: