How to remove the "No"/"0" factor row? #12
Comments
|
As a temporary workaround, I wrote the function collapseBinary() which takes as input a finalfit output dataframe In: Out: Function: Use: You may have to change whatever your binary labels are, like "No" and "Yes" instead of "0" and "1" Hope it helps until there's something more general incorporated in the function! This would also be great for the OR plots |

|
Hi, You can install the github version of finalfit to access this. Example: Altering the OR plot can be done in a similar manner. This isn't as straightfoward and some examples will be added to future vignettes. A new "factorlist" object is created only containing the levels of interest, which is then passed to Example:
|
|
That's great, thank you! |
Hello,
Thanks for the great package!
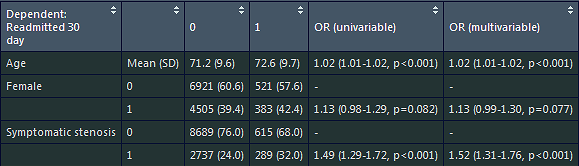
Is there an option remove the "0" row or the "No" row via the finalfit function? I use a lot of binary variables, and it would be nice just to show the row for the "1" or "Yes".
For example, in the picture above, having "Female" "1" "12888 (41.3)" "972 (44.7)" "1.15 (1.05-1.25, p=0.002" "1.15 (1.05-1.25, p=0.002" all in the same row with no row with "0" or "-".
The text was updated successfully, but these errors were encountered: