Getting negative prediction even all training data are greater than or equal to 0. #524
Comments
|
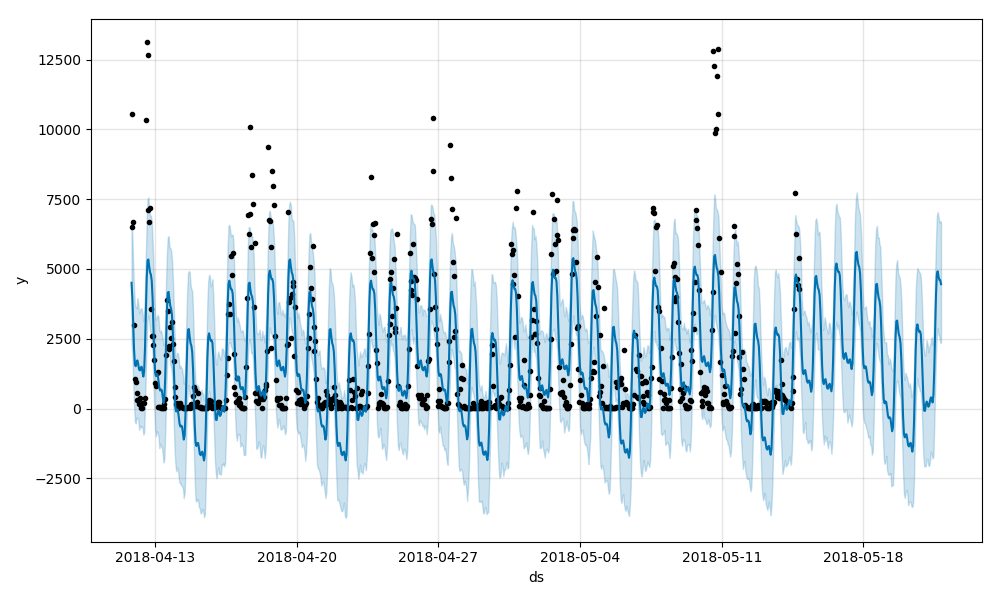
Prophet assumes constant daily component for all weekdays. The daily component on your data varies very much between weekdays and weekends. Thats why the fit is poor and you get negative predictions. |
|
thank you, but how to solve this problem? disable weekly seasonality? or how can I remove the effect of weekends? @vhpietil |
|
See #434 for lenghty discussion about the same problem. Are you interested in predicting all days? If you are not interesten in weekends for example, you can remove them from the training data and you can forecast weekdays better. |
|
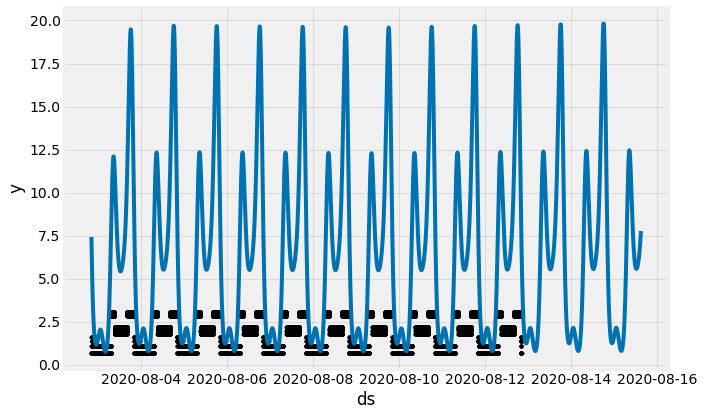
yes, I want to remove weekend,and I try disable weekly seasonality, which improves the prediction to some extend. But is it like prophet can not fit a cure that change rapidly everyday? like the graph above, cause I don't want to treat that part of data as outliers. and I would like to fit them onto the graph. thank you for your help |

|
+1 for what @vhpietil says, this is the same issue from #434 and his suggestion to separate out weekends and weekdays is a great option (and did indeed produce a much better forecast). Here you separated out weekdays to get predictions just for them: let's call that Alternatively, you can have just one model that makes predictions for all data by creating extra regressors for the weekday daily seasonality. This is a lot more effort, but @vhpietil gives a working example in #434. The Prophet model treats weekly seasonality and daily seasonality as being entirely separate components, and does not have a concept of daily-seasonality-that-depends-on-day-of-week. This is a recurring issue and so definitely the procedure from #434 needs to be made easier and put in the documentation. |
|
I'm going to go ahead and close this, and consolidate the general issue of having seasonalities that depend on other factors in #538, so follow along there for updates. |
|
A simple trick can be take natural log of the 'y' after incrementing by 1(avoid the situations take the log of zeros and negative values). |
|
Hi I did your trick of taking the log and getting a forecast but it gives me prediction that is way above my datapoints. My code looks like this: |
|
@HarilalOP that trick works, thank you! Is there a way to return my values back to the original when using |
|
A simpler trick for handling daily patterns that change over the course of the week is to disable explicit daily seasonality, and increase the resolution of weekly seasonality so it can capture daily patterns. E.g |
Hello,
Thanks for this great tool!
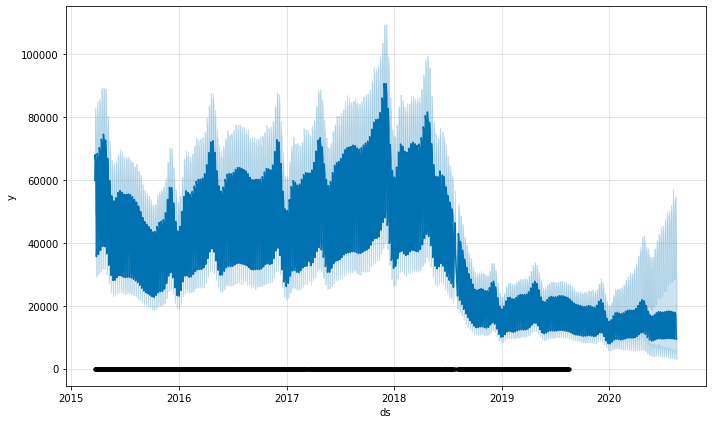
Recently, I ran into this issue, even I fed in a set of positive data, the prediction contains some negative results. The input file is here:
example1.txt
Prediction:
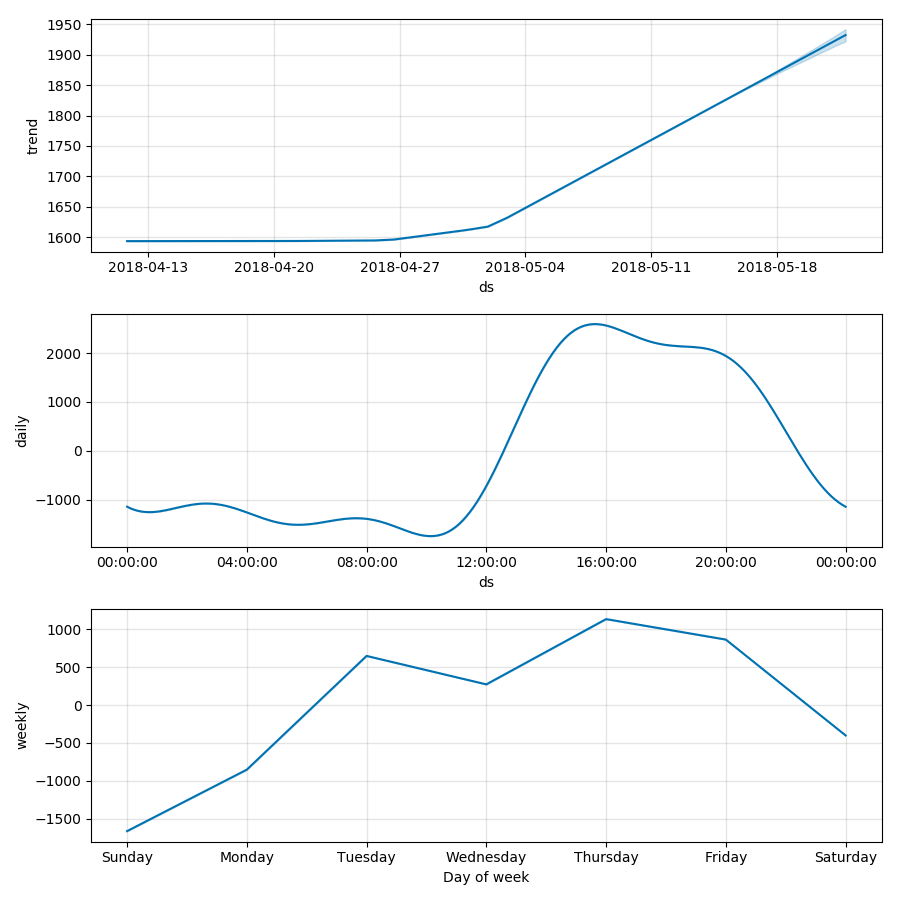
Trend and seasonality:
Cheers,
Stephen
The text was updated successfully, but these errors were encountered: