Skip to content
New issue

Have a question about this project? Sign up for a free GitHub account to open an issue and contact its maintainers and the community.

By clicking “Sign up for GitHub”, you agree to our terms of service and privacy statement. We’ll occasionally send you account related emails.

Already on GitHub? Sign in to your account

Bug: devtools "rendered at" for child components uses value of top component #18818

Open
eps1lon opened this issue May 4, 2020 · 8 comments
Open
Labels
Component: Developer Tools React Core Team Opened by a member of the React Core Team Status: Unconfirmed A potential issue that we haven't yet confirmed as a bug

Comments

@eps1lon
Copy link
Collaborator

eps1lon commented May 4, 2020

React version: 17.0.2
devtools version: 4.18.0-f58bbcf9a

Steps To Reproduce

  1. Record profiling session
  2. Goto flamegraph
  3. Click on a "bar" that's not the top-most

Link to code example: https://codesandbox.io/s/vibrant-thunder-bm3so

The current behavior

"rendered at" uses the value from the root component

devtools-profiler-rendered-at

The expected behavior

it should use the same value that is displayed in the tooltip. Otherwise I don't see much value in displaying it since I could just read the value directly from the root. I thought it was intended for very dense flamegraphs e.g.
Screenshot from 2020-05-04 19-53-53

@eps1lon eps1lon added the Status: Unconfirmed A potential issue that we haven't yet confirmed as a bug label May 4, 2020
@stale
Copy link

stale bot commented Oct 12, 2020

This issue has been automatically marked as stale. If this issue is still affecting you, please leave any comment (for example, "bump"), and we'll keep it open. We are sorry that we haven't been able to prioritize it yet. If you have any new additional information, please include it with your comment!

@stale stale bot added the Resolution: Stale Automatically closed due to inactivity label Oct 12, 2020
@stale stale bot removed the Resolution: Stale Automatically closed due to inactivity label Nov 19, 2020
@eps1lon eps1lon changed the title Bug: devtools profiler flamegraph "rendered at" tooltip equal for all entries Bug: devtools "rendered at" for child components uses value of top component Nov 19, 2020
@eps1lon
Copy link
Collaborator Author

eps1lon commented Nov 19, 2020

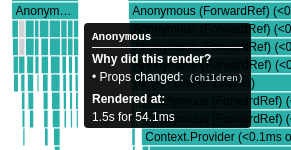
The tooltip is fine now but the description in the right column seems misleading to me.

@eps1lon
Copy link
Collaborator Author

eps1lon commented Sep 19, 2021

Can still reproduce in latest DevTools and React version. @bvaughn Am I misunderstanding what the "rendered at" in the side-panel is supposed to say?

@bvaughn
Copy link
Contributor

bvaughn commented Sep 19, 2021

The "rendered at" time in this label is not specific to the component. It's describing the commit that the component rendered as part of. If you have suggestions for changing the label, I'm open to hearing them.

I think we could use the Fiber's actualStartTime flag to read the time when the specific Fiber was worked on, if that would be helpful, but we'd have to eager traverse the Fiber tree and collect these times for every fiber while profiling since they're reset each time the Fiber is worked on.

@eps1lon
Copy link
Collaborator Author

eps1lon commented Sep 19, 2021

The "rendered at" time in this label is not specific to the component.

When you mean "label" you refer to the side-panel?

What I don't understand is why we do display different information in the tooltip. I would just expect the same timings displayed in the tooltip to appear in the side-panel. Because it's a bit unintuitive that the side-panel would first show a timing alpha with the heading "commit information" and also display that exact same timing alpha with the heading "SpinCPU" (i.e. the component name).

Basically we have timing alpha but depending on what context we're in, we display it differently.

Commit information
commited at: $CommitedAtAlpha
Render duration: $RenderDurationAlpha

vs

SpinCPU
Rendered at:
$CommittedAtAlpha for $RenderDurationAlpha

CommittedAt and $RenderDuration do not change at all.

If you have suggestions for changing the label, I'm open to hearing them.

Don't display "rendered at" under the component header because it's not specific to the component.

Instead

SpinCPU
Why did this render?
This is the first time the component rendered.

Commit information
commited at: $CommitedAtAlpha
Render duration: $RenderDurationAlpha

Though ultimately I would still prefer to display the timing information of the tooltip in the side-panel. You have to be very precise to view the component specific timing depending on the hoverable area.

SpinCPU
$TooltipTimeA of $TooltipTimeB
Why did this render?
This is the first time the component rendered.

Commit information
commited at: $CommitedAtAlpha
Render duration: $RenderDurationAlpha
```

@stale
Copy link

stale bot commented Jan 8, 2022

This issue has been automatically marked as stale. If this issue is still affecting you, please leave any comment (for example, "bump"), and we'll keep it open. We are sorry that we haven't been able to prioritize it yet. If you have any new additional information, please include it with your comment!

@stale stale bot added the Resolution: Stale Automatically closed due to inactivity label Jan 8, 2022
@eps1lon
Copy link
Collaborator Author

eps1lon commented Jan 13, 2022

Bump

@stale stale bot removed the Resolution: Stale Automatically closed due to inactivity label Jan 13, 2022
Copy link

This issue has been automatically marked as stale. If this issue is still affecting you, please leave any comment (for example, "bump"), and we'll keep it open. We are sorry that we haven't been able to prioritize it yet. If you have any new additional information, please include it with your comment!

@github-actions github-actions bot added the Resolution: Stale Automatically closed due to inactivity label Apr 10, 2024
@eps1lon eps1lon added React Core Team Opened by a member of the React Core Team and removed Resolution: Stale Automatically closed due to inactivity labels Apr 11, 2024
Sign up for free to join this conversation on GitHub. Already have an account? Sign in to comment
Labels
Component: Developer Tools React Core Team Opened by a member of the React Core Team Status: Unconfirmed A potential issue that we haven't yet confirmed as a bug
Projects
None yet
Development

No branches or pull requests

3 participants