This is a Keras implementation of the models described in An Image is Worth 16x16 Words: Transformes For Image Recognition at Scale. It is based on an earlier implementation from tuvovan, modified to match the Flax implementation in the official repository.
The weights here are ported over from the weights provided in the official repository. See utils.load_weights_numpy to see how this is done (it's not pretty, but it does the job).
Install this package using pip install vit-keras
You can use the model out-of-the-box with ImageNet 2012 classes using something like the following. The weights will be downloaded automatically.
from vit_keras import vit, utils

image_size = 384
classes = utils.get_imagenet_classes()
model = vit.vit_b16(
    image_size=image_size,
    activation='sigmoid',
    pretrained=True,
    include_top=True,
    pretrained_top=True
)
url = 'https://upload.wikimedia.org/wikipedia/commons/d/d7/Granny_smith_and_cross_section.jpg'
image = utils.read(url, image_size)
X = vit.preprocess_inputs(image).reshape(1, image_size, image_size, 3)
y = model.predict(X)
print(classes[y[0].argmax()]) # Granny smith
You can fine-tune using a model loaded as follows.
image_size = 224
model = vit.vit_l32(
    image_size=image_size,
    activation='sigmoid',
    pretrained=True,
    include_top=True,
    pretrained_top=False,
    classes=200
)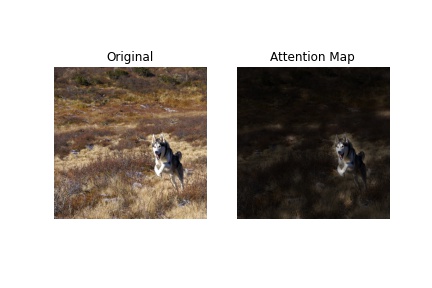
# Train this model on your data as desired.There's some functionality for plotting attention maps for a given image and model. See example below. I'm not sure I'm doing this correctly (the official repository didn't have example code). Feedback /corrections welcome!
import numpy as np
import matplotlib.pyplot as plt
from vit_keras import vit, utils, visualize

# Load a model
image_size = 384
classes = utils.get_imagenet_classes()
model = vit.vit_b16(
    image_size=image_size,
    activation='sigmoid',
    pretrained=True,
    include_top=True,
    pretrained_top=True
)
classes = utils.get_imagenet_classes()

# Get an image and compute the attention map
url = 'https://upload.wikimedia.org/wikipedia/commons/b/bc/Free%21_%283987584939%29.jpg'
image = utils.read(url, image_size)
attention_map = visualize.attention_map(model=model, image=image)
print('Prediction:', classes[
    model.predict(vit.preprocess_inputs(image)[np.newaxis])[0].argmax()]
)  # Prediction: Eskimo dog, husky

# Plot results
fig, (ax1, ax2) = plt.subplots(ncols=2)
ax1.axis('off')
ax2.axis('off')
ax1.set_title('Original')
ax2.set_title('Attention Map')
_ = ax1.imshow(image)
_ = ax2.imshow(attention_map)