New issue
Have a question about this project? Sign up for a free GitHub account to open an issue and contact its maintainers and the community.
By clicking “Sign up for GitHub”, you agree to our terms of service and privacy statement. We’ll occasionally send you account related emails.
Already on GitHub? Sign in to your account
view long term data charts #397
Comments
|
Yes you are right. However the history netdata has today is too short (1 hour by default). Why? Netdata tracks about 1.500 metrics on most systems (more depending on how many disks, network cards, applications, etc you use - I have a server with 5.000 metrics) and it collects data per second. Do the math with 4 bytes per metric per second. The size of the database gets astronomical for a month of data: 4 bytes * 1500 dimensions * 86400 seconds per day * 30 days = 15.552.000.000 = 15.5 GB It is not practical to have so much storage for just performance data. |
|
Graph data would need to be condensed down to the unit. So no zoom. So we would never have to store second granularity past the first hour, nor have to store minute granularity past a day. Maybe these time frames are just approximate, and its really just a matter of figuring out the pixel width of a time period. The pixel width of the year chart may only be 600 pixels wide which means that 2 rows of data per day would be enough (or one row of data every 39.45 hours to be more exact.) |
|
These will only be useful as statistics of past performance. There is already a task to create snapshots #309. Snapshots could create what you propose, So every hour a snapshot is taken with 1 minute detail, every day a snapshot with 1 hour detail, etc. I'll mark this as duplicate for snapshots. |
|
Cleaning up day. I am closing this, but keep in mind netdata has now support for backend servers (graphite, opentsdb) so long term data archiving is implemented. |
|
I think netdata would need at least some basic way to see out zoomed trends to replace munin once and for all. I think a lot of people don't want to go through setting up Grafana (graphite, elastic, prometheus) for this. Perhaps keep this in mind in case you can think of a quick hack that would do that trick ;) |
|
I agree with @jpic Netdata would be great if we could also have long term data / trends having to install two system would make easier to install one that does it all. |
|
@ktsaou The hourly, daily, weekly, monthly, yearly would not cost much space. You can setup 5 more RRD databases. One record in hourly database is the average of recent 60 minutes data. One record in daily database is the average of recent 24 hours data. etc. It is simple, right? |
|
@ktsaou
So when there are no automatic snapshots, how can we have a long-term view on the data? |
|
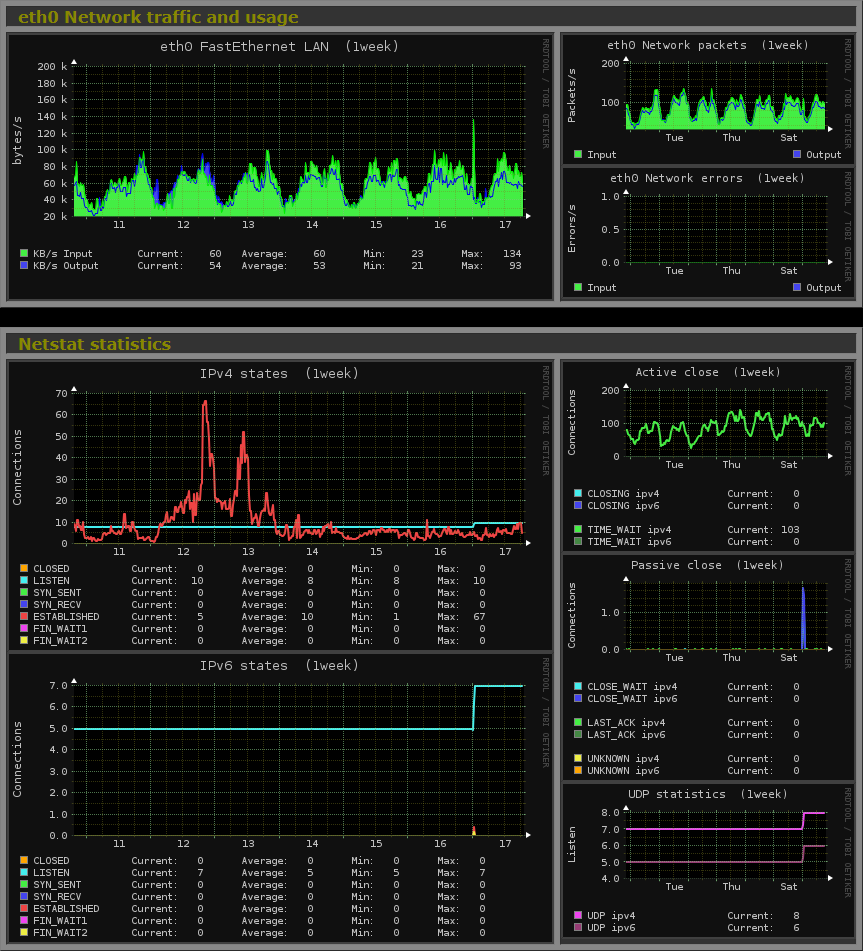
Comming from Monitorix, it's pretty different to view real-time rather than long therm. I've never monitored my server's resources so closely and real-time before, and it makes it hard to compare with yesterday for example. The only thing that would fulfill my request towards netdata is this function. So far, I'm really impressed by all the stats, functions and user friendliness.. But it just needs this function and I would give it a 10/10 |
|
+1 for a long time chart feature |
|
Since this issue was referenced recently, I'm linking it with our plan to change the database so that we can reduce the memory requirements and increase the retention period. The issue with the new design is #4687 |


I would like the ability to click on a chart get historical cumulative data over different time frames. Daily, Weekly, Monthly. This would allow me to check changes in usage patterns over longer periods.
The text was updated successfully, but these errors were encountered: