TiledDataPrep
This page describes a workflow for preparing tiled data for use in the ga-worldwind-suite. The workflow described here is targeted at the preparation of raster/vector/DEM data for delivery via the web.
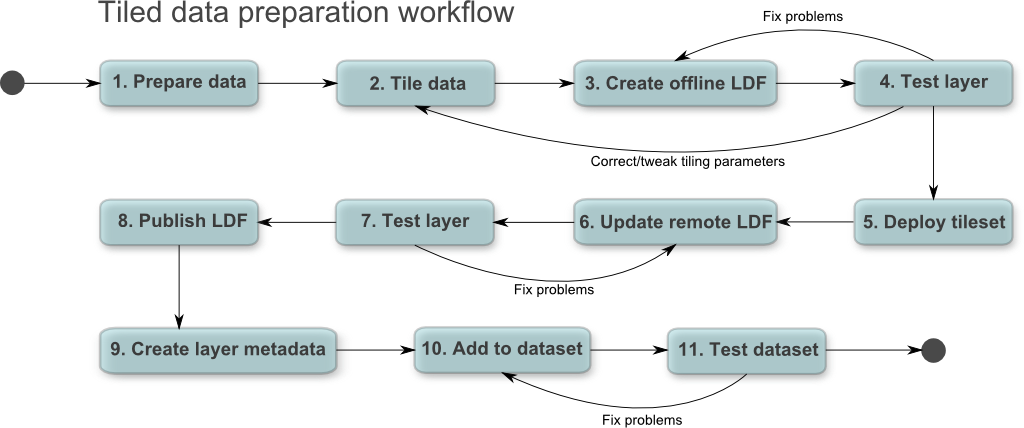
- Prepare data
- Tile data
- Create offline Layer Definition File (LDF)
- Test layer (local)
- Deploy tileset
- Update remote LDF
- Test layer (remote)
- Publish LDF
- Create layer metadata
- Add layer to dataset
- Test dataset
For a detailed description of the Layer Definition File (LDF) format, see the Layer Definition File Specification document.
## 1. Prepare data ## The first step is to prepare the data for use. This includes:- Ensuring the data is correct (e.g. data validation)
- Ensuring colouring etc. meets your agency's guidelines and standards (if applicable)
- Ensuring data is approved for release (if applicable)
- Ensuring the data is in a format that can be read by the
Tilertool (see here for a list of supported raster/DEM formats and here for a list of supported vector formats).
At this point you might also want to consider re-projecting your data into the correct projection (WGS84 geodetic Lat/Lon; EPSG:4326). The Tiler is able to do this re-projection on-the-fly, but it will slow the tileset generation process and you may want to QA the reprojected data before tiling it. The gdalwarp utility is an easy way to re-project raster/DEM data if needed.
In the case of complex vector data, where the intention is to tile it into a raster tileset, this phase should include generation of a Mapnik XML map definition. See the Mapnik wiki for more information on this process.
## 2. Tile data ## Once the dataset has been prepared and validated etc. it needs to be processed into a 'tileset' so that it can be viewed efficiently within the `Viewer`.A 'tileset' is comprised of a number of levels, which represent the source data at various resolutions (from low- to high-resolution). Each of these levels is then subdivided into tiles indexed by row and column. The result is a 'pyramid' structure of images that allows for efficient retrieval and display of the data. A good description of the tileset format used by the World Wind SDK is available here.
The World Wind SDK, and hence the ga-worldwind-suite uses tilesets for a number of reasons, including:
-
They make transfer over the web more efficient
(individual tiles can be sent as needed, rather than having to transfer the entire source data) -
They make viewing within the virtual globe more efficient
(the optimal pre-computed tile can be selected rather than re-scaling the source data) -
They allow visual enhancements to be 'baked' into the tilesets
(rather than computed at runtime) -
They don't require that the client has access to the source data
(desirable in some circumstances)
There are a number of tools available that can generate a tileset suitable for use by the ga-worldwind-suite. This guide assumes that the Tiler application included in the ga-worldwind-suite is being used. For information on the Tiler, see it's README.md file.
Below are examples for:
These examples use the GUI interface for the Tiler. The Tiler application also has a command line interface (CLI) that allows tiling to be performed without the GUI. This is useful for batch-processing tileset generation, or for including tileset generation as part of a larger data preparation process.

-
Select dataset
Select the dataset in the 'input' panel (left). If the dataset loads successfully you should be presented with a summary of the data along with a preview. -
Select tile type
For raster image data, chooseImages -
Select a level zero tile size
This will affect the number of tiles generated in the tileset. The default is 36.0°. Try experimenting with different values around 36.0° and see how it affects the number of tiles (in the summary panel). TheCalculate Optimalbutton will calculate a level zero tile size that minimises the number of tiles in the tileset without sacrificing image quality. -
Select an output format
Choose between JPG and PNG. Each format has its pros and cons.JPEG
- Allows more control over tile compression
- May result in smaller tilesets
- Effective for 'complex' data such as satellite imagery etc.
- Does not support transparency
- May result in compression artefacts visible in the tileset
PNG
- Supports alpha channels (transparency)
- Lossless compression (i.e. no compression artefacts)
- Effective for images with large regions of the same colour (classifications etc.)
- May not achieve the same compression rates as JPEG.
You may like to try both formats to evaluate the tradeoff between tileset size and visual appearance.
-
Decide if bilinear filtering is appropriate
When scaling the source dataset to generate the tileset levels, theTilergives the option of using bilinear filtering. This filtering technique will give 'smooth' looking scaling which may make some datasets appear blurry. If image sharpness is important, or if pixel colours are meaningful (e.g. in a classification), it may be more appropriate to use nearest-neighbour filtering. To use this filtering option, simply disable theUse bilinear filtering...options. -
Decide on a colour value to use outside the image extents
This colour will be used for all pixels outside the image extents, and is similar to a NODATA value.For PNG image output, it usually makes sense to set this to
(0,0,0,0)which will make all pixels outside the source data extents transparent.Alternatively, by selecting a colour which does not appear in the source data, simple colour replacement can be used in the layer definition file (LDF) to make these areas transparent.
If none of these are an option (e.g. in JPEG-compressed satellite imagery etc.) leave this section unchecked and use a mask to remove areas outside the source data extents.
-
Perform any required colour replacements
This option allows colour ranges to be removed and set to a user-defined value. Use cases for this option include:- To remove a NODATA colour (when using PNG output, replace all NODATA colour with a completely transparent colour
(0,0,0,0)). - To clean up noise (for example, clamp all colours close to white to solid white)
- To change classification colours to some other colour (usually this is best done during the data preparation phase, but at a pinch can be done during tiling)
- To remove a NODATA colour (when using PNG output, replace all NODATA colour with a completely transparent colour
-
Select output location for the tileset
The output location can be specified using theOutput directoryfield. This should be the folder the tileset will be stored in. -
Generate tiles This will begin the tiling process. Progress is reported in the info panel at the bottom of the GUI.
-
Select dataset
Select the dataset in the 'input' panel (left). If the dataset loads successfully you should be presented with a summary of the data along with a preview. -
Select tile type
For DEM data, chooseElevations -
Select a level zero tile size
This will affect the number of tiles generated in the tileset. The default for DEM data is 20.0°. Try experimenting with different values around 20.0° and see how it affects the number of tiles (in the summary panel). -
Select an output cell type
This option controls the format of the output BIL files. In most cases this should be chosen to match the input data type (shown in the input summary panel). If a cell type is chosen that is less precise than the source data, truncation may occur. -
Decide if bilinear filtering is appropriate
When scaling the source dataset to generate the tileset levels, theTilergives the option of using bilinear filtering. This filtering technique will give 'smooth' looking scaling which may make some datasets appear blurry. If terrain sharpness is important, or if pixel colours are meaningful (e.g. in a classification), it may be more appropriate to use nearest-neighbour filtering. To use this filtering option, simply disable theUse bilinear filtering...options. -
Set the NODATA value to use in the output
This should be a sensible value given the range of the input data. The standard values commonly used are -9999 for integer formats and -99999.0 for 32 bit float formats. -
Perform any required elevation replacements
This option allows elevation ranges to be removed and set to a user-defined value. Use cases for this option include:- To clamp elevations close to NODATA to NODATA (to account for precision issues when using floats etc.)
- To remove all elevation information below/above a threshold (e.g. remove all bathymetry)
-
Select output location for the tileset
The output location can be specified using theOutput directoryfield. This should be the folder the tileset will be stored in. -
Generate tiles This will begin the tiling process. Progress is reported in the info panel at the bottom of the GUI.

-
Select dataset
Select the dataset in the 'input' panel (left). If the dataset loads successfully you should be presented with the data extents, along with a preview. -
Select data extents
This is useful if you only want to tile a specific sub-region of the dataset. -
Select a level zero tile size
This will affect the number of tiles generated in the tileset. The default is 36.0°. Try experimenting with different values around 36.0° and see how it affects the number of tiles (in the summary panel). -
Select the number of levels in the tileset
Because the data is vector information, there is no real concept of "native resolution", and tiles can be generated to any number of levels desired.A good point to remember when choosing the number of levels is that for each level, the number of degrees spanned by the tile halves. The table below lists approximate distances spanned by tiles in each level of a tileset with a level 0 tile size of 36.0° (the default).
Note that these values are approximations at the equator and will change with latitude.Level Tile size Distance (approx) 0 36.000° 4000km 1 18.000° 2000km 2 09.000° 1000km 3 04.500° 500km 4 02.250° 250km 5 01.125° 125km 6 00.563° 60km 7 00.281° 30km 8 00.141° 15km -
Select an output format
Choose between JPG and PNG. Each format has its pros and cons (as above). In general, PNGs are most suitable for vector data. -
Decide whether to use Mapnik for all levels If enabled, Mapnik will be used to rasterise the vector data for each level. This means that line widths etc. will change as the user zooms in and out of the data, and that each level in the tileset will have crisp boundaries. If disabled, Mapnik will be used to rasterise the lowest (highest resolution) level only, and then this image will be scaled for all other levels. This has the advantage of reducing tiling time, but may result in blurry or lower-quality appearance at higher levels.
-
Select output location for the tileset
The output location can be specified using theOutput directoryfield. This should be the folder the tileset will be stored in. -
Generate tiles This will begin the tiling process. For vector data this can take quite a long time. Each tile is rasterised individually, and for large/complex vector data this can be expensive.
Once the tileset is generated, a 'local' LDF should be created to test the tileset before it is published to the web.
The following is an example of a local (offline) LDF that will read tiles from the newly generated tileset. A summary of the important elements is provided below. For a more detailed description of the LDF format see the Layer Definition File Specification document.
<?xml version="1.0" encoding="UTF-8"?>
<Layer version="1" layerType="TiledImageLayer">
	<DisplayName>My Layer Name</DisplayName>
	<Service serviceName="DelegatorTileService">
		<URL>./tilesets</URL>
	</Service>
	<Delegates>
		<Delegate>LocalRequester</Delegate>
	</Delegates>
	<LastUpdate>12 08 2011 00:00:00 GMT</LastUpdate>
	<DatasetName>mylayer</DatasetName>
	<DataCacheName>MyOrg/Category/myLayer</DataCacheName>
	<ImageFormat>image/jpg</ImageFormat>
	<AvailableImageFormats>
		<ImageFormat>image/jpg</ImageFormat>
	</AvailableImageFormats>
	<FormatSuffix>.jpg</FormatSuffix>
	<NumLevels count="7" numEmpty="0" />
	<TileOrigin>
		<LatLon units="degrees" latitude="-90" longitude="-180" />
	</TileOrigin>
	<LevelZeroTileDelta>
		<LatLon units="degrees" latitude="36" longitude="36" />
	</LevelZeroTileDelta>
	<TileSize>
		<Dimension width="512" height="512" />
	</TileSize>
	<Sector>
		<SouthWest>
			<LatLon units="degrees" latitude="-43.7605" longitude="112.8995" />
		</SouthWest>
		<NorthEast>
			<LatLon units="degrees" latitude="-8.9995" longitude="153.6705" />
		</NorthEast>
	</Sector>
	<UseTransparentTextures>true</UseTransparentTextures>
	<ForceLevelZeroLoads>true</ForceLevelZeroLoads>
	<RetainLevelZeroTiles>true</RetainLevelZeroTiles>
	<TextureFormat>image/dds</TextureFormat>
	<UseMipMaps>true</UseMipMaps>
</Layer>
Important bits:
-
<Service serviceName="DelegatorTileService">
TheDelegatorTileServiceallows the use of the delegate mechanism which allows for local tile reading and various filters etc. to be applied. -
<Delegate>LocalRequester</Delegate>
TheLocalRequesterdelegate overrides the default (remote) tile retrieval mechanism and allows tiles to be read from a local tileset. -
<URL>./</URL>+<DatasetName>mylayer</DatasetName>
When using theLocalRequester, the<URL>and<DatasetName>elements are used together to form the path to the tileset directory, with relative paths being relative to the LDF location. In the example above, the tiles will be retrieved from./tilesets/mylayer/0/...etc. where./is the directory in which the LDF resides. -
<DataCacheName>
Specifies the location in which cached tiles are stored. Note that this is not used for local tilesets, but as it will be required when the tileset is published it's a good idea to specify it now. -
<ImageFormat>image/jpg</ImageFormat>and<ImageFormat>image/jpg</ImageFormat>
Should match the image format of the tileset (e.g.image/jpgorimage/png). -
<NumLevels count="7" numEmpty="0" />
Should match the number of levels generated in the tileset. This value can be found in the tiling log in the tileset folder. -
<LevelZeroTileDelta>
This needs to match theLevel Zero Tile Size (LZTS)used when tiling. This value can be found in the tiling log. -
<Sector>
This should define the extents of the tileset. This value can be found in the tiling log.
The following are some things you should test for to confirm your layer is working. If you get stuck, try the Troubleshooting section below which has some solutions to common problems.
-
Your layer loads without error in the
Layerspanel
If it has failed to load there will be an error symbol next to it. Commonly this is because of badly-formed XML. -
Double clicking the layer in the
Layerspanel zooms to the layer
If your layer extents have been set correctly this action should zoom to your layer on the globe. If nothing happens when you double-click, check your layer extents. -
Your data appears where you think it should
Your layer extents are defined by the<Sector>element in the LDF. Where your data actually appears, however, is controlled by the tileset structure and the Level Zero Tile Size (LZTS), among other things. If the LDF is correctly configured your data should appear in the correct geographic location. -
There are no tiles missing as you zoom in/out of your data
You should be able to zoom in and out of your layer without any missing tiles appearing. -
The data looks pleasing to the eye at all layers
There are a number of settings you can tweak during tiling that can affect the final appearance of your layer within theViewertool.
Note: If you make changes to your LDF, right-click the layer in the Layers panel and select "Refresh Layer" to reload your LDF with the updated settings.
The following are some hints for common problems that are encountered when preparing layers.
-
LDF does not load when dragging into the
Layerspanel
This usually occurs because something is wrong with the syntax of the LDF document. Check the application console window for an error that might help you track down the problem.
Otherwise, try checking the following:- The XML is valid (e.g. all elements are closed correctly, no typos in the element names etc.)
- The
layerTypeattribute of the root<Layer>element is correct (for image layers) - The layer delegate definitions are correct (if using the delegates mechanism)
-
Data does not appear in the correct location
This can occur for a number of reasons. Check the following:- The
<LevelZeroTileDelta>has been correctly defined. This should match the "Level Zero Tile Size" setting used during the tiling process (and recorded in the tileset log). - The
<TileOrigin>matches that used in the tiling process, and is correct for the data's coordinate system. The origin for EPSG:4326 data should be (-180.0, -90.0). If your data uses a different origin, this should be reflected in the tiling process and the LDF.
- The
-
Double-clicking the layer in the
Layerspanel does not zoom to the layer
This is usually because the<Sector>defined in the LDF is incorrect. Ensure that:- The south-west (bottom-left) and north-east (top-right) corners aren't mixed up
- The lat/lon coordinates haven't been switched around
-
Layer appears grainy or noisy
If the tileset has been produced using JPEG tiles, the tiles will be compressed using JPEG compression. This is a lossy compression and can result in noise or grain appearing in the layer. The amount of compression can be controlled during the tiling process. Try increasing the JPEG quality value during tiling, or using PNG tiles (Note that this will incur a tradeoff between image quality and tileset size). See this wikipedia article for a good discussion on JPEG compression. -
Layer data appears blurry
By default, theTileruses bilinear filtering when tiling data. This produces a 'smoother' result when scaling the data that may be more pleasing to the eye, and this filtering is particularly effective for "complex" data such as satellite imagery etc. However, if your dataset uses classification colouring or similar, where each pixel's colour is meaningful, it might be more suitable to use the alternative nearest-neighbour filtering. This will result in 'sharper' looking tiles at higher levels. This can be achieved by disabling theUse bilinear ...options within theTiler.
- Add info on masking