Version 7.49.0 seems to be leaking memory #7982
Comments
|
I attempted to reproduce this on Node 16 with a simple express app, but couldn't get anywhere. This makes me think there is something else going on 🤔. https://github.com/AbhiPrasad/GH-7982-node-memory-leak Maybe there's some weird behavior with Node 16 and async local storage that we haven't run into before. @phil-tutti is it possible to generate and share a heapdump? You can reference https://nodejs.org/en/docs/guides/diagnostics/memory/using-heap-snapshot for some strategies on this. @timfish any ideas of what could be going on here? |
|
So far, I've only seen a memory leak in Node < v18 with the debugger attached but maybe that's not the only trigger.
Yeah, I'd be reluctant to blame Node.js right off the bat, but we have seen a few issues with async hooks. In the above linked issue it's mentioned that there have been improvements/fixes to v8 that underpins a lot of async hooks and these unfortunately can't get backported to older node versions. Maybe I would be interesting to see a heap snapshot to see what's actually getting leaked. |
|
I will see what I can do to get a heapdump. But it might be tricky, as we can only see it on our production environments, as testing environments don't have enough load on them. And deploying the version that consumes more memory on production is always a bit risky :) |
|
We are sadly not able to provide a heapdump from our side, my apologies. |
|
I have the same issue here. And the memory grows really fast.
I can trace lots of
|

|
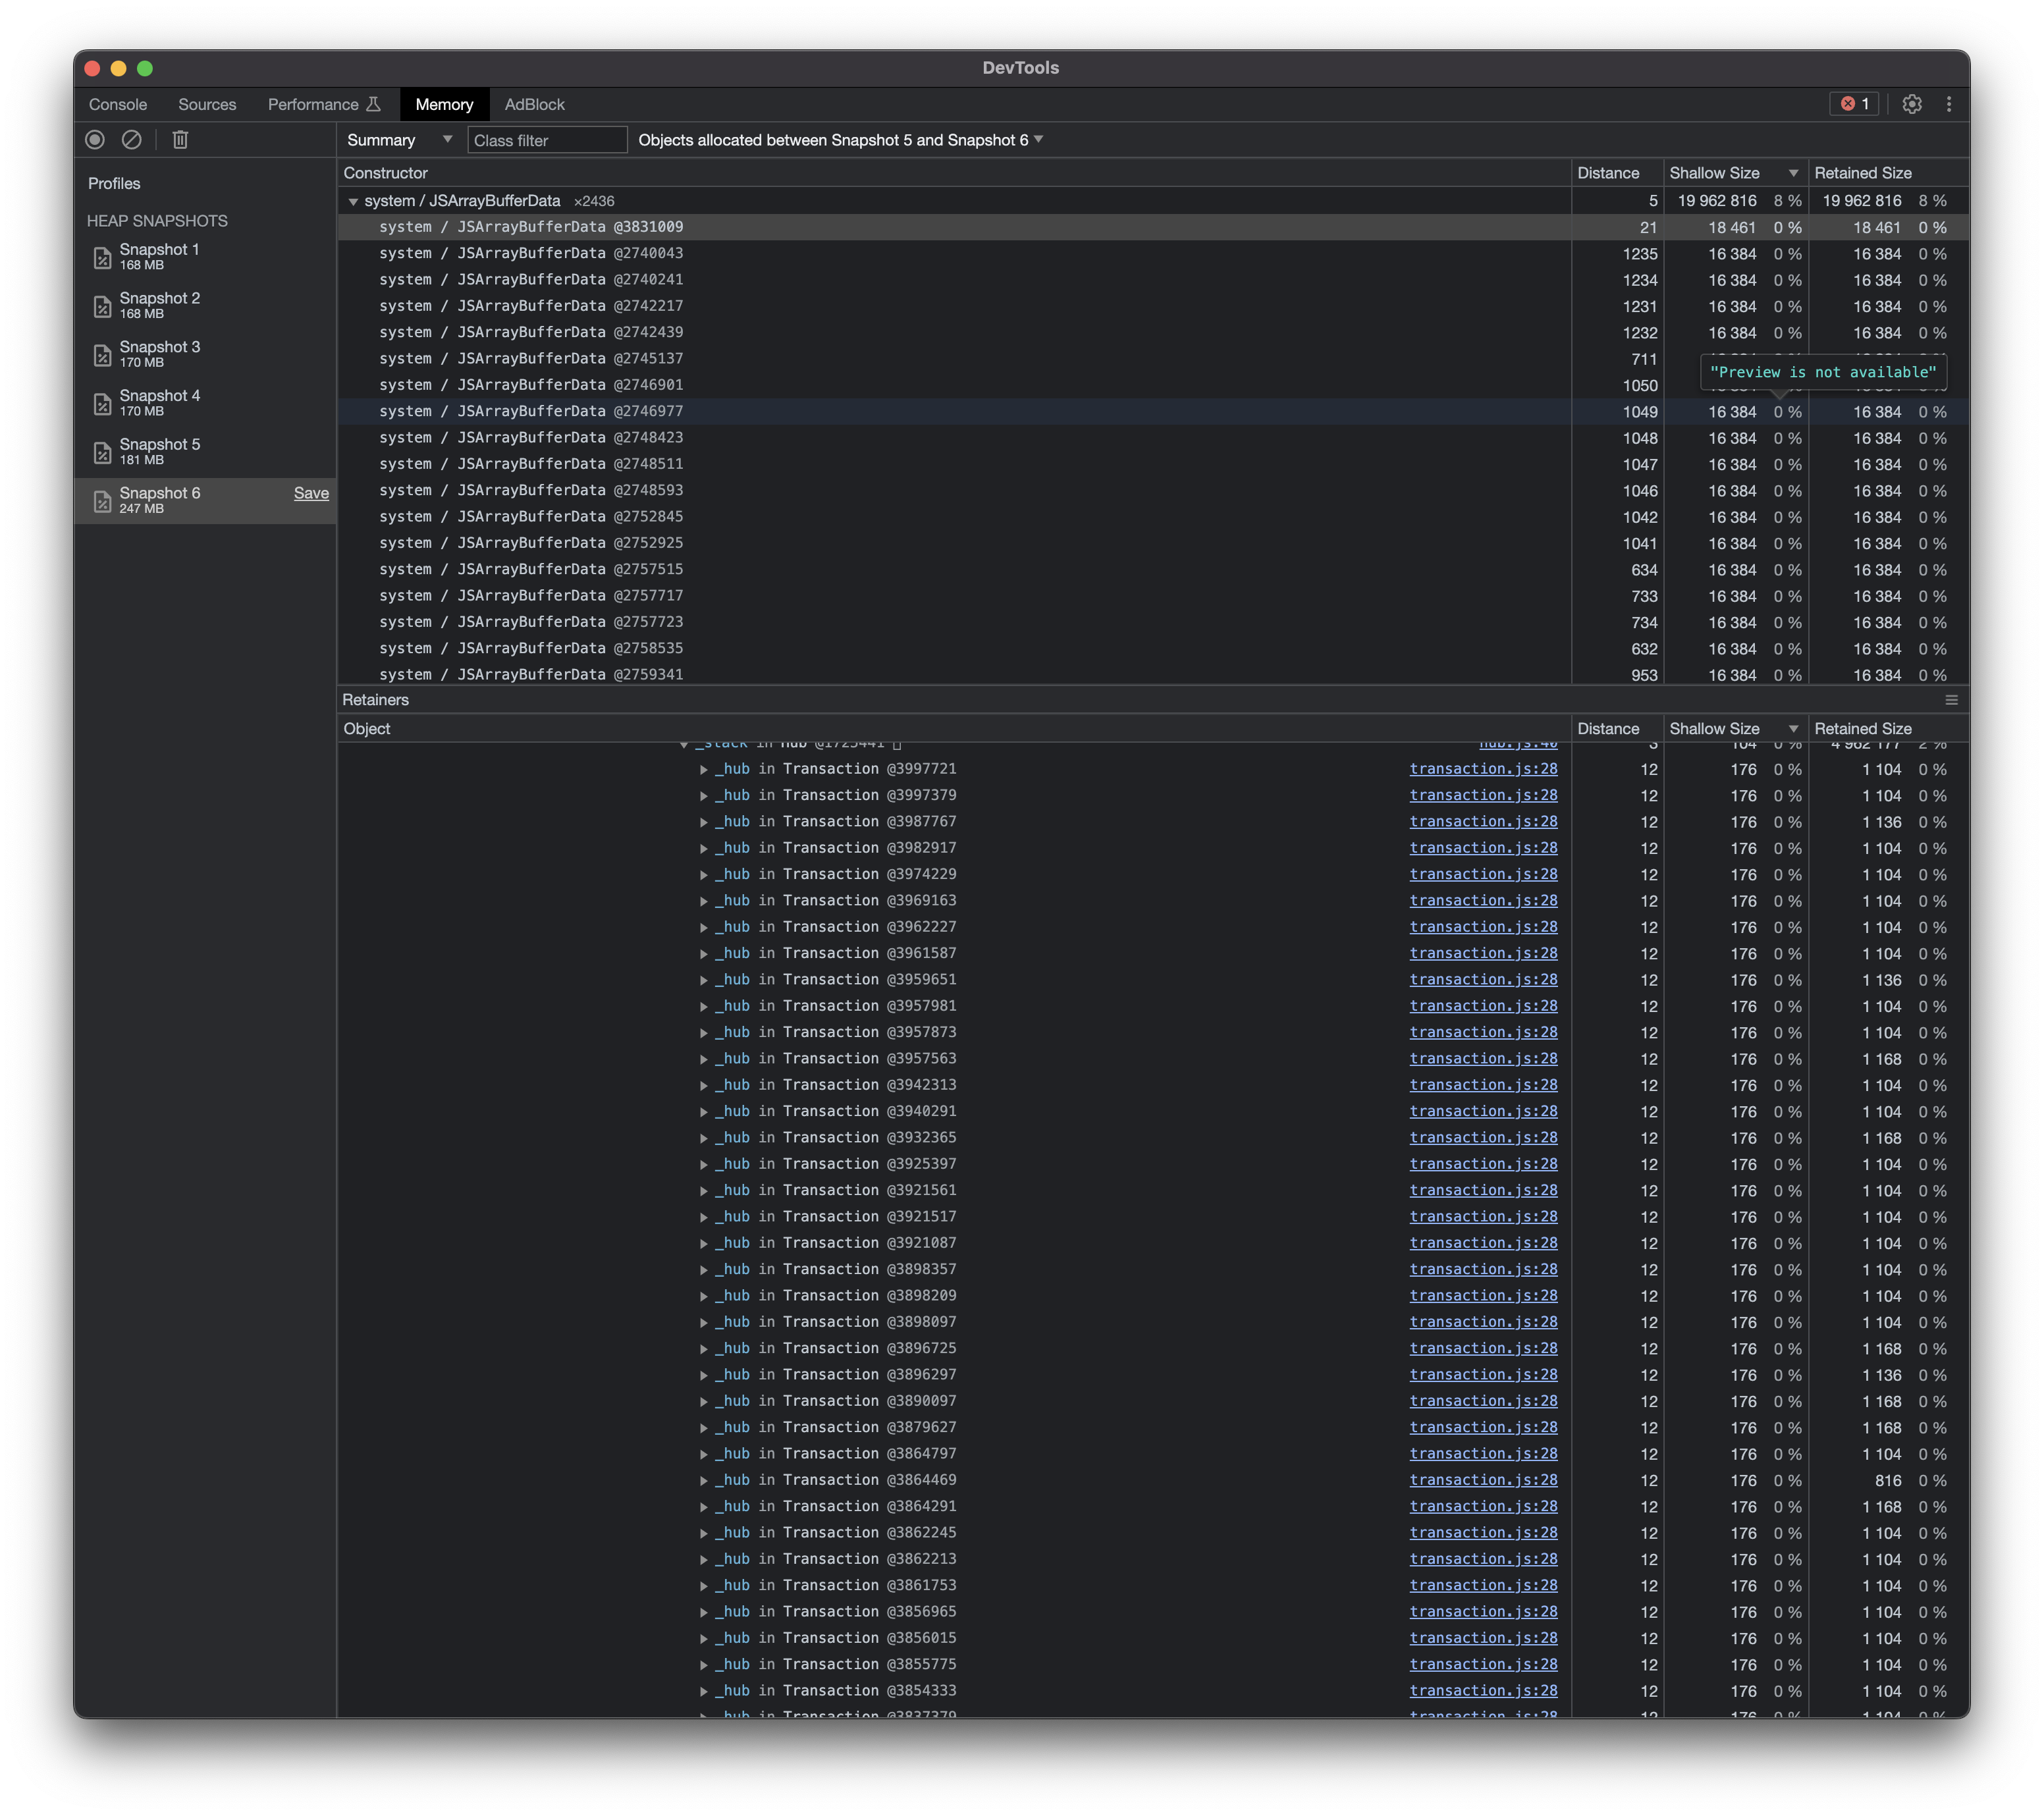
Thanks @Leask! I think the issue here is with holding the hub reference, so @timfish with:
Looks like you're on the money! We have a cirular ref that is hub -> scope -> transaction -> hub. I think we can try just deleting the hub reference on finish? I don't think there is any consquences from doing that. |
|
Something like: diff --git a/packages/core/src/tracing/transaction.ts b/packages/core/src/tracing/transaction.ts
index d62f4c3b2..c1fa4e465 100644
--- a/packages/core/src/tracing/transaction.ts
+++ b/packages/core/src/tracing/transaction.ts
@@ -206,7 +206,12 @@ export class Transaction extends SpanClass implements TransactionInterface {
__DEBUG_BUILD__ && logger.log(`[Tracing] Finishing ${this.op} transaction: ${this.name}.`);
- return this._hub.captureEvent(transaction);
+ const id = this._hub.captureEvent(transaction);
+
+ // @ts-ignore We need to remove hub from this transaction in order to prevent endless cycle
+ this._hub = undefined;
+
+ return id;
}
/** |
Nice find! With your proposed change, would it still leak if |
|
hmm yes it would, which is also unfortunate. This is tricky because we want it so that if you called |
|
Cool, thanks for the follow-up! 🍻 |
|
@Leask are you able to share more details of your setup that's causing the leaking or share your heap snapshots with me? I've tried a few basic examples and not managed to reproduce this locally yet. I do have a possible bug fix for this that removes the circular reference but my concern is that circular references alone should not be causing leaking. Modern browsers should be able to garbage collect basic circular references like this which suggest the cause is more likely an actual reference to something which is stopping collection. |
|
This issue has gone three weeks without activity. In another week, I will close it. But! If you comment or otherwise update it, I will reset the clock, and if you label it "A weed is but an unloved flower." ― Ella Wheeler Wilcox 🥀 |
|
Sorry about this, my wife delivered a new baby girl. I am so busy these days. |
|
I tried to reproduce this myself on the latest version once again, and was unable to. Closing this issue as a result, but if anyone can get a reproduction, we can re-open and investigate! Thanks! |
|
Yes, weeks ago, I upgraded to the latest version and cannot reproduce this issue anymore. |
|
I want to give an update here in case someone else runs into the same issue. We migrated our react app from a custom made solution to next.js and tried to update sentry again. This had the same effect, with the memory slowly growing and eventually running OOM. So we decided to stick to the older version. Just recently though, we switched from node TL;DR: it seems an update to node version |
Is there an existing issue for this?
How do you use Sentry?
Sentry Saas (sentry.io)
Which SDK are you using?
@sentry/node
SDK Version
7.49.0
Framework Version
@sentry/integrations": "7.49.0, @sentry/node": "7.49.0, @sentry/react": "7.49.0
Link to Sentry event
No response
SDK Setup
and
to catch errors
Steps to Reproduce
As written in this PR: #7752 (comment), we started to see a constant increase of memory , that is not getting cleaned up when we switched from 7.46.0 to 7.49.0. Once we reverted this version, everything went back to normal.
For SSR, we're setting up the
sentry/nodetogether withsentry/integrationpackage.sentry/browseris not being used on server side.Here's also an excerpt from our package.json.
We're using
express, withnode: 16running on our servers. We render our react application server-side, together with MUI and emotionExpected Result
A graph like this for our memory usage over time
Actual Result
The text was updated successfully, but these errors were encountered: