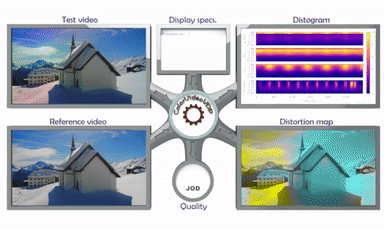
ColorVideoVDP is a full-reference visual quality metric that predicts the perceptual difference between pairs of images or videos. Similar to popular metrics like PSNR, SSIM, and DeltaE 2000 it is aimed at comparing a ground truth reference against a distorted (e.g. blurry, noisy, color-shifted) version.
This metric is unique because it is the first color-aware metric that accounts for spatial and temporal aspects of vision.
The main features:
- models chromatic and achromatic contrast sensitivity using a novel contrast sensitivity model (castleCSF), allowing us to predict distortions in color and luminance;
- models spatio-temporal sensitivity so that it can predict visibility of artifacts like waveguide nonuniformity and other temporally varying artifacts;
- works with colorimetrically calibrated content, both SDR and HDR (any colour space);
- can predict a single number quality correlate, a distortion map or a visualization of an error over time and visual channels (distogram).
ColorVideoVDP is implemented in PyTorch and can be run efficiently on a CUDA-enabled GPU. It can also run on a CPU, but the processing times will be much longer, especially for video. Its usage is described below.
The metric is explained in details in:
ColorVideoVDP: A visual difference predictor for image, video and display distortions.
Rafal K. Mantiuk, Param Hanji, Maliha Ashraf, Yuta Asano, Alexandre Chapiro.
In SIGGRAPH 2024 Technical Papers, Article 129
https://doi.org/10.1145/3658144
If you use the metric in your research, please cite the paper above.
- Start by installing anaconda or miniconda. Then, create a new environment for ColorVideoVDP and activate it:
conda create -n cvvdp python=3.10
conda activate cvvdp-
Install PyTorch by following these instructions (OS-specific). If you have an Nvidia GPU with appropriate drivers, it is recommended to install with conda for proper CUDA support. To use MPS on a Mac, please install torch>=2.1.0.
-
Install ffmpeg. The easiest option is to install using conda,
conda install ffmpeg- Obtain the ColourVDP codebase, by extracting a
.zipfile provided or cloning from Github:
git clone git@github.com:gfxdisp/ColorVideoVDP.git # skip if a .zip is provided or you use Github GUI- Finally, install ColorVideoVDP with PyPI:
cd ColorVideoVDP
pip install -e .
Note: The "-e/--editable" option to pip is optional and should be used only if you intend to change the ColorVideoVDP code.
After installation, run cvvdp directly from the command line:
cvvdp --test test_file --ref ref_file --display standard_fhdThe test and reference files can be images or videos. The option --display specifies a display on which the content is viewed. See vvdp_data/display_models.json for the available displays.
See Command line interface for further details. ColorVideoVDP can be also run directly from Python - see Low-level Python interface.
Table of contents
- Display specification
- HDR content
- Reporting metric results
- Predicting quality scores
- Usage
- Release notes
Unlike most image quality metrics, ColorVideoVDP needs physical specification of the display (e.g. its size, resolution, peak brightness) and viewing conditions (viewing distance, ambient light) to compute accurate predictions. The specifications of the displays are stored in vvdp_data/display_models.json. You can add the exact specification of your display to this file, or create a new JSON file and pass the directory it is located in as --config-paths parameter (see Configuration files). If the display specification is unknown to you, you are encouraged to use one of the standard display specifications listed on the top of that file, for example standard_4k, or standard_fhd. If you use one of the standard displays, there is a better chance that your results will be comparable with other studies.
You specify the display by passing --display argument to cvvdp. Run with --display ? to get a list of available display models.
Note the the specification in display_models.json is for the display and not the image. If you select to use standard_4k with the resolution of 3840x2160 for your display and pass a 1920x1080 image, the metric will assume that the image occupies one quarter of that display (the central portion). If you want to enlarge the image to the full resolution of the display, pass --full-screen-resize {fast_bilinear,bilinear,bicubic,lanczos} option (for now it works with video only).
The command line version of ColorVideoVDP can take as input HDR video streams encoded using the PQ transfer function. To correctly model HDR content, it is necessary to pass a display model with correct color space and transfer function (with the field colorspace="BT.2020-PQ"), for example standard_hdr_pq.
If you run the metric from the command line, we recommend that you create a directory with a copy of display_models.json, add a new display specification in that file and then add to the command line --config-paths <path-to-dir-with-json-file> --display <name-of-display-spec>. The format of display_models.json is explained here.
If you run the metric from Python code, the display photometry and geometry can be specified by passing display_name parameter to the metric. Alternatively, if you need more flexibility in specifying display geometry (size, viewing distance) and its colorimetry, you can instead pass objects of the classes vvdp_display_geometry, vvdp_display_photo_gog for most SDR displays, and vvdp_display_photo_absolute for HDR displays. You can also create your own subclasses of those classes for custom display specification.
(Python command line only) You can use the metric to compare:
-
HDR video files encoded using PQ EOTF function (SMPTE ST 2084). Pass the video files as
--testand--refarguments and specify--display standard_hdr_pq. -
OpenEXR images. The images MUST contain absolute linear colour values (colour graded values, emitted from the display). That is, if the disply peak luminance is 1000, RGB=(1000,1000,1000) corresponds to the maximum value emitted from the display. If you pass images with the maximum value of 1, the metric will assume that the images are very dark (the peak of 1 nit) and result in incorerect predictrions. You need to specify
--display standard_hdr_linearto use correct EOTF. Note that the default installation skips the PyEXR package, which is required to read.exrfiles. To install, run:
conda install -c conda-forge openexr-python   # or "sudo apt install openxr" on Linux machines
pip install pyexr
Troubleshooting on Linux: You may need to update your library path by adding the following line to your ~/.bashrc:
export LD_LIBRARY_PATH=$LD_LIBRARY_PATH:/path/to/conda/miniconda3/libWhen reporting the results of the metric, please include the string returned by the metric, such as:
"ColorVideoVDP v0.4.1, 75.4 [pix/deg], Lpeak=200, Lblack=0.5979 [cd/m^2], (standard_4k)"
This is to ensure that you provide enough details to reproduce your results.
ColorVideoVDP reports image/video quality in the JOD (Just-Objectionable-Difference) units. The highest quality (no difference) is reported as 10 and lower values are reported for distorted content. In case of very strong distortion, or when comparing two unrelated images, the quality value can drop below 0.
The main advantage of JODs is that they (a) should be linearly related to the perceived magnitude of the distortion and (b) the difference of JODs can be interpreted as the preference prediction across the population. For example, if method A produces a video with the quality score of 8 JOD and method B gives the quality score of 9 JOD, it means that 75% of the population will choose method B over A. The plots below show the mapping from the difference between two conditions in JOD units to the probability of selecting the condition with the higher JOD score (black numbers on the left) and the percentage increase in preference (blue numbers on the right).
| Fine JOD scale | Coarse JOD scale |
 |
 |
The main script to run the model on a set of images or videos is run_cvvdp.py, from which the binary cvvdp is created. Run cvvdp --help for detailed usage information.
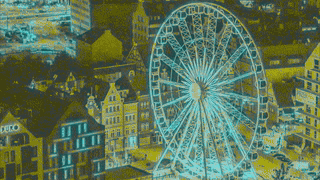
For the first example, we will compare the performance of ColorVideoVDP to the popular Delta E 2000 color metric. A video was degraded with 3 different color artifacts using ffmpeg:
- Gaussian noise:
ffmpeg ... -vf noise=alls=28.55:allf=t+u ... - Increased saturation:
ffmpeg ... -vf eq=saturation=2.418 ... - Colorbalance:
ffmpeg ... -vf colorbalance=rm=0.3:gm=0.3:bm=0.3:rs=0.15:gs=0.2:bs=0.2
The magnitude of each degradation was adjusted so that the predicted maximum Delta E 2000 = 33.5. As Delta E 2000 is not sensitive to spatial or temporal components of the content, it is unable to distinguish between these cases.
To predict quality with ColorVideoVDP (shown below), run:
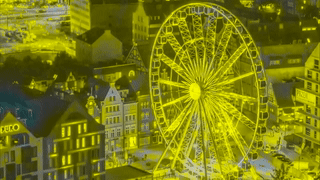
cvvdp --test example_media/structure/ferris-test-*.mp4 --ref example_media/structure/ferris-ref.mp4 --display standard_fhd --heatmap supra-threshold --distogram| Original | 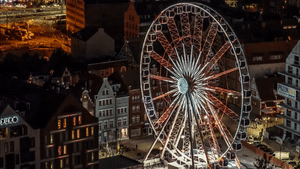 |
Quality | Heatmaps |
|---|---|---|---|
| Gaussian noise | 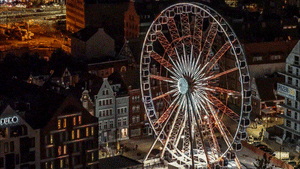 |
DE00 = 33.5 CVVDP = 8.87 |
 |
| Saturation | 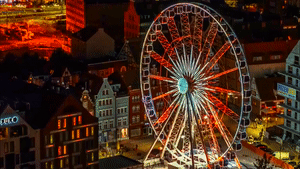 |
DE00 = 33.5 CVVDP = 6.55 |
 |
| Colorbalance | 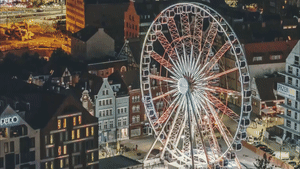 |
DE00 = 33.5 CVVDP = 5.59 |
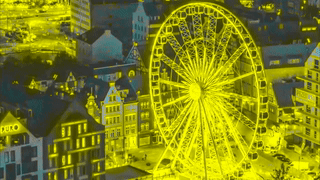 |
In addition to the single-valued quality scored in the JOD units, ColorVideoVDP can generate a heatmap (video or image) and a distogram. The heatmap is generated when --heatmap command argument is passed with one of the following options:
supra-threshold- the difference values between 0 and 3 will be mapped to blue to yellow colors (visualizes large differences)threshold- the difference values between 0 and 1 will be mapped to green to red colors (visualizes small differences)raw- the difference values between 0 and 10 will be mapped to back to white
The --distogram command line argument can be followed by a floating point value. If present, it will be used as the maximum JOD degradation to use in the visualization. The default is 10.
Both distogram and heatmap will be saved in the current directory and the filename will contain the name of the test image/video. To change the directory in which those files are saved, pass --output-dir option.
Configuration files contain a list of available display models (display_models.json), colour spaces (color_spaces.json) and the parameters of the metric (cvvdp_parameters.json). Those are located by default in pycvvdp/vvdp_data folder. Different locations could be specified with the --config-paths argument or the CVVDP_PATH environment variable.
If you want to use a different colour space or display model, make a copy of the corresponding file in another directory, add your custom entry, and then pass the path to either the directory or the file as the --config-paths argument.
You can also use a different metric calibration file by passing a path to another cvvdp_parameters.json file.
The modified configuration files must start with the same name as the original file (excluding the file name extension). For example, you can create a new metric parameter file cvvdp_parameters_new.json, but new_cvvdp_parameters.json will not be recognized.
When looking for the configuration files, the paths specified in the --config-paths will be checked first, followed by the directory pointed by the environment variable CVVDP_PATH, followed by the default directory pycvvdp/vvdp_data.
To check which display_models.json file is used, run cvvdp with --display ?.
To check which cvvdp_parameters.json file is used, run cvvdp with --verbose.
A command-line argument --metric can be used to specify one more more metric to run. The available options are:
cvvdp- ColorVideoVDPpu-psnr-rgb- PSNR calculated on PU21-encoded RGB values (see PU21 for more info on PU21 encoding).pu-psnr-y- PSNR calculated on PU21-encoded luminance valuesdm-previewordm-preview-exr- a fake metric that outputs either HDR h.265 (.mp4) video (dm-preview) or OpenEXR frames (dm-preview-exr) with the output of the display model. It can be used to check or debug the display model. Use--output-dirto specify the directory in which the files should be written.
To preview the images/video that are sent to the metric (after applying a display model), pass --metric dm-preview. It will write OpenEXR images or HDR videos (<base-name>-test.[exr|mp4], <base-name>-reference.[exr|mp4]) with the output of the display model. Those will be stored in the current directory or one specified with --output-dir. The files will contain absolute colour values, for example, RGB=[100 100 100] means D65 white at 100 nit luminance.
This functionality is useful if you suspect that video/images are incorrectly loaded or the display model is incorrectly used. You can use a scientific image viewer, such as pfsview from pfstools, to preview the frames.
You can also alternative versions of this debug "metric":
--metric dm-preview-exr- when processing video, OpenEXR frames will be written instead of a video file.--metric dm-preview-sbs- instead of creating two separate files, one for reference and one for test, put those in the same frame side-by-side.--metric dm-preview-exr- the two above combined
ColorVideoVDP can also be run through the Python interface by instatiating the pycvvdp.cvvdp class.
import pycvvdp

I_ref = pycvvdp.load_image_as_array(...)
I_test = pycvvdp.load_image_as_array(...)

cvvdp = pycvvdp.cvvdp(display_name='standard_4k', heatmap='threshold')
JOD, m_stats = cvvdp.predict( I_test, I_ref, dim_order="HWC" )
Below, we show an example comparing ColorVideoVDP to the popular SSIM metric. While SSIM is aware of the structure of the content, it operates on luminance only, and is unable to accurately represent the degradation of a color-based artifact like chroma subsampling.

More examples can be found in these example scripts.
ColorVideoVDP can be used as a differentiable loss function in PyTorch. Use cvvdp.loss function for that. Examples of how to use ColorVideoVDP as a loss can be found in examples/ex_adaptive_chroma_subsampling.py and examples/ex_image_reconstruction.py.
A few caveats: * Similarly as many perceptual losses, ColorVideoVDP may disrupt the convexity of the loss landscape making the convergence slower or impossible. * Because of that, it is advisable that ColorVideoVDP is used in combination with well-behaved losses, such as L1 or L2. * Alternatively, ColorVideoVDP can be used at the latter training stage after the L1 or L2 solution has almost converged. * The optimization will work much better on lower-dimensional problems in which only a few parameters are optimized.
There is no native implementation of ColorVideoVDP in Matlab, but you can use a wrapper that can be found in the matlab directory.
-
v0.4.1 (27/April/2024)
- Added
lossfunction to cvvdp and examples showing how to use it inexamples/ex_adaptive_chroma_subsampling.pyandex_image_reconstruction.py. - Added
--metric dm-previewfor previewing or debugging of the display model
- Added
-
v0.4.0 (19/January/2024)
- An improved masking model and supra-threshold contrast coding
- A new calibration with a small improvement in performance
- Matlab wrapper
-
v0.3.0 (04/Sep/2023) - First public release
-
v0.1.0 - Initial internal release.
The detailed list of changes can be found in ChangeLog.md.