containers using MADV_FREE do not see their memory usage decrease #2242
Comments
|
Related change for Golang: golang/go#23687 but did not have a chance to dive into what this option does / what's expected. The effect is quite scary though. |
|
prometheus/prometheus#5524 seems like Go 1.12.5 has this fixed |
|
I don't think cAdvisor can do anything here. cAdvisor just reports the value from cgroup files. This is either a golang issue, as suggested by @bwplotka above, or a kernel issue. |
|
cc @sylr |
|
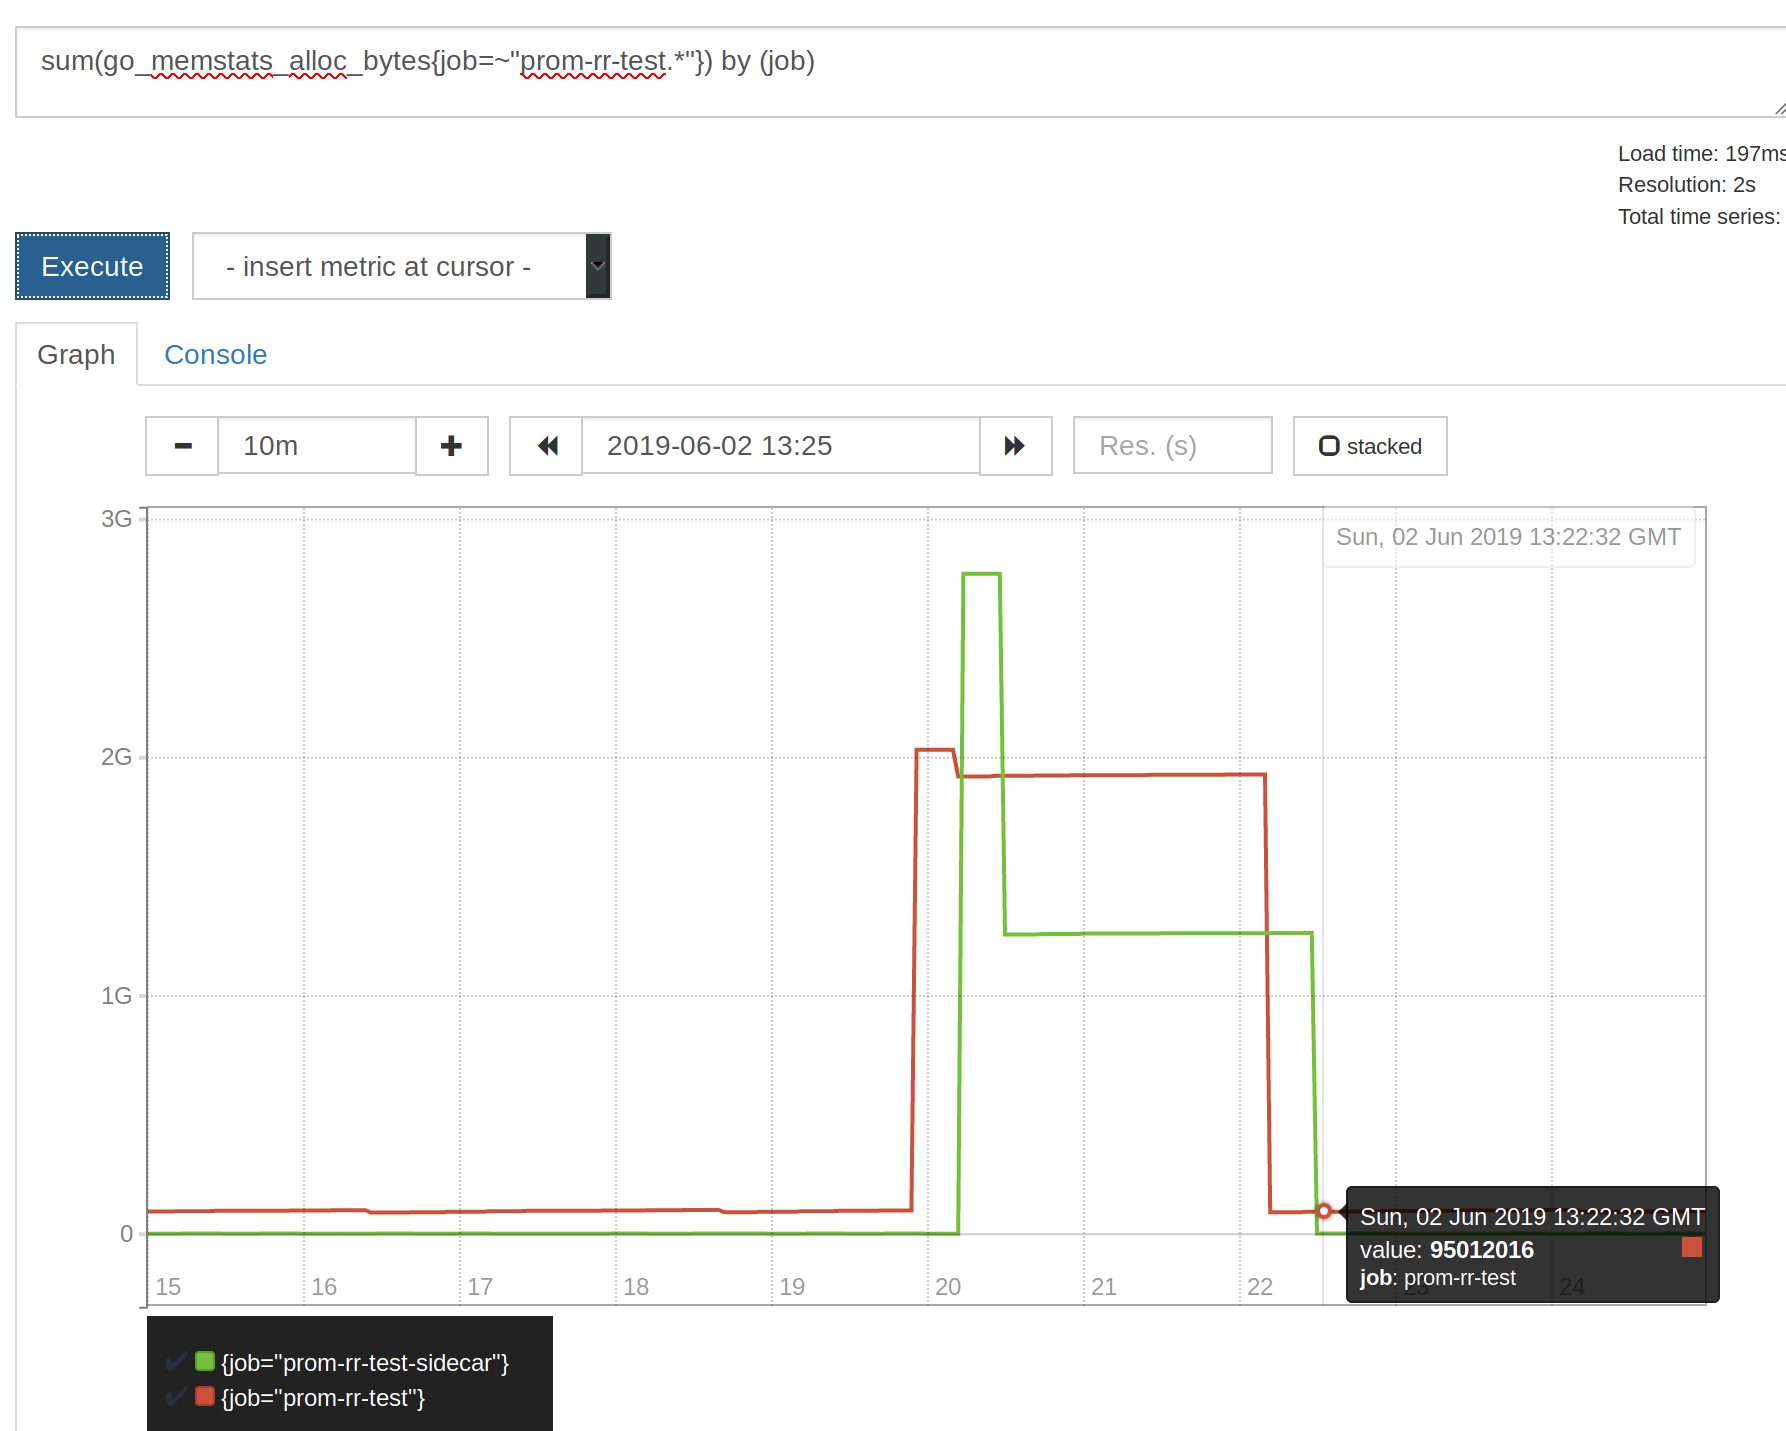
After couple of tests I am no longer sure if we can rely on Actual allocated memory on the heap of 2 Golang processes in each container:
For fun (because this is misleading, but works as expected) Wonder if my signals are weird (heap being larger than WSS) due to some different scrape internal etc so some spike being missed. cc @sylr @gouthamve |


|
@bwplotka I wouldn't trust go_memstats_... as I find it particularly hard to understand what they really represent (see: golang/go#32284). |
|
Wrote a post about this in details here: https://bwplotka.dev/2019/golang-memory-monitoring/ |
I've a bunch of containers running Thanos (a golang app which proxy prometheus queries).
The latest version of Thanos has been compiled with go 1.12 which use
MADV_FREEto release memory back to the system instead ofMADV_DONTNEEDin go 1.11.Unfortunately it seems that cadvisor does not see the memory being released with
MADV_FREE.Here a graph showing
container_memory_usage_bytesafter switching back toMADV_DONTNEEDinstead ofMADV_FREEusingGODEBUG=madvdontneed=1.I don't know if cadvisor can do something about it though.
The text was updated successfully, but these errors were encountered: