Skip to content
New issue

Have a question about this project? Sign up for a free GitHub account to open an issue and contact its maintainers and the community.

By clicking “Sign up for GitHub”, you agree to our terms of service and privacy statement. We’ll occasionally send you account related emails.

Already on GitHub? Sign in to your account

Grafana table via Kusto not getting populated properly #437

Closed
shakerkms opened this issue Jul 26, 2022 · 6 comments
Closed

Grafana table via Kusto not getting populated properly #437

shakerkms opened this issue Jul 26, 2022 · 6 comments
Labels

Comments

@shakerkms
Copy link

I’ve built a Grafana dashboard that is querying against 1ES kusto db & shows the results in a table format. I'm seeing that the table sometimes don't get populated properly (see screenshot below – OneSS Active PRs) . However, if I reload the page couple of times, it will populate properly. Unfortunately, the issue will pop up in another
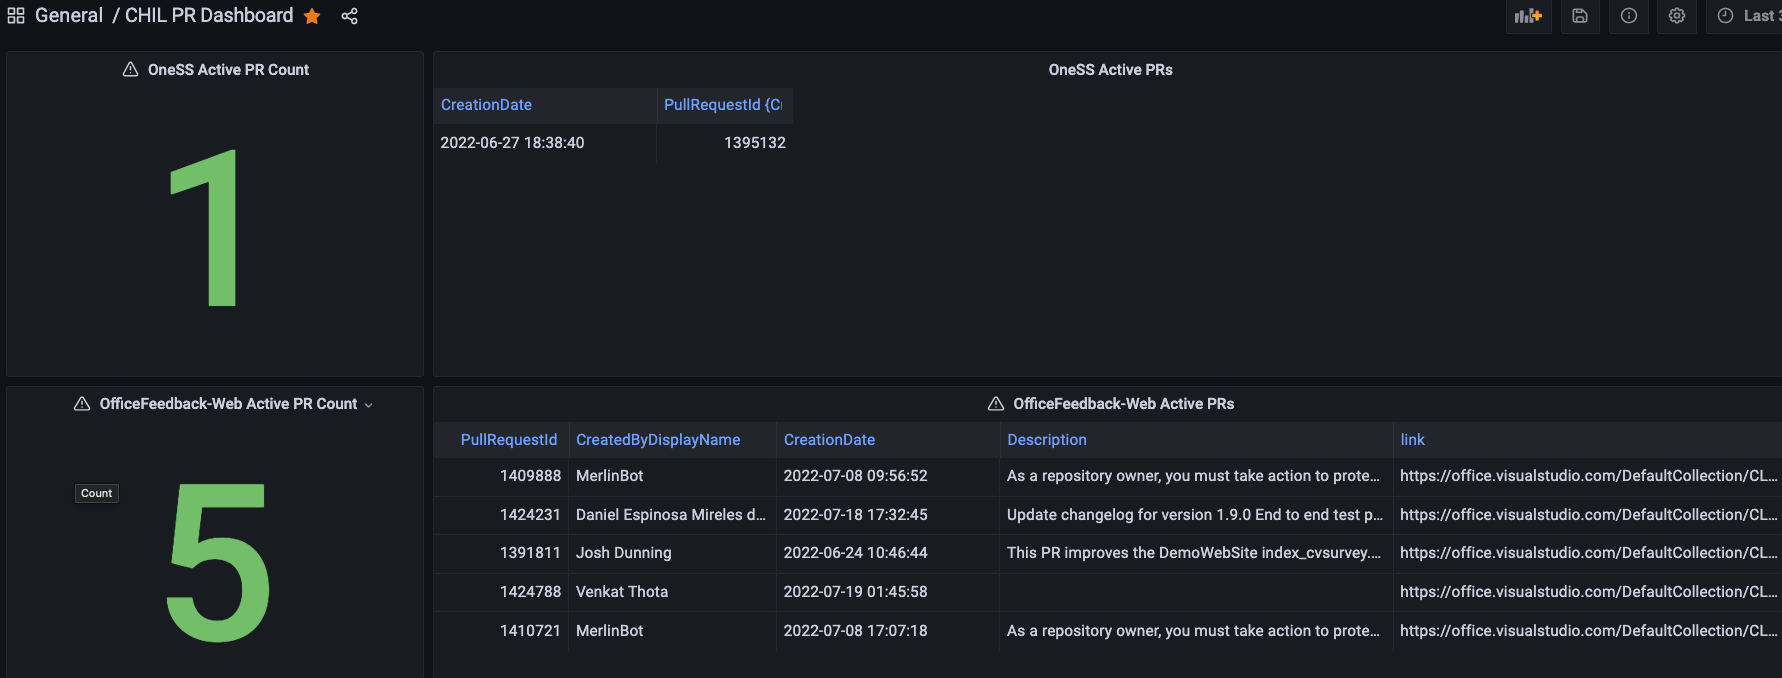
table 🙁 I've ran the queries directly in kusto and it works fine (& fast).
image003

@andresmgot
Copy link
Contributor

Hi @shakerkms,

We will need more information to address what could be happening:

  • Is it only a visualization issue? Meaning, if you click on the query editor and in the "Query Inspector", are you able to see the data there but not in the table.
  • What query are you trying to execute? So we can try to reproduce it. Does the query return a large amount of data?
  • Does it always behave the same? Is always the same information missing?

@shakerkms
Copy link
Author

shakerkms commented Jul 29, 2022

Hi @andresmgot - thanks for looking into it.

  1. It is not just a visualization issue. If I toggle "table view" in query inspector, I see the same issue
  2. Query doesn't return a large number of data and it runs fine in kusto directly
  3. It seems like it. All the panels are supposed to show the data in the same table format - PullRequestId, CreatedByDisplayName, CreationDate etc. and they only show CreationDate properly

@andresmgot
Copy link
Contributor

This may be related to #436 and the plugin overloading the UI.

  • In the query editor, have you set the "Format as" field as "Table"? Also, does it help if you reduce the size of the query to, let's say 100 records?

Screenshot from 2022-08-01 16-41-50

  • If the above does not help, can you let us know what query you are running to try to reproduce it?

@shakerkms
Copy link
Author

Setting format as table seems to fixed the issue. Thanks for investigating.

@Grrrolf
Copy link

Grrrolf commented Aug 5, 2022

Hello @shakerkms ,

image

Whenever you see such an exclamation mark/triangle Grafana is trying to tell you something. Hover over the triangle with your mouse pointer to see what it is telling you. Usually it's about wrong formatting.

Based on @andresmgot you were already able to fix this issue 👍

@andresmgot
Copy link
Contributor

Thanks for confirming! Let me close this issue then.

Sign up for free to join this conversation on GitHub. Already have an account? Sign in to comment
Labels
Projects
Archived in project
Development

No branches or pull requests

4 participants