UI bug when query returns nothing for creating new Alert (Unified Alerting 9.2.3) #281
Comments
|
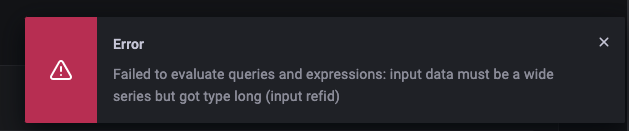
Hello, I believe you can only return numeric values. Try removing |
|
@AlexeiZenin did removing |
I didn't try this but for my requirements I need to keep serviceName to have the query use that as the label value for the alert so I can easily query for alerts for certain services. According to the docs it should still work correct? https://grafana.com/grafana/plugins/grafana-clickhouse-datasource/ |
|
My workaround was to do some ugly unions on a default row (WITH clause) when no errors were there where I would create a time series with 1 row with value 0 |
|
This seems related to #207 I am looking into this more. Thank you for the update @AlexeiZenin |
|
We are still aware of this issue. I'll have time to look into this next week. I'll have an update then 🙂 |
|
@AlexeiZenin this issue is fixed as of Grafana v9.5.1 😄 |
Describe the bug
Get an error page in the Grafana UI when trying to create an alert on a time series which returns no results from clickhouse.
Versions
Grafana 9.3.2 and Plugin version 2.0.3
Query
Errors in the last X minutes
To Reproduce
Create a time series which returns no data in the alert panel, and click Run Query a few times until you get the error page. See screenshots
Expected behavior
Should not error out as time series should not always be expected to return a value and return some default set of values we can use with Alerting. When the time series has data (their are errors within whatever time period, it doesn't error out)
Screenshots

After clicking on Run Query the 1st time:
After clicking on Run Query the 2nd time:
The text was updated successfully, but these errors were encountered: