Skip to content
New issue

Have a question about this project? Sign up for a free GitHub account to open an issue and contact its maintainers and the community.

By clicking “Sign up for GitHub”, you agree to our terms of service and privacy statement. We’ll occasionally send you account related emails.

Already on GitHub? Sign in to your account

Browser uncaught exception | error=Error: RangeError: Invalid array length #395

Closed
mr-manuel opened this issue Jan 10, 2023 · 6 comments
Closed

Comments

@mr-manuel
Copy link

What happened:
After Grafana 9.2.4 and Grafana Image Renderer 3.6.2 the images for notifications stopped rendering in a Docker environment.

What you expected to happen:
That the images get rendered

How to reproduce it (as minimally and precisely as possible):

  1. Setup docker compose
version: '3.9'
services:
  grafana:
    container_name: grafana
    restart: unless-stopped
    image: grafana/grafana:latest
    ports:
      - '3000:3000'
    environment:
      - 'GF_SERVER_DOMAIN=grafana.docker.local'
      - 'GF_SERVER_ROOT_URL=%(protocol)s://%(domain)s/'
      # for image rendering
      - 'GF_UNIFIED_ALERTING_SCREENSHOTS_CAPTURE=true'
      - 'GF_RENDERING_SERVER_URL=http://grafana-renderer:8081/render'
      - 'GF_RENDERING_CALLBACK_URL=http://grafana:3000/'
      - 'GF_LOG_FILTERS=rendering:debug'
    depends_on:
      - 'grafana-renderer'
  grafana-renderer:
    container_name: grafana-renderer
    restart: unless-stopped
    image: grafana/grafana-image-renderer:latest
    ports:
      - 8081:8081
    environment:
      - 'ENABLE_METRICS=false'
      - 'LOG_LEVEL=debug'
  1. Setup a dashboard with a time series panel
  2. Create an alert for this panel
  3. When the alert triggers no notification is send in the worst case. In the best case a notification is send with a screenshot of the dashboard without graph
    grafik

Anything else we need to know?:

# test 1 --> working
## grafana 9.2.4

logger=settings t=2023-01-10T07:47:33.659223984Z level=info msg="Config overridden from Environment variable" var="GF_LOG_FILTERS=rendering:debug"
logger=settings t=2023-01-10T07:47:33.659231251Z level=info msg="Config overridden from Environment variable" var="GF_RENDERING_SERVER_URL=http://grafana-renderer:8081/render"
logger=settings t=2023-01-10T07:47:33.659234607Z level=info msg="Config overridden from Environment variable" var="GF_RENDERING_CALLBACK_URL=http://grafana:3000/"
logger=rendering renderer=http t=2023-01-10T07:47:33.843210392Z level=debug msg="calling remote rendering service" url=http://grafana-renderer:8081/render/version
logger=rendering renderer=http t=2023-01-10T07:47:33.848961171Z level=info msg="Backend rendering via external http server" version=3.6.1
logger=rendering renderer=http t=2023-01-10T07:51:10.004617593Z level=info msg=Rendering path="d-solo/Ff6LG-e3r/enphase?orgId=1&panelId=3"
logger=rendering renderer=http t=2023-01-10T07:51:10.005379411Z level=debug msg="calling remote rendering service" url="http://grafana-renderer:8081/render?deviceScaleFactor=1.000000&domain=grafana&encoding=&height=500&renderKey=JDA8j9x1jZ9y4iJuVb03peI1f3qqSndS&timeout=10&timezone=&url=http%3A%2F%2Fgrafana%3A3000%2Fd-solo%2FFf6LG-e3r%2Fenphase%3ForgId%3D1%26panelId%3D3%26render%3D1&width=1000"

## grafana-renderer 3.6.1

DBG Browser initialized | config={"acceptLanguage":null,"args":["--no-sandbox","--disable-gpu"],"chromeBin":"/usr/bin/chromium-browser","clustering":{"maxConcurrency":5,"mode":"browser","monitor":false,"timeout":30},"deviceScaleFactor":1,"dumpio":false,"emulateNetworkConditions":false,"headed":false,"height":500,"ignoresHttpsErrors":false,"maxDeviceScaleFactor":4,"maxHeight":3000,"maxWidth":3080,"mode":"default","timingMetrics":false,"verboseLogging":false,"width":1000}
INF HTTP Server started, listening at http://localhost:8081 

DBG ::ffff:172.18.0.6 - - [10/Jan/2023:07:47:33 +0000] "GET /render/version HTTP/1.1" 200 19 "-" "Grafana/9.2.4"

DBG Render request received | url=http://grafana:3000/d-solo/Ff6LG-e3r/enphase?orgId=1&panelId=3&render=1
DBG Deleting temporary file | file=/tmp/20c3c685.png
DBG ::ffff:172.18.0.6 - - [10/Jan/2023:07:51:12 +0000] "GET /render?deviceScaleFactor=1.000000&domain=grafana&encoding=&height=500&renderKey=JDA8j9x1jZ9y4iJuVb03peI1f3qqSndS&timeout=10&timezone=&url=http%3A%2F%2Fgrafana%3A3000%2Fd-solo%2FFf6LG-e3r%2Fenphase%3ForgId%3D1%26panelId%3D3%26render%3D1&width=1000 HTTP/1.1" 200 40132 "-" "Grafana/9.2.4"
DBG Connection closed | url=http://grafana:3000/d-solo/Ff6LG-e3r/enphase?orgId=1&panelId=3&render=1


# test 2 --> error
## grafana 9.2.4
logger=settings t=2023-01-10T07:58:16.281862829Z level=info msg="Config overridden from Environment variable" var="GF_LOG_FILTERS=rendering:debug"
logger=settings t=2023-01-10T07:58:16.281867939Z level=info msg="Config overridden from Environment variable" var="GF_RENDERING_SERVER_URL=http://grafana-renderer:8081/render"
logger=settings t=2023-01-10T07:58:16.281929369Z level=info msg="Config overridden from Environment variable" var="GF_RENDERING_CALLBACK_URL=http://grafana:3000/"
logger=rendering renderer=http t=2023-01-10T07:58:16.515488186Z level=debug msg="calling remote rendering service" url=http://grafana-renderer:8081/render/version
logger=rendering renderer=http t=2023-01-10T07:58:16.524673813Z level=error msg="Failed to send request to remote rendering service" error="Get \"http://grafana-renderer:8081/render/version\": dial tcp 172.18.0.3:8081: connect: connection refused"
logger=rendering renderer=http t=2023-01-10T07:58:16.524698622Z level=info msg="Couldn't get remote renderer version, retrying" err="failed to send request to remote rendering service: Get \"http://grafana-renderer:8081/render/version\": dial tcp 172.18.0.3:8081: connect: connection refused" try=0
logger=rendering renderer=http t=2023-01-10T07:58:31.52507701Z level=debug msg="calling remote rendering service" url=http://grafana-renderer:8081/render/version
logger=rendering renderer=http t=2023-01-10T07:58:31.539288497Z level=info msg="Backend rendering via external http server" version=3.6.2
logger=rendering renderer=http t=2023-01-10T07:59:40.006077561Z level=info msg=Rendering path="d-solo/Ff6LG-e3r/enphase?orgId=1&panelId=3"
logger=rendering renderer=http t=2023-01-10T07:59:40.007126637Z level=debug msg="calling remote rendering service" url="http://grafana-renderer:8081/render?deviceScaleFactor=1.000000&domain=grafana&encoding=&height=500&renderKey=PByyWDRc9z3WTnVhim00EB4BWBsOsmMY&timeout=10&timezone=&url=http%3A%2F%2Fgrafana%3A3000%2Fd-solo%2FFf6LG-e3r%2Fenphase%3ForgId%3D1%26panelId%3D3%26render%3D1&width=1000"

## grafana-renderer 3.6.2
DBG Browser initialized | config={"acceptLanguage":null,"args":["--no-sandbox","--disable-gpu"],"chromeBin":"/usr/bin/chromium-browser","clustering":{"maxConcurrency":5,"mode":"browser","monitor":false,"timeout":30},"deviceScaleFactor":1,"dumpio":false,"emulateNetworkConditions":false,"headed":false,"height":500,"ignoresHttpsErrors":false,"maxDeviceScaleFactor":4,"maxHeight":3000,"maxWidth":3080,"mode":"default","timingMetrics":false,"verboseLogging":false,"width":1000}
INF HTTP Server started, listening at http://localhost:8081 

DBG ::ffff:172.18.0.6 - - [10/Jan/2023:07:58:31 +0000] "GET /render/version HTTP/1.1" 200 19 "-" "Grafana/9.2.4"
 
DBG Render request received | url=http://grafana:3000/d-solo/Ff6LG-e3r/enphase?orgId=1&panelId=3&render=1
ERR Browser uncaught exception | error=Error: RangeError: Invalid array length
    at Array.push (http://grafana:3000/public/build/4713.9debbfba7033186a58bf.js:2:1529224)
    at Object.splits (http://grafana:3000/public/build/4713.9debbfba7033186a58bf.js:2:2830508)
    at http://grafana:3000/public/build/4713.9debbfba7033186a58bf.js:2:2852098
    at Array.forEach (<anonymous>)
    at ir (http://grafana:3000/public/build/4713.9debbfba7033186a58bf.js:2:2851694)
    at http://grafana:3000/public/build/4713.9debbfba7033186a58bf.js:2:2854158
    at xr (http://grafana:3000/public/build/4713.9debbfba7033186a58bf.js:2:2854218)

DBG Deleting temporary file | file=/tmp/2d3b85bd.png
DBG ::ffff:172.18.0.6 - - [10/Jan/2023:07:59:48 +0000] "GET /render?deviceScaleFactor=1.000000&domain=grafana&encoding=&height=500&renderKey=PByyWDRc9z3WTnVhim00EB4BWBsOsmMY&timeout=10&timezone=&url=http%3A%2F%2Fgrafana%3A3000%2Fd-solo%2FFf6LG-e3r%2Fenphase%3ForgId%3D1%26panelId%3D3%26render%3D1&width=1000 HTTP/1.1" 200 9413 "-" "Grafana/9.2.4"
DBG Connection closed | url=http://grafana:3000/d-solo/Ff6LG-e3r/enphase?orgId=1&panelId=3&render=1


# test 3 --> error
## grafana 9.3.2
logger=settings t=2023-01-10T08:03:22.093332263Z level=info msg="Config overridden from Environment variable" var="GF_LOG_FILTERS=rendering:debug"
logger=settings t=2023-01-10T08:03:22.093398789Z level=info msg="Config overridden from Environment variable" var="GF_RENDERING_SERVER_URL=http://grafana-renderer:8081/render"
logger=settings t=2023-01-10T08:03:22.09342825Z level=info msg="Config overridden from Environment variable" var="GF_RENDERING_CALLBACK_URL=http://grafana:3000/"
logger=rendering renderer=http t=2023-01-10T08:03:22.459456186Z level=debug msg="calling remote rendering service" url=http://grafana-renderer:8081/render/version
logger=rendering renderer=http t=2023-01-10T08:03:22.462029482Z level=info msg="Backend rendering via external http server" version=3.6.2
logger=rendering renderer=http t=2023-01-10T08:03:30.016917644Z level=info msg=Rendering path="d-solo/Ff6LG-e3r/enphase?orgId=1&panelId=3"
logger=rendering renderer=http t=2023-01-10T08:03:30.01782794Z level=debug msg="calling remote rendering service" url="http://grafana-renderer:8081/render?deviceScaleFactor=1.000000&domain=grafana&encoding=&height=500&renderKey=QgUqNM1t37aJZed4IDe02MU3COwFCMS5&timeout=10&timezone=&url=http%3A%2F%2Fgrafana%3A3000%2Fd-solo%2FFf6LG-e3r%2Fenphase%3ForgId%3D1%26panelId%3D3%26render%3D1&width=1000"

## grafana-renderer
DBG Browser initialized | config={"acceptLanguage":null,"args":["--no-sandbox","--disable-gpu"],"chromeBin":"/usr/bin/chromium-browser","clustering":{"maxConcurrency":5,"mode":"browser","monitor":false,"timeout":30},"deviceScaleFactor":1,"dumpio":false,"emulateNetworkConditions":false,"headed":false,"height":500,"ignoresHttpsErrors":false,"maxDeviceScaleFactor":4,"maxHeight":3000,"maxWidth":3080,"mode":"default","timingMetrics":false,"verboseLogging":false,"width":1000}
INF HTTP Server started, listening at http://localhost:8081 

DBG ::ffff:172.18.0.6 - - [10/Jan/2023:08:03:22 +0000] "GET /render/version HTTP/1.1" 200 19 "-" "Grafana/9.3.2"
DBG Render request received | url=http://grafana:3000/d-solo/Ff6LG-e3r/enphase?orgId=1&panelId=3&render=1
ERR Browser uncaught exception | error=Error: RangeError: Invalid array length
    at Array.push (http://grafana:3000/public/build/9512.8fae0c667bb767d8cfd1.js:2:1570754)
    at Object.splits (http://grafana:3000/public/build/9512.8fae0c667bb767d8cfd1.js:2:2885329)
    at http://grafana:3000/public/build/9512.8fae0c667bb767d8cfd1.js:2:2907158
    at Array.forEach (<anonymous>)
    at sr (http://grafana:3000/public/build/9512.8fae0c667bb767d8cfd1.js:2:2906754)
    at http://grafana:3000/public/build/9512.8fae0c667bb767d8cfd1.js:2:2909236
    at kr (http://grafana:3000/public/build/9512.8fae0c667bb767d8cfd1.js:2:2909296)
DBG Deleting temporary file | file=/tmp/cd0e7e55.png
DBG ::ffff:172.18.0.6 - - [10/Jan/2023:08:03:37 +0000] "GET /render?deviceScaleFactor=1.000000&domain=grafana&encoding=&height=500&renderKey=QgUqNM1t37aJZed4IDe02MU3COwFCMS5&timeout=10&timezone=&url=http%3A%2F%2Fgrafana%3A3000%2Fd-solo%2FFf6LG-e3r%2Fenphase%3ForgId%3D1%26panelId%3D3%26render%3D1&width=1000 HTTP/1.1" 200 9596 "-" "Grafana/9.3.2"
DBG Connection closed | url=http://grafana:3000/d-solo/Ff6LG-e3r/enphase?orgId=1&panelId=3&render=1
@mxalis
Copy link

mxalis commented Jan 15, 2023

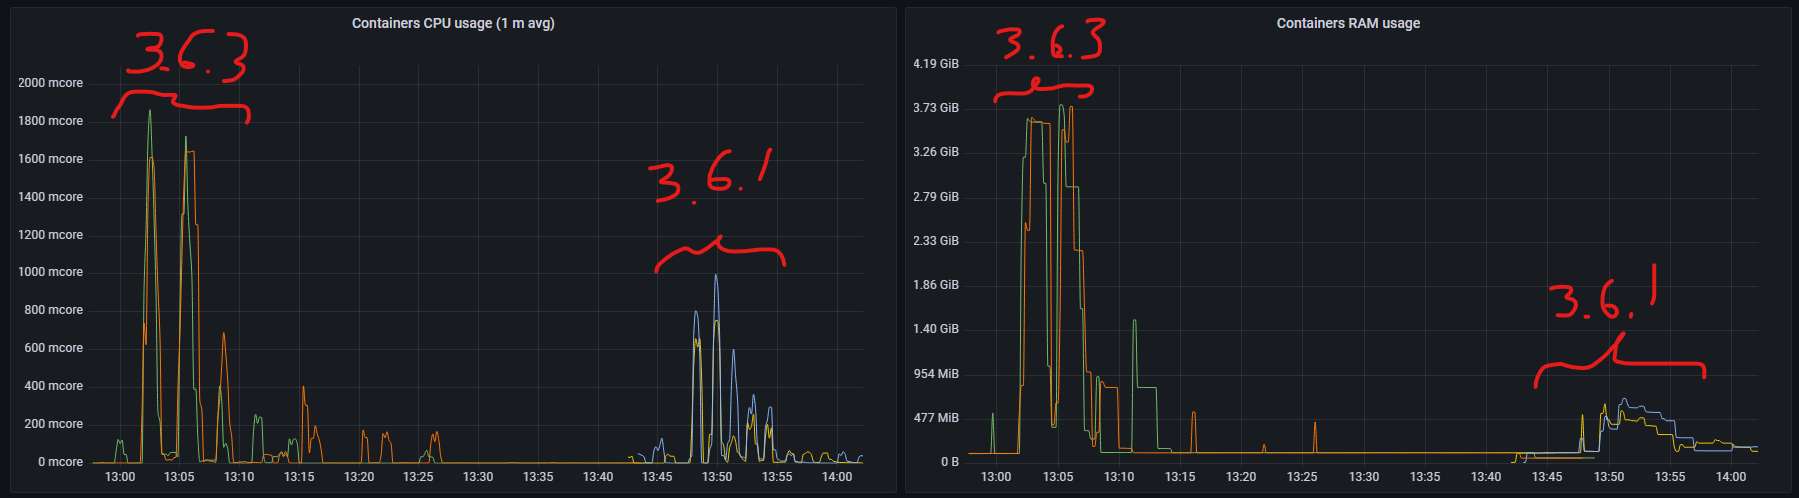
I have the same issue. It seems like adding a time zone to the render request url (eg tz=Asia%2FSeoul) makes the rendering work again, although the time zone itself has no effect on the time range (ie tz=Europe/Helsinki and tz=Asia/Tokyo will produce the same time range in the rendered image)

The time zones UTC and GMT do not work at all, ie adding tz=GMT to the url will result in and empty image

I tested downgrading from 3.6.3 to 3.6.1 and rendering without the tz url param works again, and tz=GMT works as well.

There is a big difference in the CPU and memory consumption as well. And version 3.6.3 kept throwing error messages about the browser crashing

image

2023-01-15 13:02:35 | {"error":"Error: RangeError: Invalid array length\n at Array.push (http://grafana:9999/public/build/9512.8fae0c667bb767d8cfd1.js:2:1570754)\n at Object.splits (http://grafana:9999/public/build/9512.8fae0c667bb767d8cfd1.js:2:2885329)\n at http://grafana:9999/public/build/9512.8fae0c667bb767d8cfd1.js:2:2907158\n at Array.forEach ()\n at sr (http://grafana:9999/public/build/9512.8fae0c667bb767d8cfd1.js:2:2906754)\n at http://grafana:9999/public/build/9512.8fae0c667bb767d8cfd1.js:2:2909236\n at kr (http://grafana:9999/public/build/9512.8fae0c667bb767d8cfd1.js:2:2909296)","level":"error","message":"Browser uncaught exception"}
2023-01-15 13:02:30 | {"error":"Error: Page crashed!","level":"error","message":"Browser page crashed"}
2023-01-15 13:02:29 | {"error":"Error: Page crashed!","level":"error","message":"Browser page crashed"}

@jantman
Copy link

jantman commented Jan 29, 2023

This appears to be a duplicate of grafana/grafana#59334

@mr-manuel
Copy link
Author

Indeed this is the same issue. With the workaround from grafana/grafana#59334 (comment) it works.

In my eyes the issue is from the renderer and not Grafana, since adding the time zone to the environment variables of the renderer solved the problem.

@joanlopez
Copy link
Collaborator

Indeed this is the same issue. With the workaround from grafana/grafana#59334 (comment) it works.

In my eyes the issue is from the renderer and not Grafana, since adding the time zone to the environment variables of the renderer solved the problem.

Hi @mr-manuel, thanks for sharing your thoughts.

So, do you think the Image Renderer should just handle the case when there's no TZ defined and just pass null to Page.emulateTimezone() in such case? Any other suggestion?

Thanks!

@mr-manuel
Copy link
Author

If it's working with null then yes, else use the available system timezone. If no time zone is available and null is not working then use UTC.

@AgnesToulet
Copy link
Contributor

Closing this issue as from this, it seems to be fixed with latest versions of the image renderer.

Please reach out if you still face this issue.

Sign up for free to join this conversation on GitHub. Already have an account? Sign in to comment
Labels
None yet
Projects
None yet
Development

No branches or pull requests

5 participants