Skip to content
New issue

Have a question about this project? Sign up for a free GitHub account to open an issue and contact its maintainers and the community.

By clicking “Sign up for GitHub”, you agree to our terms of service and privacy statement. We’ll occasionally send you account related emails.

Already on GitHub? Sign in to your account

failed to take screenshot: dial tcp :0: connect: connection refused #411

Closed
peycho opened this issue Mar 14, 2023 · 13 comments
Closed

failed to take screenshot: dial tcp :0: connect: connection refused #411

peycho opened this issue Mar 14, 2023 · 13 comments
Assignees

Comments

@peycho
Copy link

peycho commented Mar 14, 2023

Hello guys.

I'm having troubles making this work and after so many experiments I still see this error.

Grafana version v9.4.3
Plugin: grafana-image-renderer 3.6.4
Used OS: Ubuntu server 22.04 hosted in AWS ec2 instance.

I have some experience with Grafana before, but not with the latest versions. I already have 3 different setups with Grafana and grafana-image-renderer but they use the old alerting management not the current one so called Unified Alerting.

In the current setup I'm trying to achieve the same results like before.
Grafana + alerts + image(screenshots) in the alerts notifications.

I've created the following setup:

Independent Server for Grafana service and plugins and the memcached service (for better optimization and catching some data sources configurations)

RDS instance with PostgreSQL for storing configurations/dashboards/users/alerts/etc...

Independent server with running image rendering service.

How the services are configured:

Grafana works on port 3000 and it is behind Application LB that serve the web UI at port 443 (https)
Grafana deployment is pretty much standard. The single additional plugin I added is grafana-image-renderer. The plugin is installed via grafana command line interface.

The rendering server is run as standalone Node.js application. I don't use docker on any of the servers at the moment. It is installed as per the readme in https://github.com/grafana/grafana-image-renderer/

The service runs on 0.0.0.0 and use its default port 8081 as systemd service.
The IP address of the server is defined as A record to a specific hostname that is used on other configurations in Grafana.

The installed Chrome version:

/opt/google/chrome/chrome --version
Google Chrome 111.0.5563.64

I don't think the problem is the renderer service because the log file doesn't show me errors, but I can clearly see that Grafana is checking the version.
Example

{"level":"debug","message":"172.17.40.158 - - [14/Mar/2023:14:02:18 +0000] \"GET /render/version HTTP/1.1\" 200 19 \"-\" \"Grafana/9.4.3\"\n"}

I don't see any other output in the renderer log that means Grafana don't even try to use it for some reason.

Grafana has the following settings in regards of the images/screenshots.

I've disabled the legacy alerts and enabled the Unified Alerting

[alerting]
enabled = false

[unified_alerting]
enabled = true

Screenshots.

[unified_alerting.screenshots]
capture = true
capture_timeout = 10s
max_concurrent_screenshots = 5
upload_external_image_storage = true

Images store is configured to use Amazon S3

#################################### External image storage ##########################
[external_image_storage]
# Used for uploading images to public servers so they can be included in slack/email messages.
# you can choose between (s3, webdav, gcs, azure_blob, local)
provider = s3

[external_image_storage.s3]
endpoint = https://s3.us-east-1.amazonaws.com/
bucket = mybucket-images
region = us-east-1

Rendering settings (the token is the same on renderer service and grafana)

[rendering]
server_url = http://renderer-dev.mydomain.net:8081/render
callback_url = https://grafana-dev.mydomain.net/
renderer_token MyToken
[plugin.grafana-image-renderer]
rendering_timezone = UTC
rendering_ignore_https_errors = true
rendering_mode = clustered
rendering_clustering_mode = context

Grafana root_url is pointed to the application LB and it is accessible from the rendered server. (required for callback)

Everything looks normal. Grafana is accessible. I created several dashboards with source Croudwatch.
I created a single alert to start testing the new deployment. Created a simple e-mail and Pagerduty notifications or so called Contact points and used the default notification policy.

The alerts work, but no screenshot attached.

The only error I found in the logs is this:

logger=ngalert.state.manager rule_uid=WMrb_NaVz org_id=1 instance="LoadBalancerName=XXXXXXX" t=2023-03-14T14:22:00.118942516Z level=debug msg="Keeping state" state=Alerting
logger=ngalert.image rule_uid=WMrb_NaVz org_id=1 dashboard=iudpAn-4z panel=2 t=2023-03-14T14:22:00.119002948Z level=debug msg="Requesting screenshot"
logger=rendering renderer=http t=2023-03-14T14:22:00.130608569Z level=info msg=Rendering path="d-solo/iudpAn-4z/peycho-test-dash?from=now-1h&orgId=1&panelId=2&to=now"
logger=ngalert.state.manager rule_uid=WMrb_NaVz org_id=1 instance="LoadBalancerName=XXXXXXX" t=2023-03-14T14:22:00.130928326Z level=warn msg="Failed to take an image" dashboard=iudpAn-4z panel=2 error="failed to take screenshot: dial tcp :0: connect: connection refused"
logger=ngalert.state.manager rule_uid=WMrb_NaVz org_id=1 t=2023-03-14T14:22:00.130997107Z level=debug msg="Saving alert states" count=1

On the renderer service side I see nothing but the last version check made by Grafana itself.

{"level":"debug","message":"172.17.40.158 - - [14/Mar/2023:14:02:18 +0000] \"GET /render/version HTTP/1.1\" 200 19 \"-\" \"Grafana/9.4.3\"\n"}

I though the external options is buggy or something, so I installed the renderer on the same server, configured the service to run on 0.0.0.0:8081 and reconfigured grafana to use localhost, like in the documentation. Sadly the result is the same.

In general, I'm kinda stuck with this error that shows me nothing that would guide me to the problem.
It even don't show the ip/port that it's attempting to connect to.

Note that Grafana and renderer service are both configured with debug option for all logs. console and file.

I can provide any additional information if necessary.

Thanks in advance.

@peycho
Copy link
Author

peycho commented Apr 3, 2023

I've removed the locally installed plugin and tried again. The result was the same.

logger=ngalert.state.manager rule_uid=I6Qzd3B4k org_id=1 instance="LoadBalancerName=xxxxx" t=2023-04-03T06:42:00.11475621Z level=warn msg="Failed to take an image" dashboard=hrUR38B4k panel=2 error="failed to take screenshot: dial tcp :0: connect: connection refused"

Does anyone know how to see the full error of the problem, so I can debug the issue further?
This error tells me nothing....

@Clarity-89
Copy link
Contributor

I've removed the locally installed plugin and tried again. The result was the same.

logger=ngalert.state.manager rule_uid=I6Qzd3B4k org_id=1 instance="LoadBalancerName=xxxxx" t=2023-04-03T06:42:00.11475621Z level=warn msg="Failed to take an image" dashboard=hrUR38B4k panel=2 error="failed to take screenshot: dial tcp :0: connect: connection refused"

Does anyone know how to see the full error of the problem, so I can debug the issue further? This error tells me nothing....

You can set the log level to debug and set RENDERING_VERBOSE_LOGGING to true to see more verbose logging output: https://grafana.com/docs/grafana/latest/setup-grafana/image-rendering/#log-level

@peycho
Copy link
Author

peycho commented Apr 6, 2023

Thanks.

I updated the settings of the renderer service, but still nothing extra in the log that could point me the problem.

{"level":"info","maxConcurrency":20,"message":"using clustered browser","mode":"context","timeout":30}
{"config":{"args":["--no-sandbox","--disable-setuid-sandbox","--disable-gpu","--window-size=1280x758"],"chromeBin":"/usr/bin/google-chrome-stable","clustering":{"maxConcurrency":20,"mode":"context","monitor":false,"timeout":30},"deviceScaleFactor":1,"dumpio":false,"emulateNetworkConditions":false,"headed":false,"height":500,"ignoresHttpsErrors":false,"maxDeviceScaleFactor":4,"maxHeight":3000,"maxWidth":3000,"mode":"clustered","pageZoomLevel":1,"timezone":"UTC","timingMetrics":false,"verboseLogging":true,"width":1000},"level":"debug","message":"Browser initialized"}
{"level":"debug","message":"Launching Browser cluster with puppeteer-cluster"}
{"level":"info","message":"HTTP Server started, listening at http://0.0.0.0:8081"}

Only some version checks from grafana.

{"level":"debug","message":"172.17.42.66 - - [06/Apr/2023:15:00:31 +0000] \"GET /render/version HTTP/1.1\" 200 19 \"-\" \"Grafana/9.4.7\"\n"}

In grafana log:

logger=ngalert.state.manager rule_uid=I6Qzd3B4k org_id=1 instance="LoadBalancerName=xxxxxx" t=2023-04-06T14:56:00.126677788Z level=warn msg="Failed to take an image" dashboard=hrUR38B4k panel=2 error="failed to take screenshot: dial tcp :0: connect: connection refused"

@AgnesToulet
Copy link
Contributor

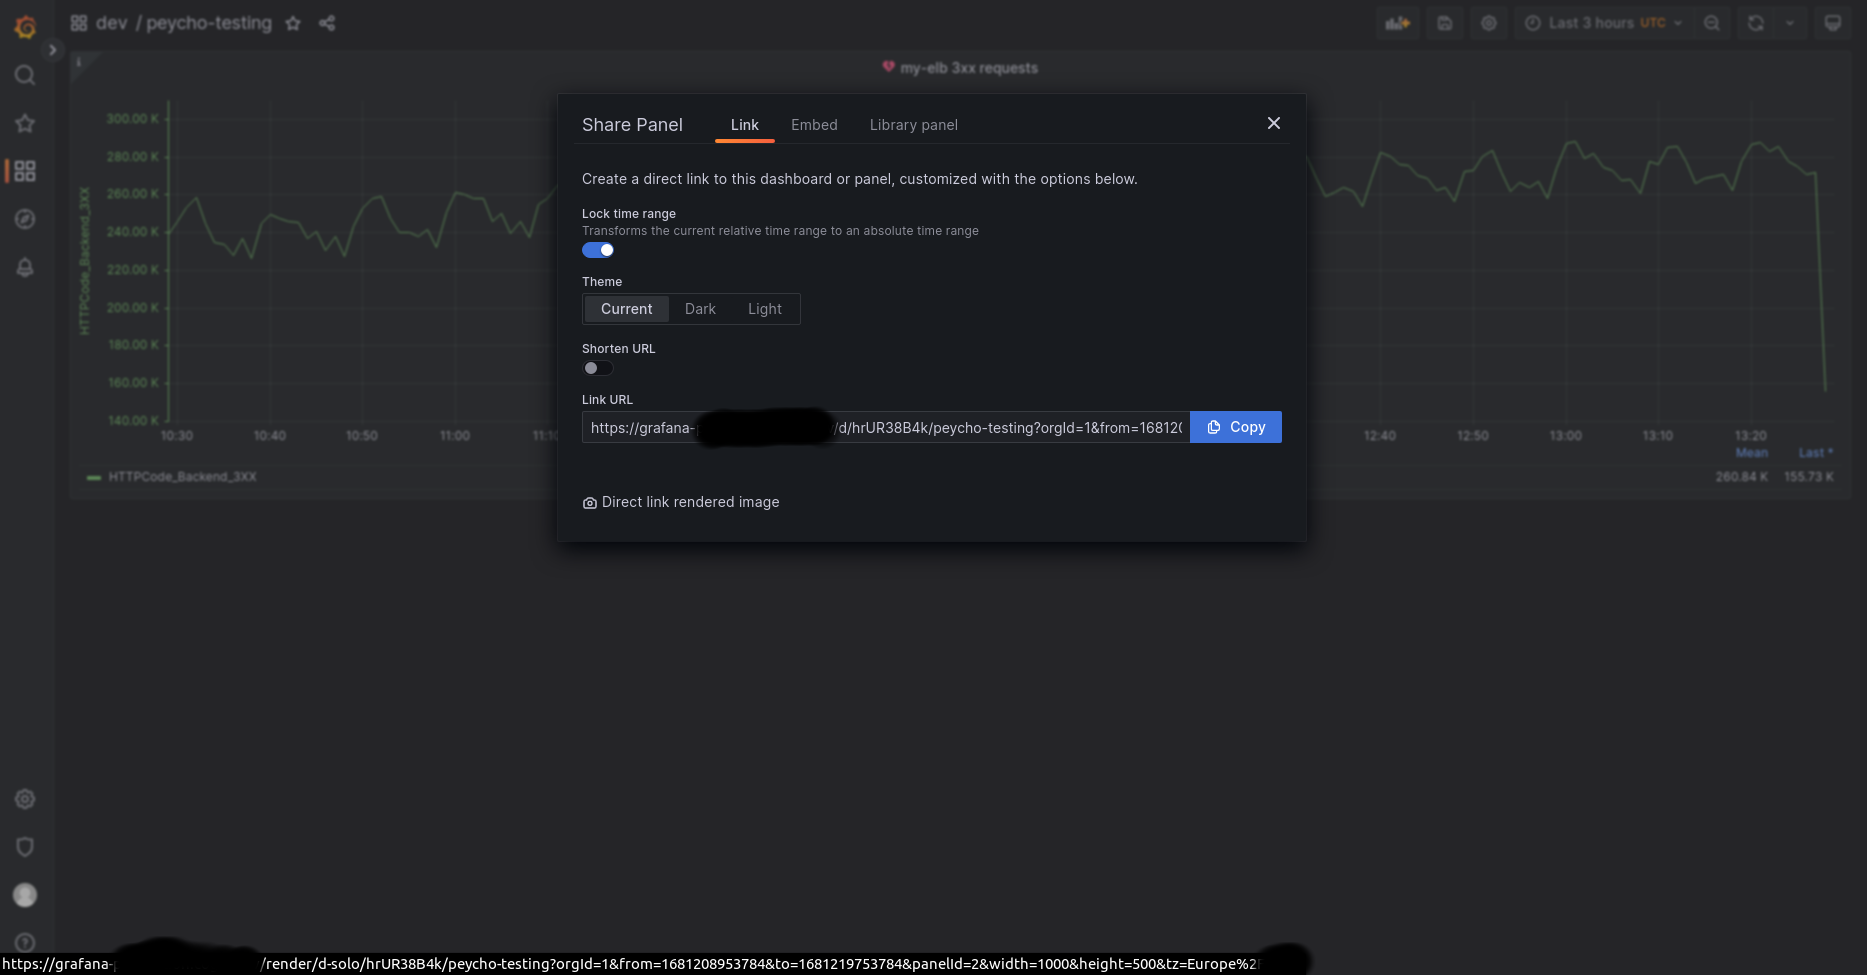
Hello! It seems from the error that Grafana can't call the image renderer even though it's working when retrieving the version. Could you try taking a screenshot of a panel to see if the issue is between Grafana and the image renderer or in the alerting configuration? (Go to any dashboard, click on a panel title > Share > direct link rendered image)

@peycho
Copy link
Author

peycho commented Apr 11, 2023

Hi.

Thank you for your response.

I think the alert works, I receive e-mails. (without images ofc.)

I followed your steps. Here's the result:
Gafana Log when I click on "direct link rendered image"

logger=ngalert.scheduler t=2023-04-11T13:29:10.012230129Z level=debug msg="No changes detected. Skip updating"
logger=accesscontrol.service t=2023-04-11T13:29:15.570177974Z level=debug msg="fetch permissions from store" key=rbac-permissions-1-user-1
logger=accesscontrol.service t=2023-04-11T13:29:15.582848959Z level=debug msg="cache permissions" key=rbac-permissions-1-user-1
logger=rendering renderer=http t=2023-04-11T13:29:15.583059586Z level=info msg=Rendering path="d-solo/hrUR38B4k/peycho-testing?orgId=1&from=1681208953784&to=1681219753784&panelId=2&width=1000&height=500&tz=Europe%2FRemoved"
logger=context userId=1 orgId=1 uname=admin t=2023-04-11T13:29:15.583304393Z level=error msg="Rendering failed." error="dial tcp :0: connect: connection refused"
logger=context userId=1 orgId=1 uname=admin t=2023-04-11T13:29:15.584320173Z level=error msg="Request Completed" method=GET path=/render/d-solo/hrUR38B4k/peycho-testing status=500 remote_addr=172.17.72.64 time_ms=49 duration=49.230732ms size=619 referer= handler=/render/*
logger=ngalert.state.manager t=2023-04-11T13:29:16.27955982Z level=debug msg="Recording state cache metrics" now=2023-04-11T13:29:16.279547083Z
logger=ngalert.scheduler t=2023-04-11T13:29:20.012178107Z level=debug msg="No changes detected. Skip updating"

I see no new requests to the renderer.

{"level":"debug","message":"172.17.42.66 - - [11/Apr/2023:12:30:31 +0000] \"GET /render/version HTTP/1.1\" 200 19 \"-\" \"Grafana/9.4.7\"\n"}
{"level":"debug","message":"172.17.42.66 - - [11/Apr/2023:12:45:31 +0000] \"GET /render/version HTTP/1.1\" 200 19 \"-\" \"Grafana/9.4.7\"\n"}
{"level":"debug","message":"172.17.42.66 - - [11/Apr/2023:13:00:31 +0000] \"GET /render/version HTTP/1.1\" 200 19 \"-\" \"Grafana/9.4.7\"\n"}
{"level":"debug","message":"172.17.42.66 - - [11/Apr/2023:13:15:31 +0000] \"GET /render/version HTTP/1.1\" 200 19 \"-\" \"Grafana/9.4.7\"\n"}
{"level":"debug","message":"172.17.42.66 - - [11/Apr/2023:13:30:31 +0000] \"GET /render/version HTTP/1.1\" 200 19 \"-\" \"Grafana/9.4.7\"\n"}
{"level":"debug","message":"172.17.42.66 - - [11/Apr/2023:13:45:31 +0000] \"GET /render/version HTTP/1.1\" 200 19 \"-\" \"Grafana/9.4.7\"\n"}

What I see in grafana when click on "direct link rendered image"

Screenshot from 2023-04-11 16-31-59

Screenshot from 2023-04-11 16-29-51

Screenshot from 2023-04-11 16-47-35

Screenshot from 2023-04-11 16-50-15

Let me know if additional details are needed.
Thank you.

@AgnesToulet
Copy link
Contributor

Thank you for the additional information. I noticed you should see one more log line if Grafana even tried to send the request to the image renderer. As it's not the case, I think it fails before that, when trying to retrieve the render key (the token that allows the image renderer to access Grafana dashboards as a logged in user).

Do you have any custom configuration for the remote cache ([remote_cache] section of the config file)?

@AgnesToulet AgnesToulet self-assigned this Apr 11, 2023
@peycho
Copy link
Author

peycho commented Apr 11, 2023

Hi.

Yes I have. I pointed that in my first post that I use memcached service for caching data sources and whatever grafana needs to cache.

Here is what I have in remote_cache configuration.

#################################### Cache server #############################
[remote_cache]
# Either "redis", "memcached" or "database" default is "database"
type = memcached
memcache: 127.0.0.1:11211

Thanks.

@AgnesToulet
Copy link
Contributor

Yes sorry, I didn't think it could be related to this image renderer error when I first read your issue.

Your configuration should be:

#################################### Cache server #############################
[remote_cache]
# Either "redis", "memcached" or "database" default is "database"
type = memcached
connstr = 127.0.0.1:11211

@peycho
Copy link
Author

peycho commented Apr 11, 2023

Hi.

Oh my god. This is what means to know your stuff.
Grafana started to send requests to the rendering service and the renderer works as well as expected.

I have no idea why I messed up this settings and the error gives me no clue what's happening.

Thank you so much.

@AgnesToulet
Copy link
Contributor

You're right, the error message could be prefixed with something like "error retrieving render key". I'm in the middle of something on my local Grafana repo but I'll look into improving the log there. (If you're familiar with Go and are willing to open a PR yourself, the line in question is this one.)

Glad your issue is fixed now! Closing this issue.

@Rahuluppu
Copy link

Hello @peycho & @AgnesToulet

I am also facing the same issue!!! but how do you setup in [remote_cache]
Please guide me…. Thanks in advance!!!

@peycho
Copy link
Author

peycho commented Apr 25, 2023

You can see the above comments.
I was using wrong var name for the memcached connection.
Like: memcache = 127.0.0.1:11211

It should be: connstr = 127.0.0.1:11211

btw remote_cache is optional. If you don't use it and have the same error, it might be something else.

Note: the problem might be something else. @AgnesToulet mentioned that the error reporting need to be updated to provide better error output.

I suggest you to open issue and provide all the information about your configuration setup. Without any credentials of course.

@Rahuluppu
Copy link

Rahuluppu commented Apr 25, 2023

Hello, have configured Prometheus and Grafana (i.e.) we want it for internal image storage.
So we can send image alerts. Normally we are able to send alerts without image.

Any ideas @peycho and @AgnesToulet.

#################################### Cache server #############################
[remote_cache]
type = memcached
connstr = 127.0.0.1:11211
prefix =
encryption =

Sign up for free to join this conversation on GitHub. Already have an account? Sign in to comment
Labels
None yet
Projects
None yet
Development

No branches or pull requests

4 participants