metrictank memory issues #2009
Comments
|
Another Metrictank user here. It's definitely memory hog. Also, IMO Metrictank it's not really designed to work as standalone application. E.g. during restart you will loose access to metrics until replay from Kafka would not be finished - so, you need at least pair of instances. It's designed to be used in cluster installations with orchestrated control. In our case if we see number of metrics increasing (which cause memory pressure) we're just increasing number of nodes and doing rolling restart.
|
|
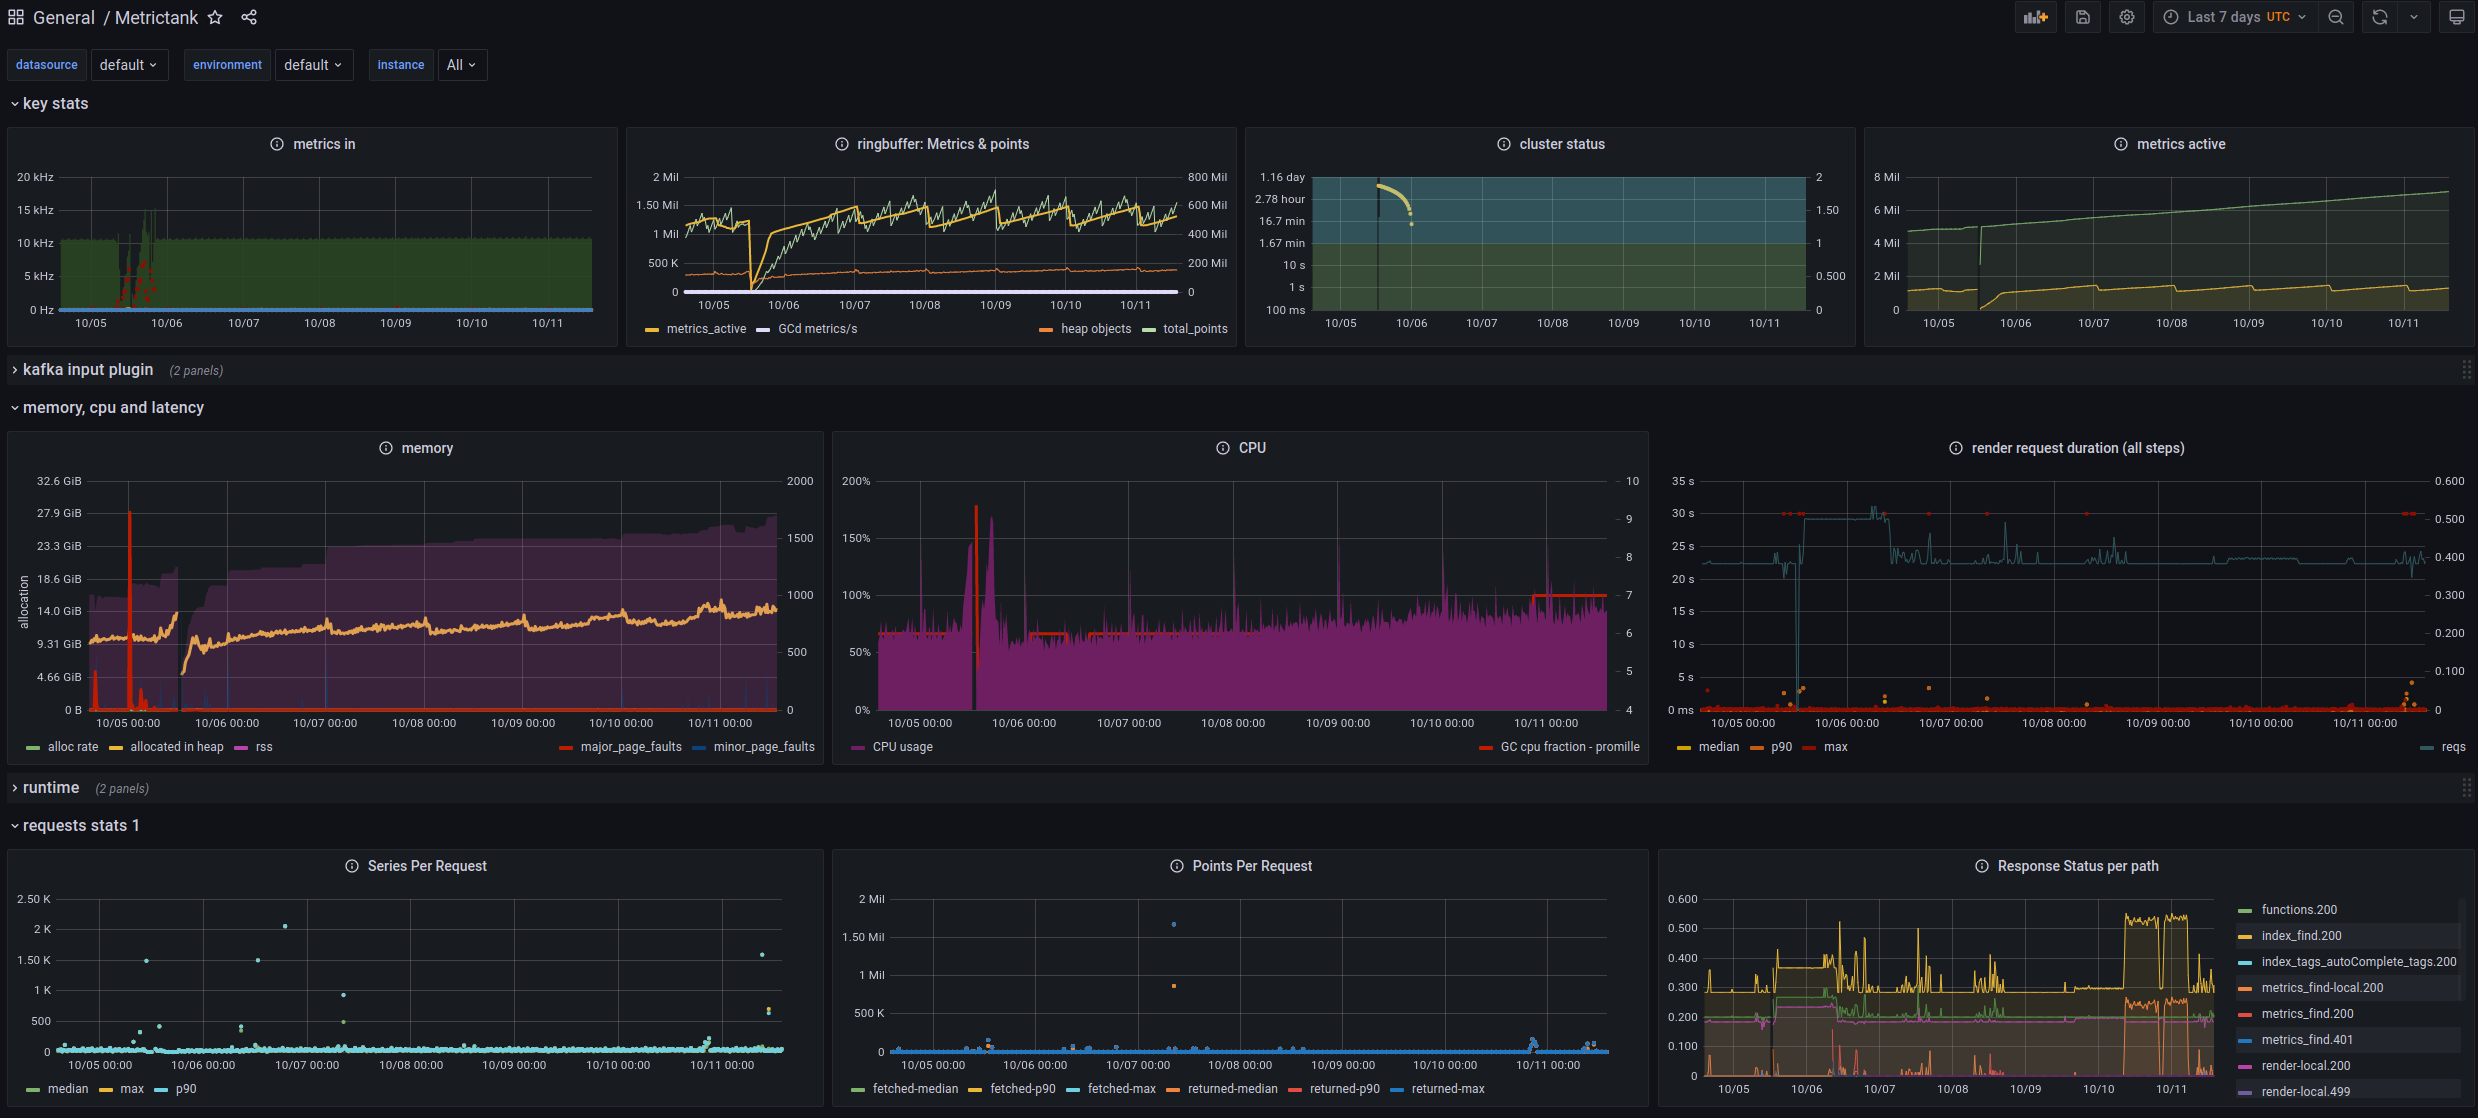
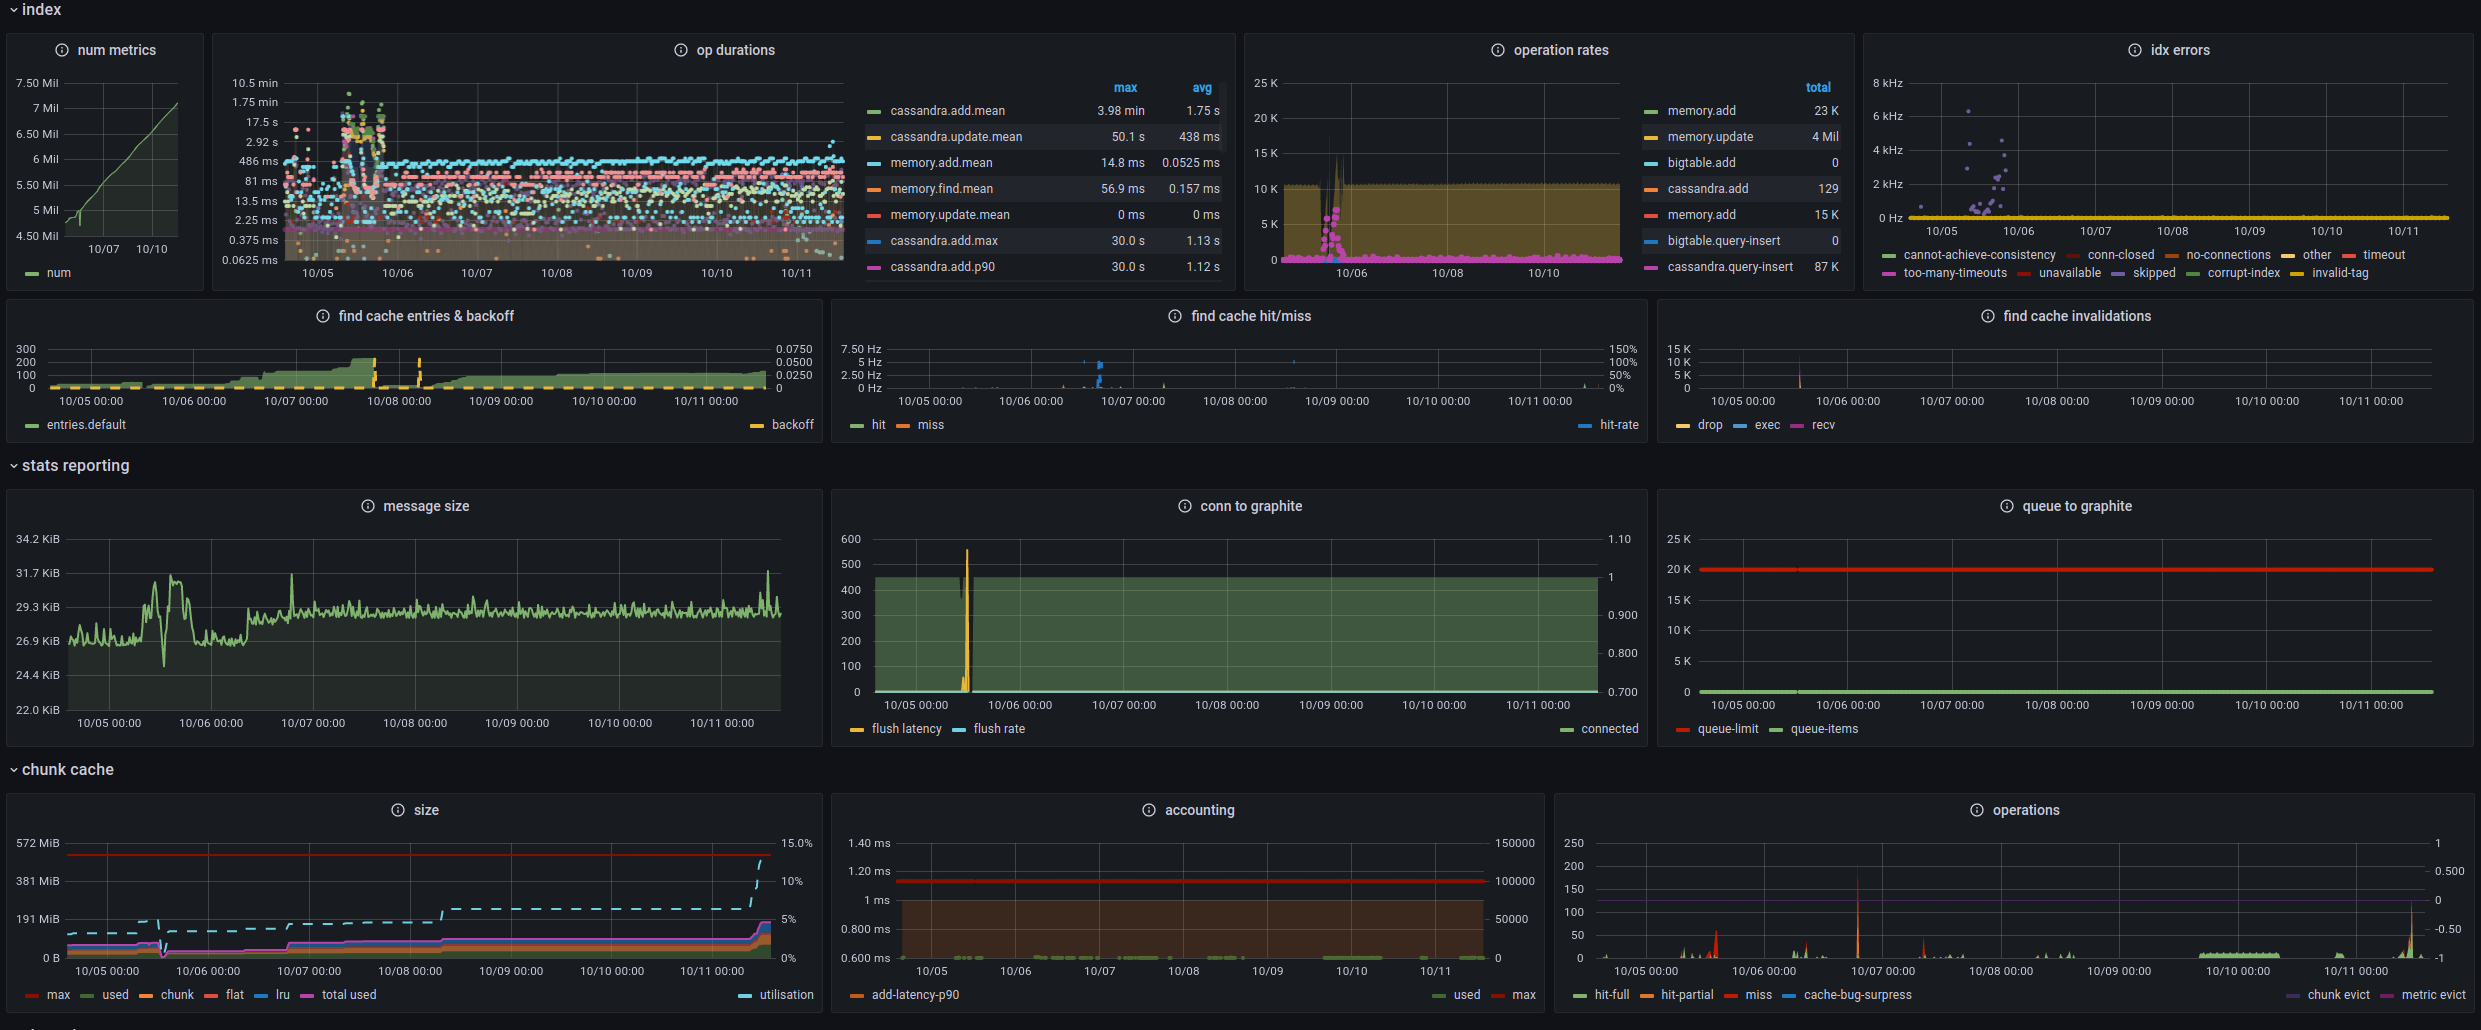
If you look at the "metrics active" it seems like there are new series being indexed regularly. You might need to set up pruning in index-rules config to trim off stale series (e.g. not seen in 3 days). This will make those series unquery-able so make sure it's set appropriately. Also, I agree with @deniszh about running a single instance. MT is meant to scale ingest linearly, so partitioning across multiple instances is the way to grow. |
|
@deniszh We already use go-carbon + whisperdb and it has already reached its limits, 99% disk util and we can't run interesting queries without timeouts. I tried to change to metrictank with a single node setup in a 32CPU+60GB ram machine but it looks like the memory is constantly increasing whatever I try to do. I will start using a double instance so at least it ping pongs betweens those two? @shanson7 thanks for the insight, there is one subgroup of metrics that is currently at 8.9M. I guess I will need to start pruning it. |
|
We are experiencing the exact same behavior, with more than 50M existing metrics and ~500k daily new metrics due to ephemeral container or instance IDs in the metric name. Without index pruning, MT heap uses like 250GB of RAM per instance and keeps growing as new metrics are created, which is not suitable in the long term. On the other side, with index pruning activated, MT heap tends to stabilize, but old metrics can no longer be rendered even if the data is still present in the backend. Is there a way to more rely on the backend to lower memory usage, even if it would degrade (maybe not so much?) requests performances? |
|
I moved the metrictank instance now to a new VM with 60GB of RAM, so it doesn't have to run with scylladb anymore, prune metrics inactive older than a week, and from 10M active metrics I went down to 4M. Now metrictank uses suddenly a lot of memory and does nothing (no render, no metrics ingest) at 50% of memory usage. Does this have to do that a lot of requests (20K packets per minute with various amount of metrics) go to the carbon input of metrictank? |
|
This issue has been automatically marked as stale because it has not had recent activity. It will be closed if no further activity occurs. Thank you for your contributions. |
We are trying to use Metrictank (v1.1) to move from our graphite monitoring and we have some couple of issues regarding memory.
We run a machine with scylladb and metrictank together and we try to limit the memory that get accumulated over time by metrictank. In scylladb you can set a max memory and it will operate up to that amount.
In metrictank you are trying to configure some parameters in order to flush memory fast enough to the db backend to not have any memory issues. I ran pprof on metrictank and got these values:
while top shows this output (27.7g used) so how do I check the RSS memory?
I changed the config before to have
But still the memory is constantly acummulating, how should I proceed from here?
Are thene any parameters to reduce the memory used? Shouldn't GC take care of this memory used?
If I set a memorymax on systemd I will get periodic holes in our metrics once it restarts.
Having a second process as a replica just to keep at least one active while the other resets from memory issues should not be a solution.
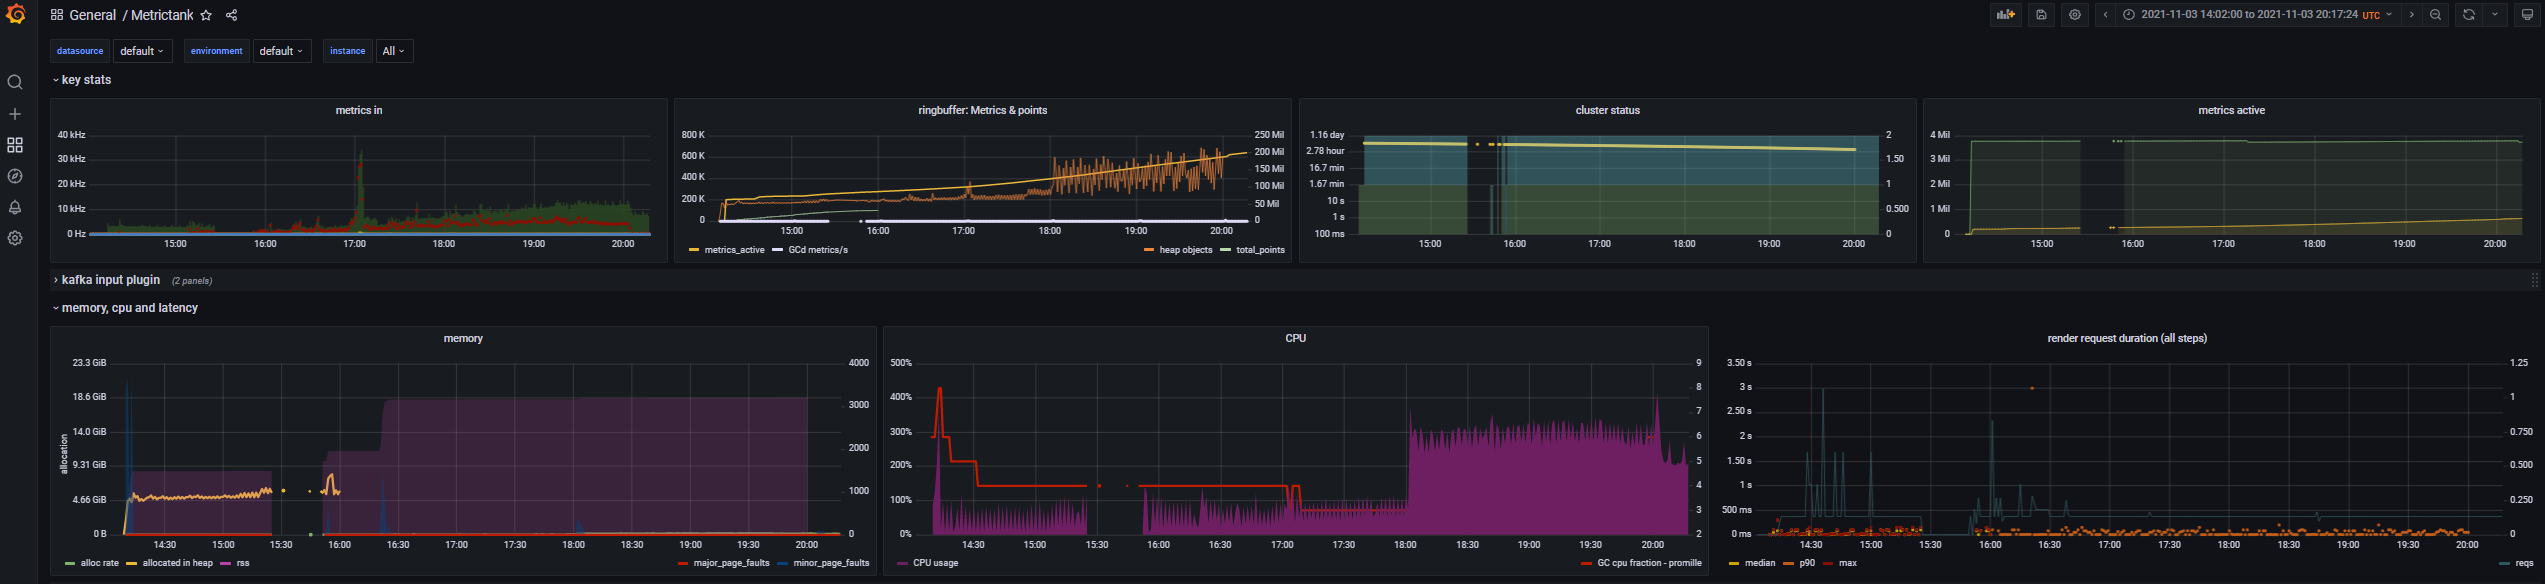
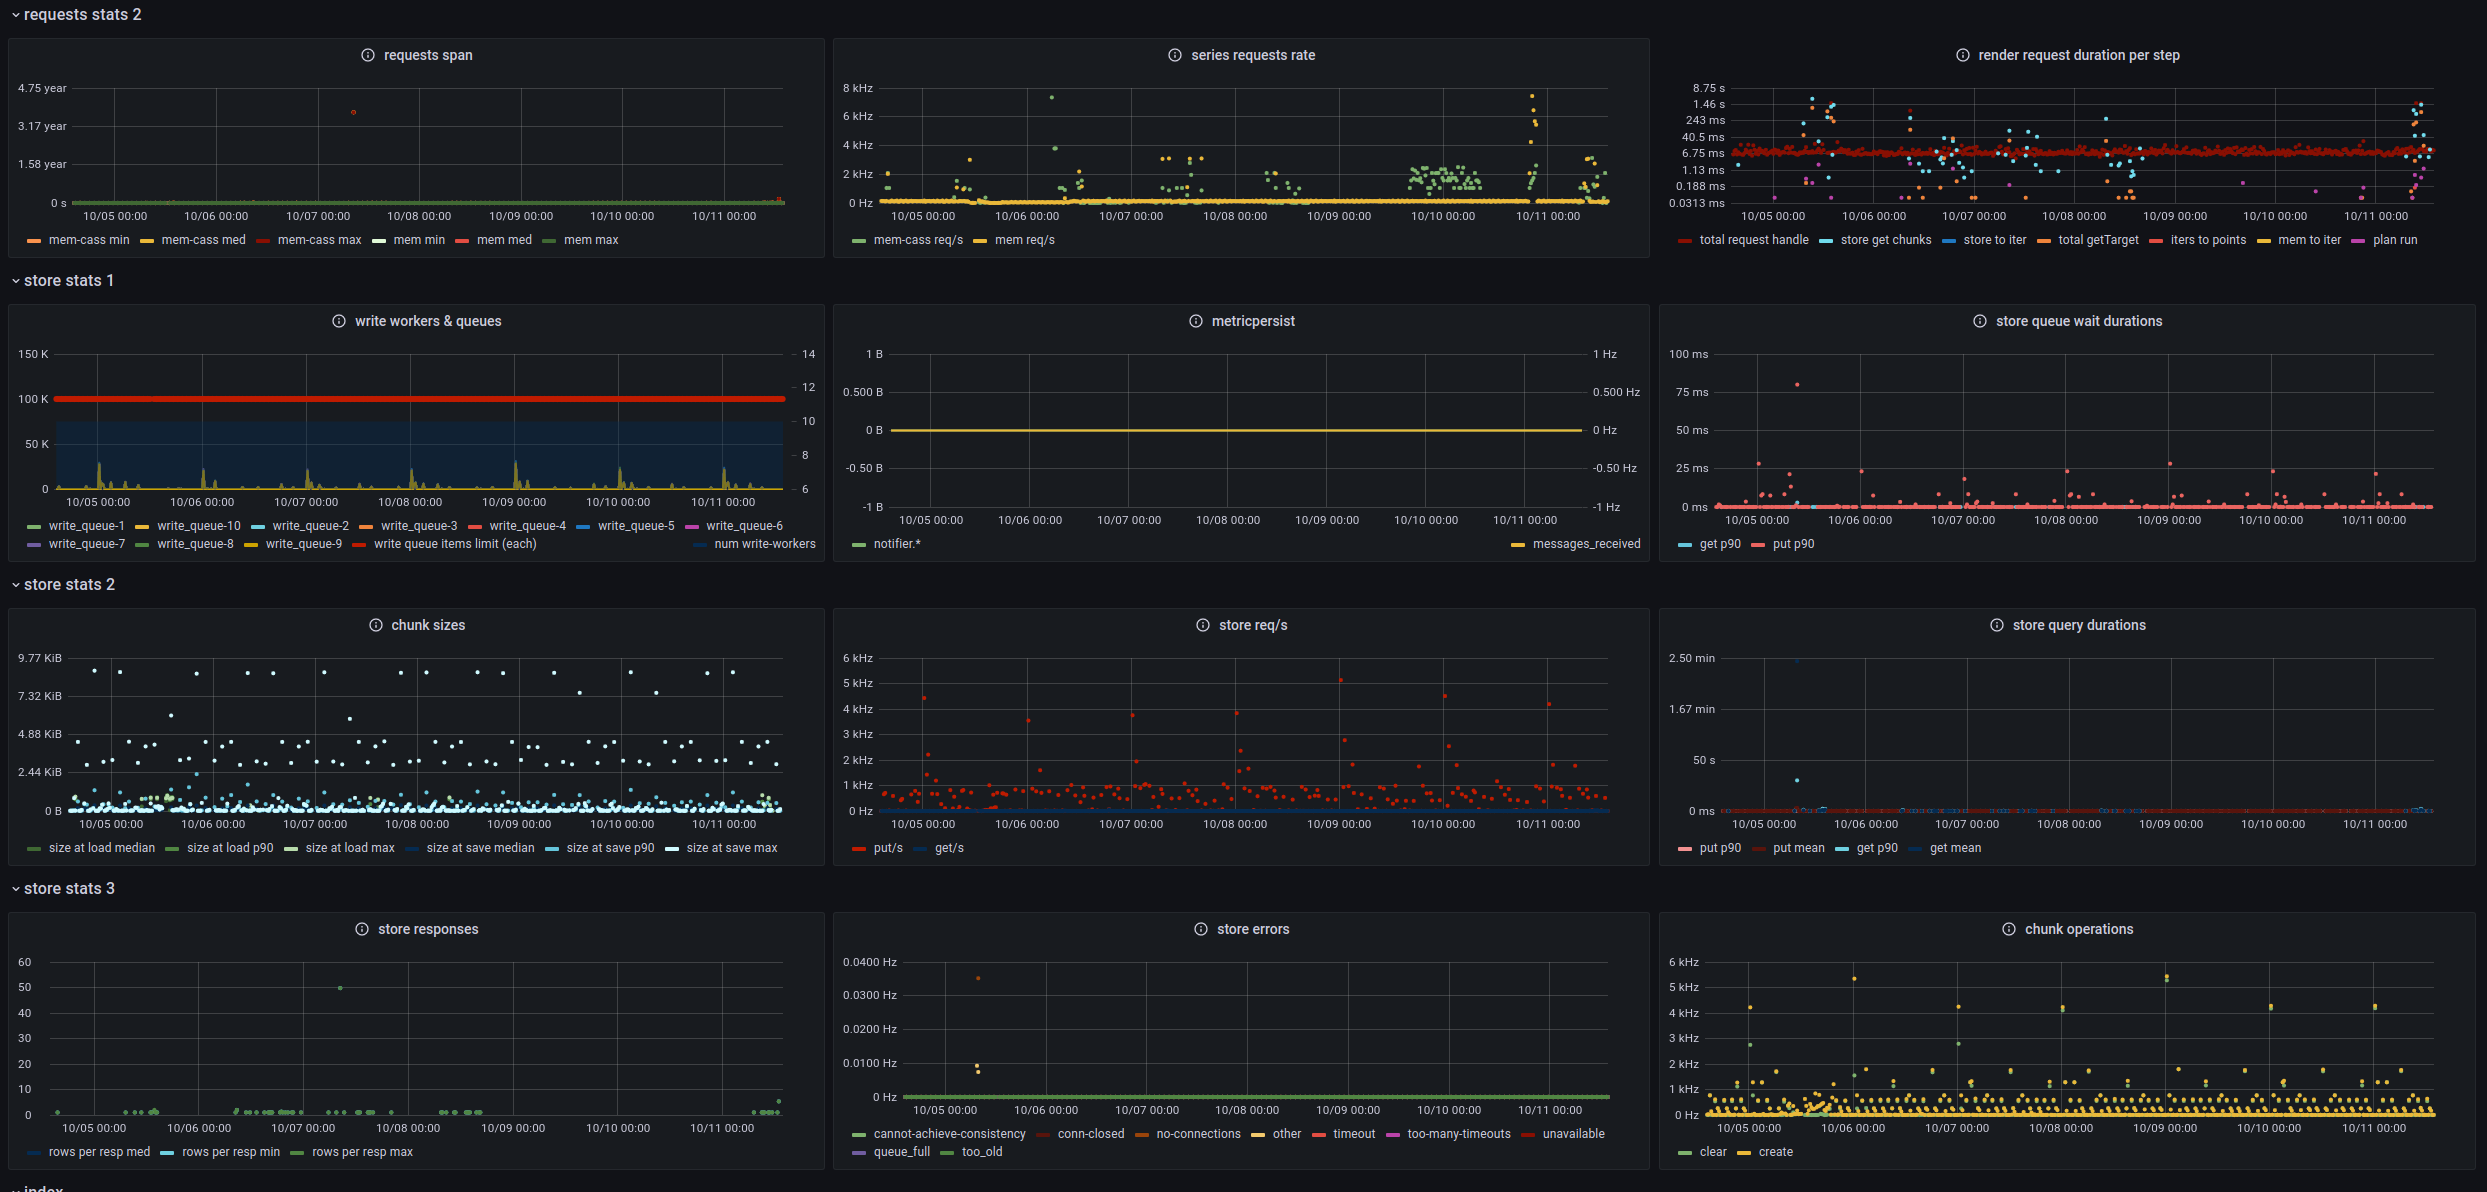
I have also attached some screenshots to understand the usage, etc. At around 12:00 on 5/10 I restarted the process with the latest config. Most of it is similar to the default, but with 500 read connections to scylladb and the changes i mentioned before.
The text was updated successfully, but these errors were encountered: