Alert fails on dashboard using opensearch datasource with TLS client auth enabled #111
Comments
|
Just to also mention, the alert does not work and it fails with same error even with the latest Grafana version 9.3.6 and the latest Opensearch datasource plugin version 2.0.5. Please note although that we want the fix for the older version of Grafana (v7.5.17) and Opensearch datasource plugin (v1.1.2) as mentioned above in the issue description. |
|
@devesh2k7 thanks for that! A few more clarifying questions for when you get a chance:
and to clarify are these the versions you're seeing the issue on? |
|
@sarahzinger Thanks for acknowledging! Please find the responses inline (highlighted in bold):
|
|
Hi @devesh2k7, thanks for all the responses.
|
|
Hi @fridgepoet, please find the responses to the queries below:
|


|
Hi @devesh2k7 thanks for reporting this issue and providing all the information! |
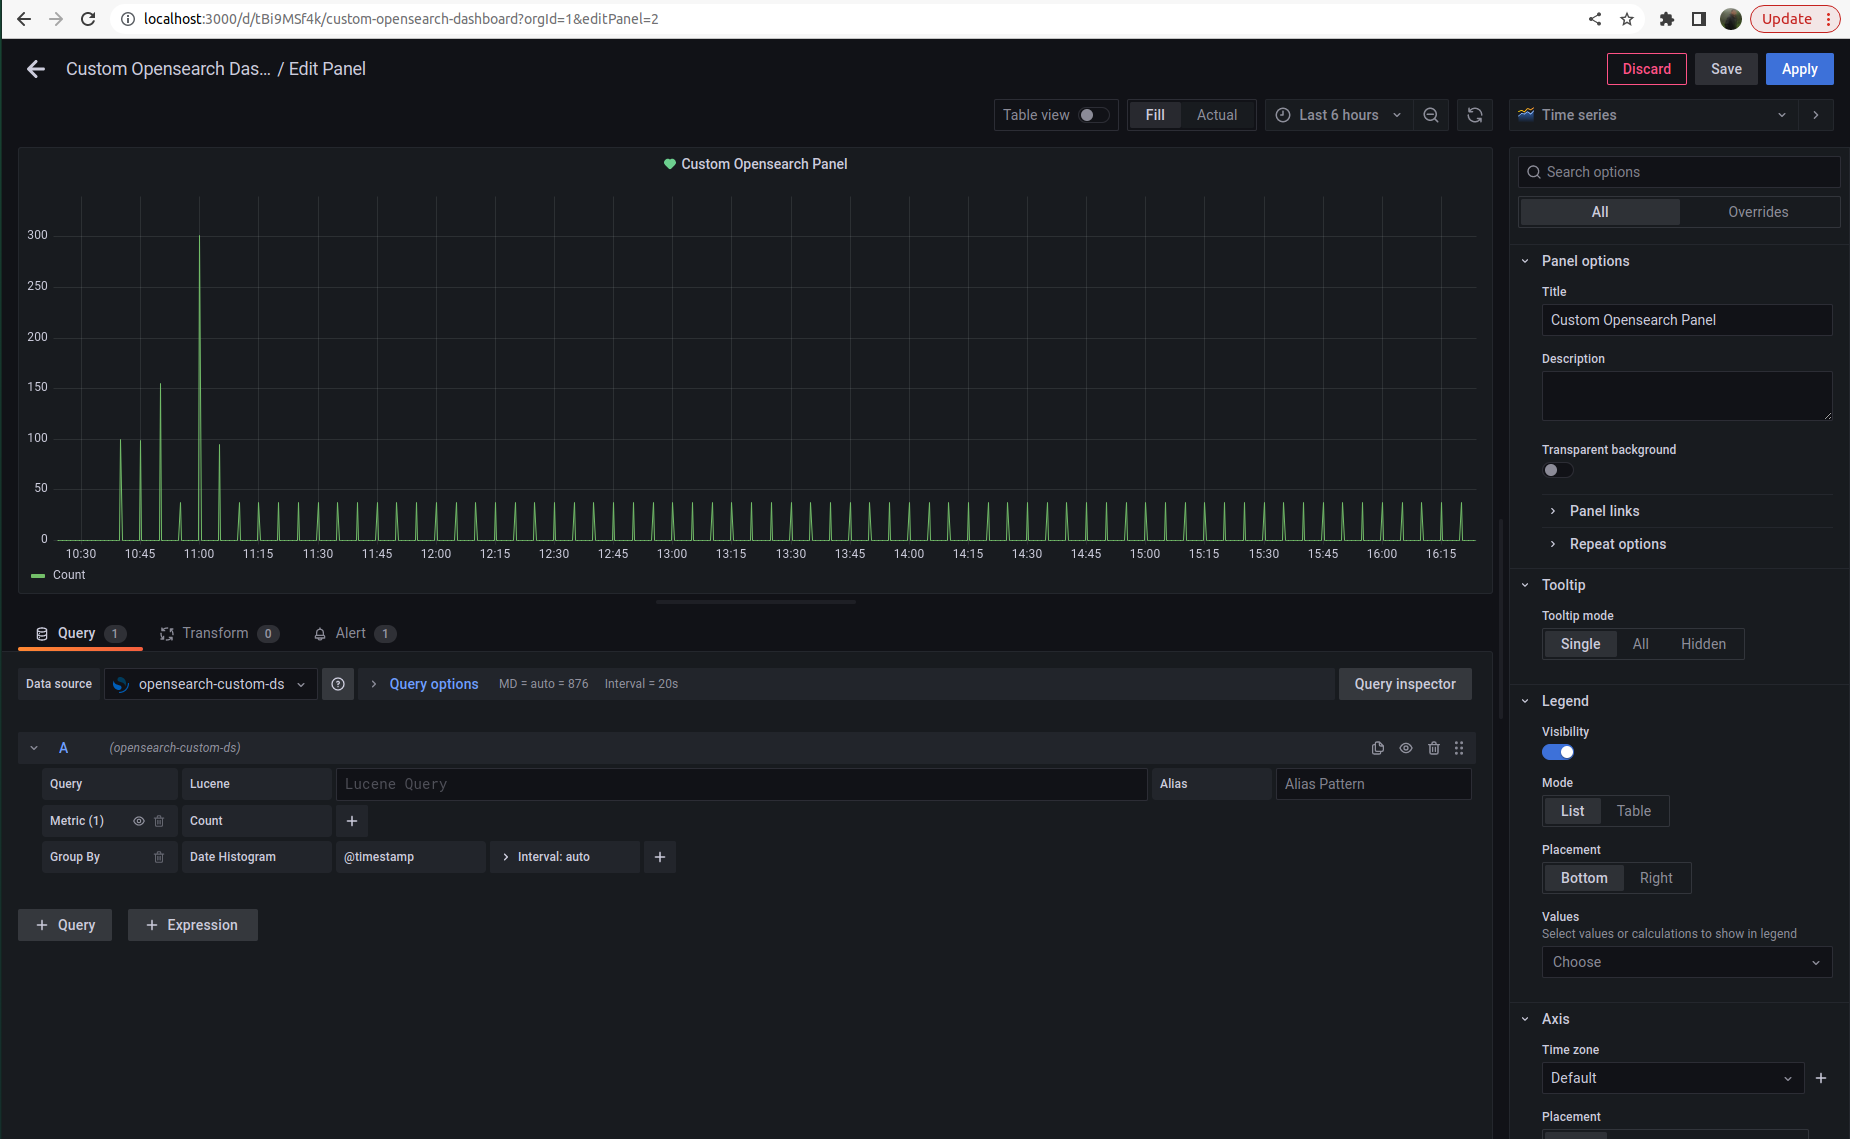
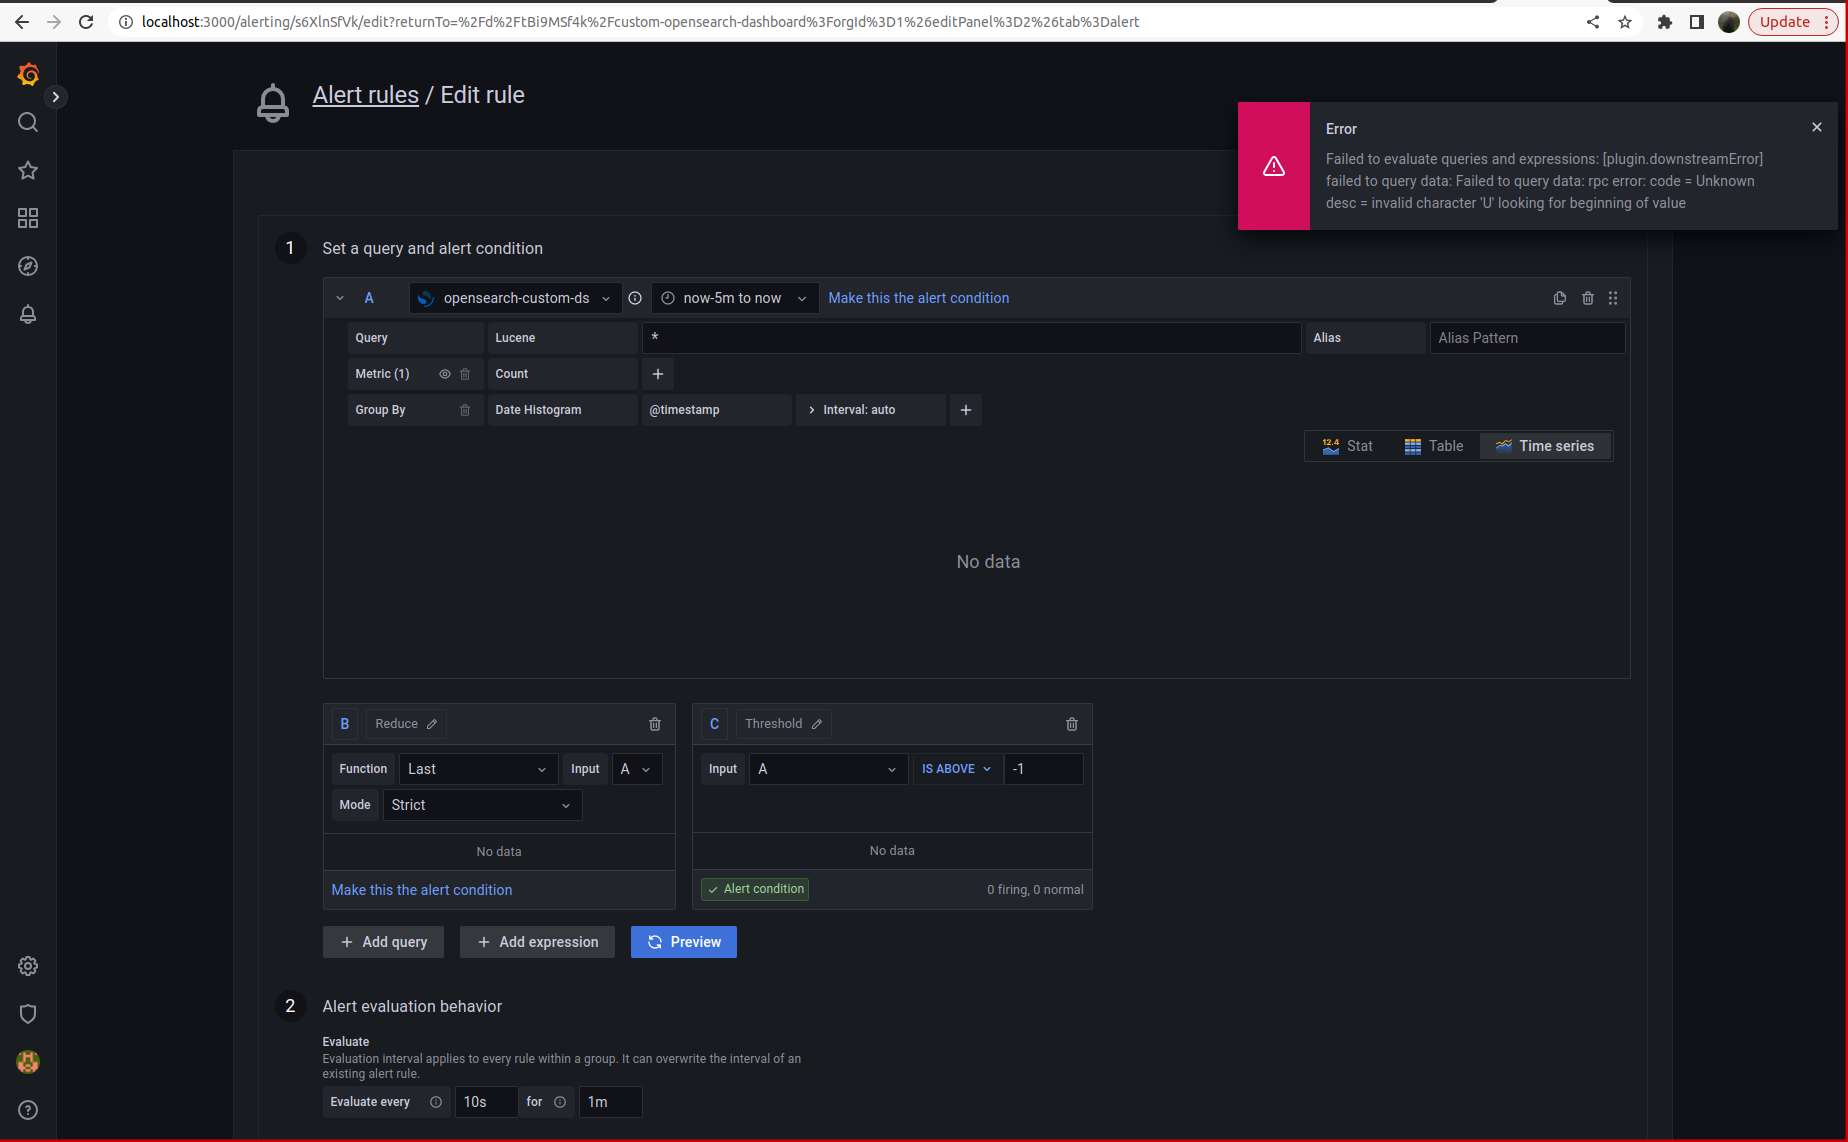
When testing an alert created using Opensearch as datasource for a dashboard panel, we get an error that occurs while testing the alert rule that is configured:
tsdb.HandleRequest() error rpc error: code = Unknown desc = invalid character 'U' looking for beginning of value
We have configured the Opensearch datasource used in Grafana as below.
datasources:
- name: opensearch-ds
type: grafana-opensearch-datasource
version: 2
access: proxy
orgId: 1
url: {{ .Values.opensearch.url }}
jsonData:
interval: Daily
timeField: "@timestamp"
timeInterval: "10m"
tlsAuth: true
tlsAuthWithCACert: true
database: "[opensearch-ds-]YYYY.MM.DD"
version: "1.0.0"
tlsSkipVerify: true
secureJsonData:
tlsCACert: $ENV_VAR_1
tlsClientCert: $ENV_VAR_2
tlsClientKey: $ENV_VAR_3
Please help us in getting this issue fixed at the earliest.
Grafana version: 7.5.17
Opensearch Datasource Plugin version: 1.1.2
Opensearch version: 2.4.1
Note: The alert does not work and it fails with same error even with the latest Grafana version 9.3.6 and the latest Opensearch datasource plugin version 2.0.5.
Please note although that we want the fix for the older version of Grafana (v7.5.17) and Opensearch datasource plugin (v1.1.2) as mentioned above in the issue description.
The text was updated successfully, but these errors were encountered: