Using alerts on panel not working #78
Comments
|
Hello @janisbiz. To help us investigate, could you please provide panel/dashboard JSON and query from query inspector. |
|
@ivanahuckova I can provide it only with obscured values (pretty much anything defined in storage, like variable names, sources e.t.c. will not be readable) due to my company policy. If that's fine, let me know. |
|
Yes it is absolutely fine! Thank you. |
|
@ivanahuckova here you go: |
|
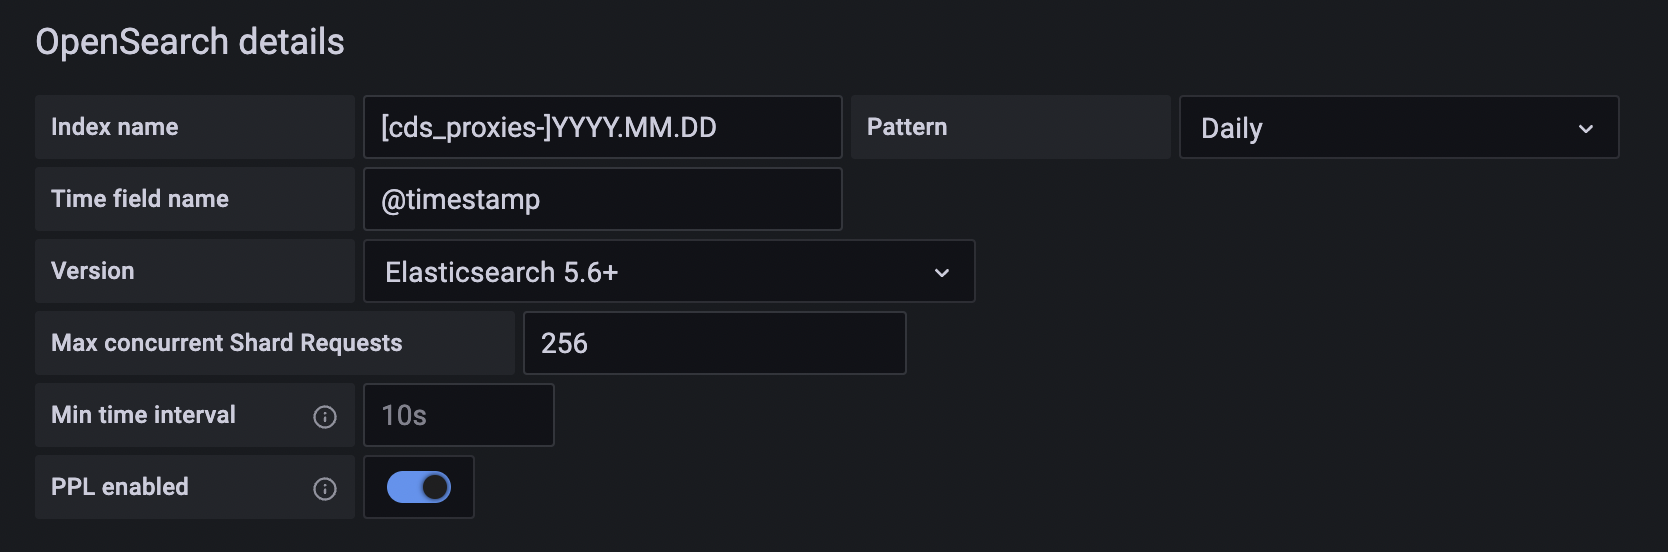
I too am experiencing this issue. I am using grafana OSS 9.1.8, but see the same in 9.2.2 with the opensearch plugin version 2.0.3. It appears from my grafana container logs that the alert queries are not respecting some of the values configured in the datasource. I expect see the index of [cds_proxies-]YYYY.MM.DD being used as it is configured in the datasource. but when I check the logs after running the queries from the Alerts tab I see that it is attempting to use a different index Output in grafana logs: These values from the datasource appear to be respected when I simply create a new panel for viewing only purposes. |

|
I'll add that the index it has chosen to use is not one that I even appear to have when I check all my indices configured in Kibana. It would appear that index is being determined by something else either in Grafana or in the plugin itself. |
|
Thanks @maxwellvarner. I see that you are using the datasource to query an ElasticSearch. Could you provide the exact version of that ElasticSearch? @janisbiz Are you using the datasource to query ElasticSearch as well, or any other database? Would be great to get that version too. Thanks! |
|
Sorry for the next ping. I discovered a root cause and will get a fix out. |
|
I've attempted this against 2 different versions of Elasticsearch; versions 6.8.23 and 7.9 I got this information by running |
|
@svennergr not sure if it is still relevant, I am using OpenSearch |
|
@janisbiz @maxwellvarner OpenSearch v1.2.4 and OpenSearch v2.0.4 have been released with a fix of this issue. |
|
@svennergr just updated. The previous error is gone, but alerts are still not working. It seems like datasets are always returning @maxwellvarner please let us know how it is for you. |
|
@janisbiz tested in Grafana 8.5.13 and it was working for me: |
|
@svennergr this is what I cam having for alert - with If I change to count - it is all good. Thus not sure why 🤔 I guess sum is not summing actual metric value maybe. Getting: |

|
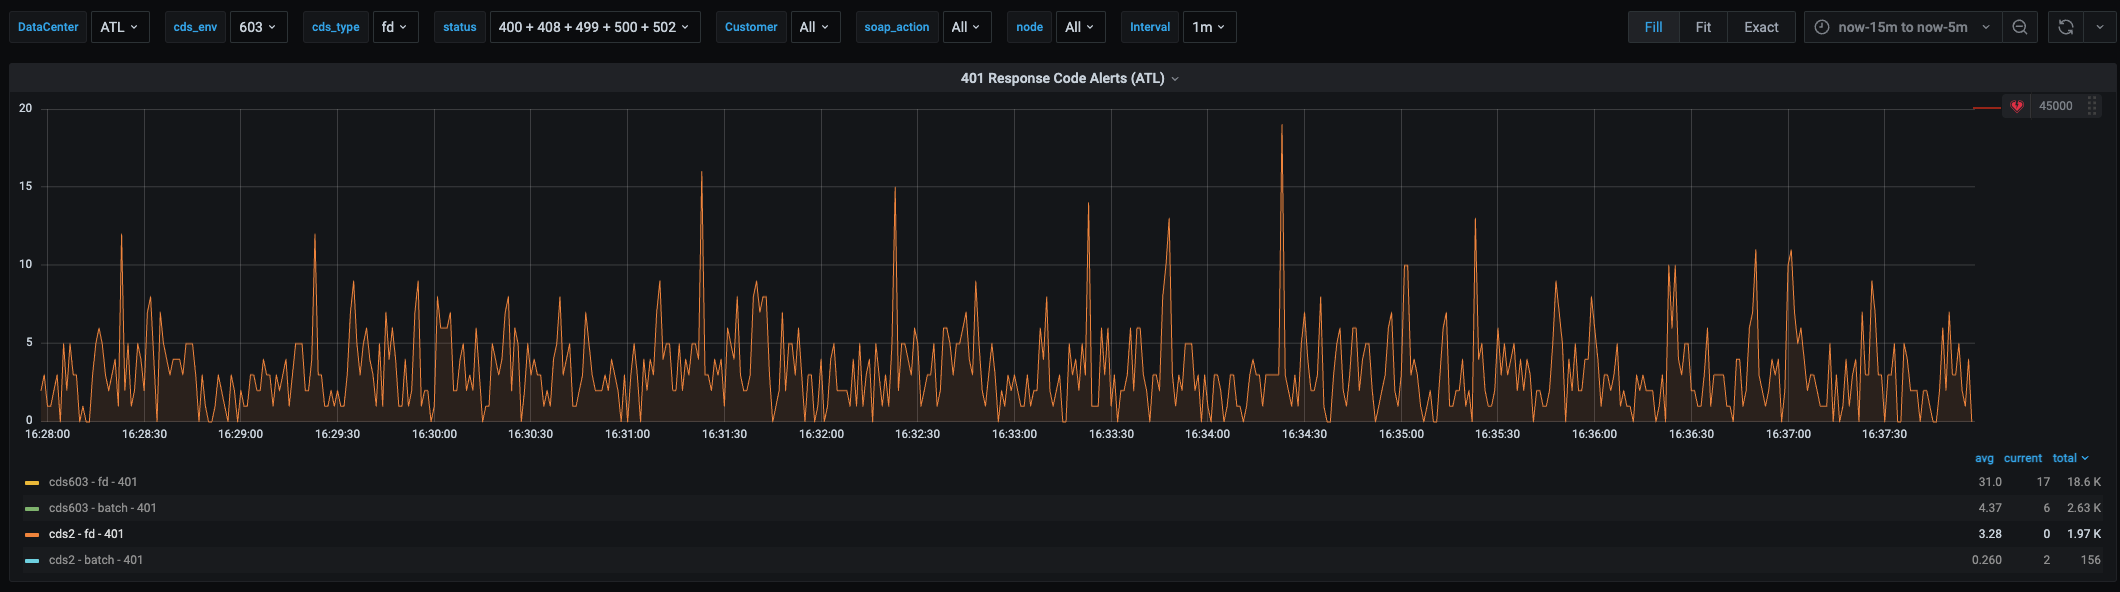
This appears to be working for me against both versions of elasticsearch mentioned above running grafana v9.1.8. sum() appears to be returning the correct value for me. If I'm understanding what count() is going to return then that would be the number of records returned by the query; whereas sum() will total up all the counts returned for each row based on your grouping. In the example below where you see the reduce expressions; it is showing that I returned 601 rows (grouped records) and the varying count in each of those rows totaled up by the sum() function is 1997. Sum being what I want as that indicates to me I have had 1997 individual requests return a 401 status code for that environment and type in a 10 min window. I don't let it try and pull stats up to now and instead use now-5m to ensure that I don't query for records that have not made there way to elasticsearch yet from my logstash cluster. Alert Rule - Results Panel Results |

|
@svennergr are you trying with elastic or OS? As I am using OS, it seems to be not working. |
|
So, I re-created panel with same query, same alert (litereally everything the same) and it works now. I guess something was corrupted on my panel. 🤷♂️ Anyway - all good now. Thanks 🎉 |
Hello!
Using alerts on existing panels are not working.
Version(s):
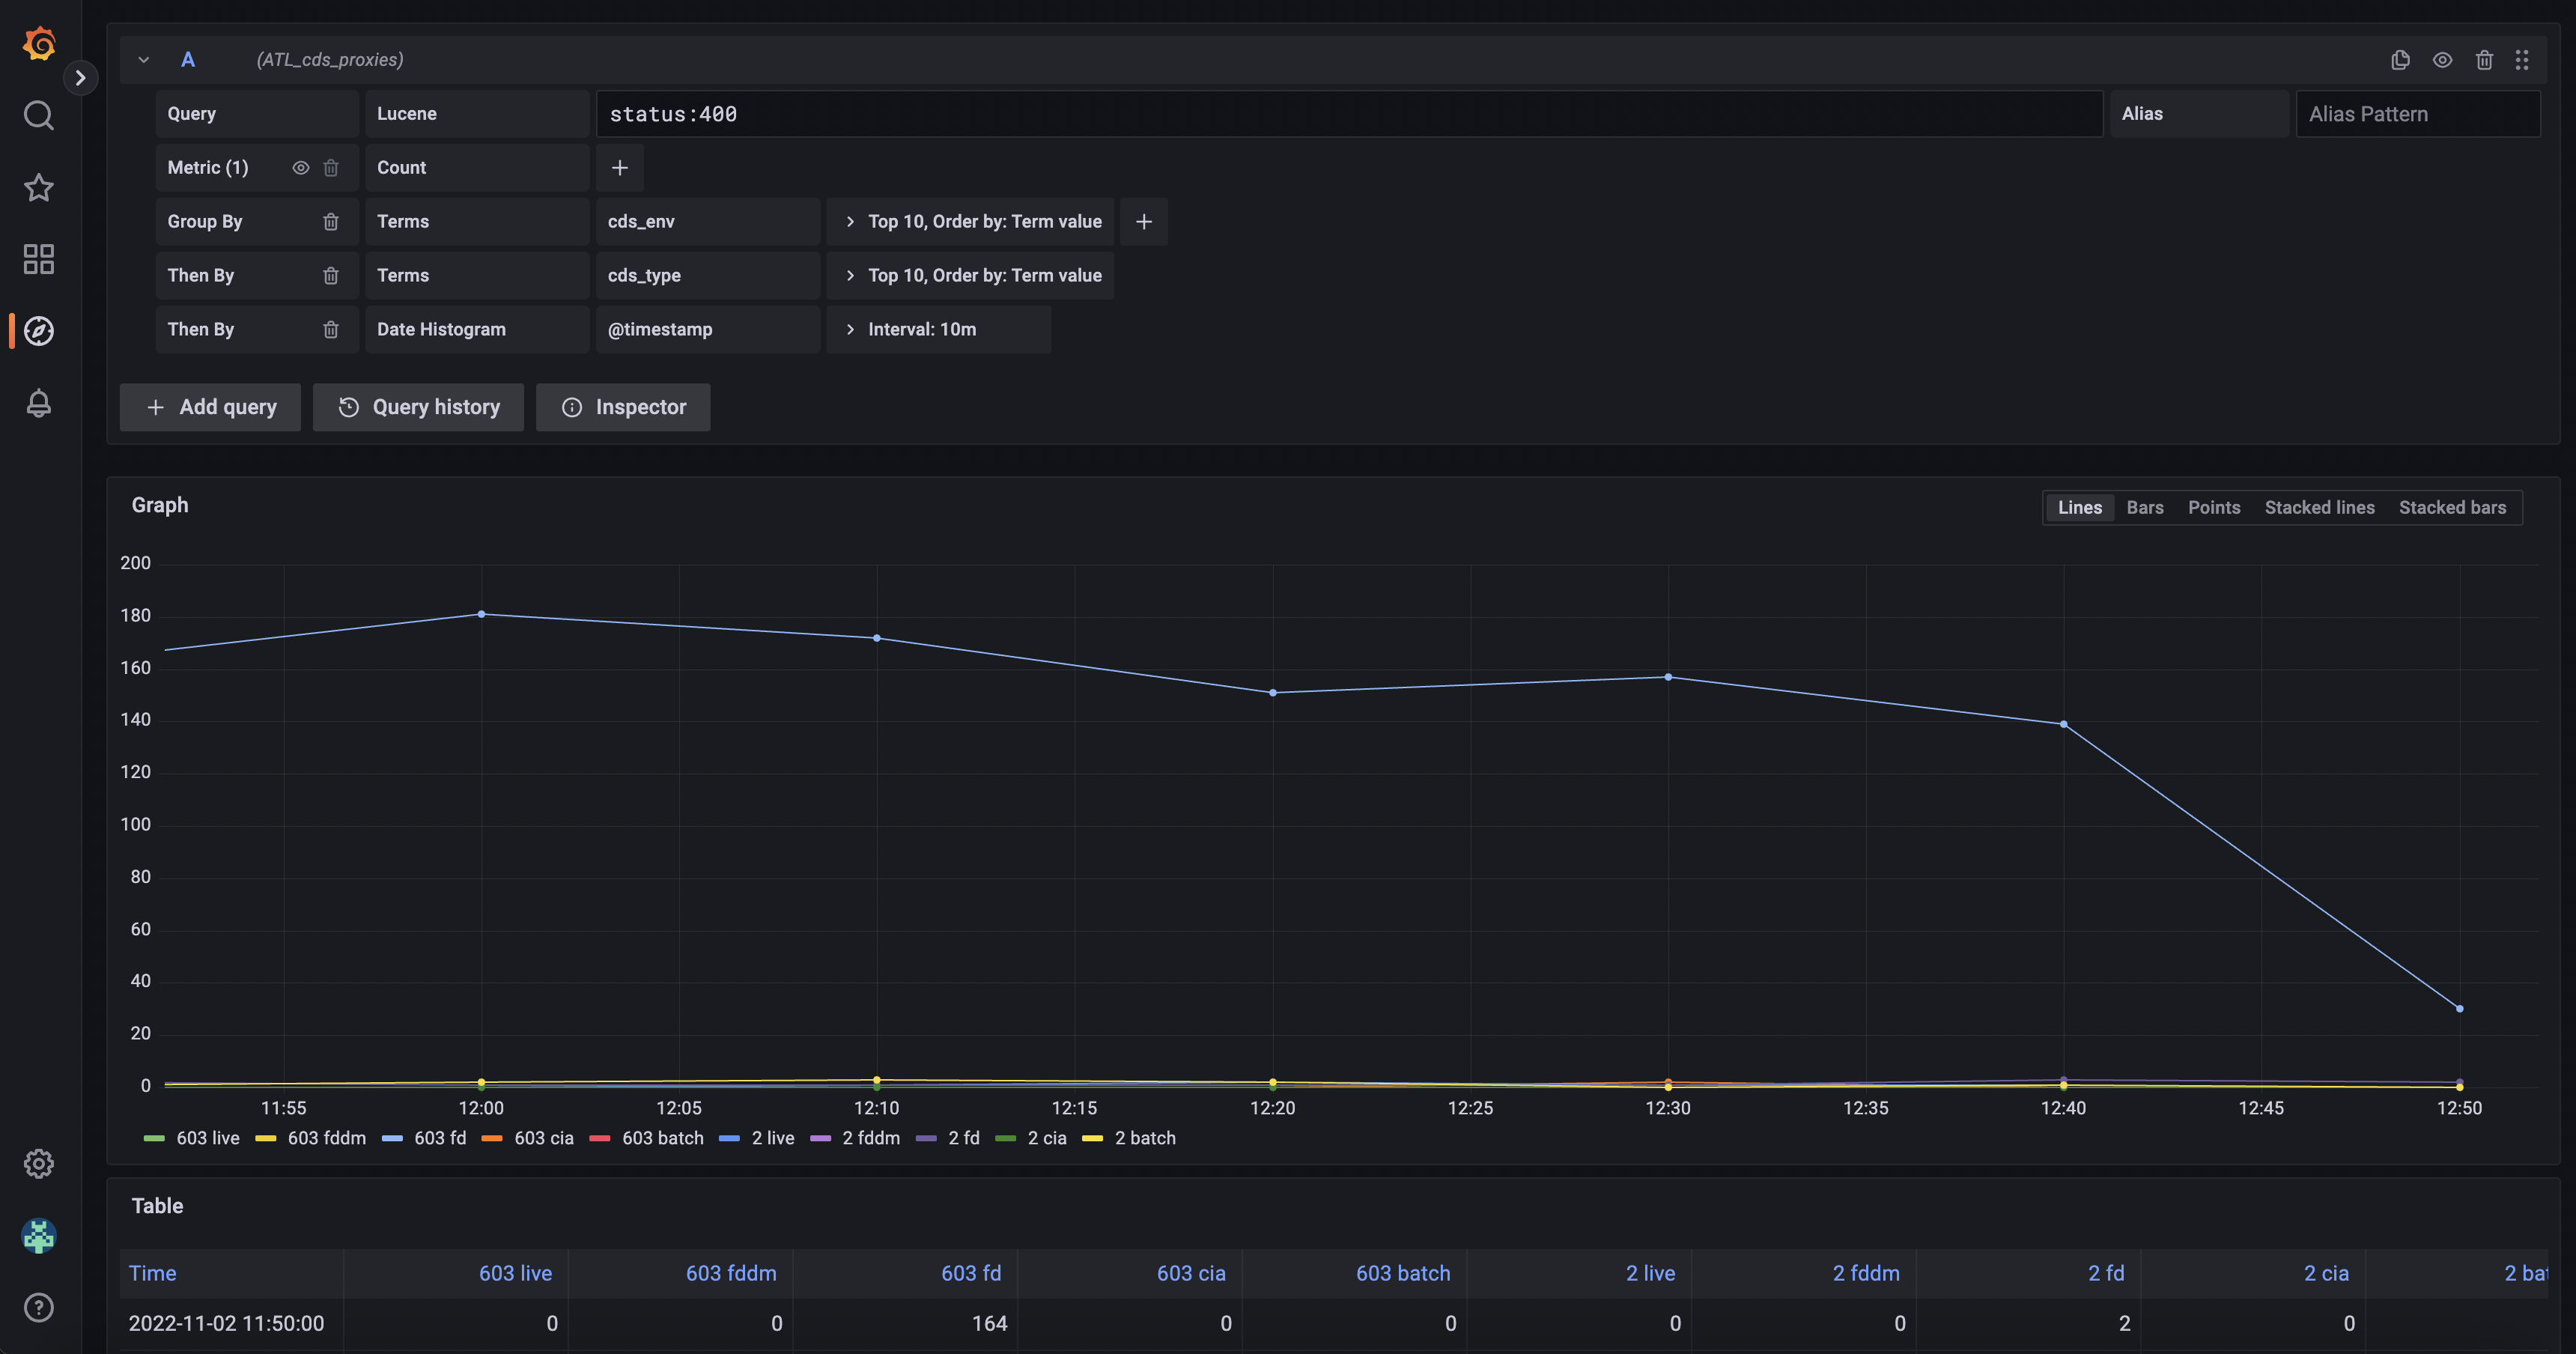
v8.5.13 (38d274060d)1.2.21.3.2Example panel:


Example alert:
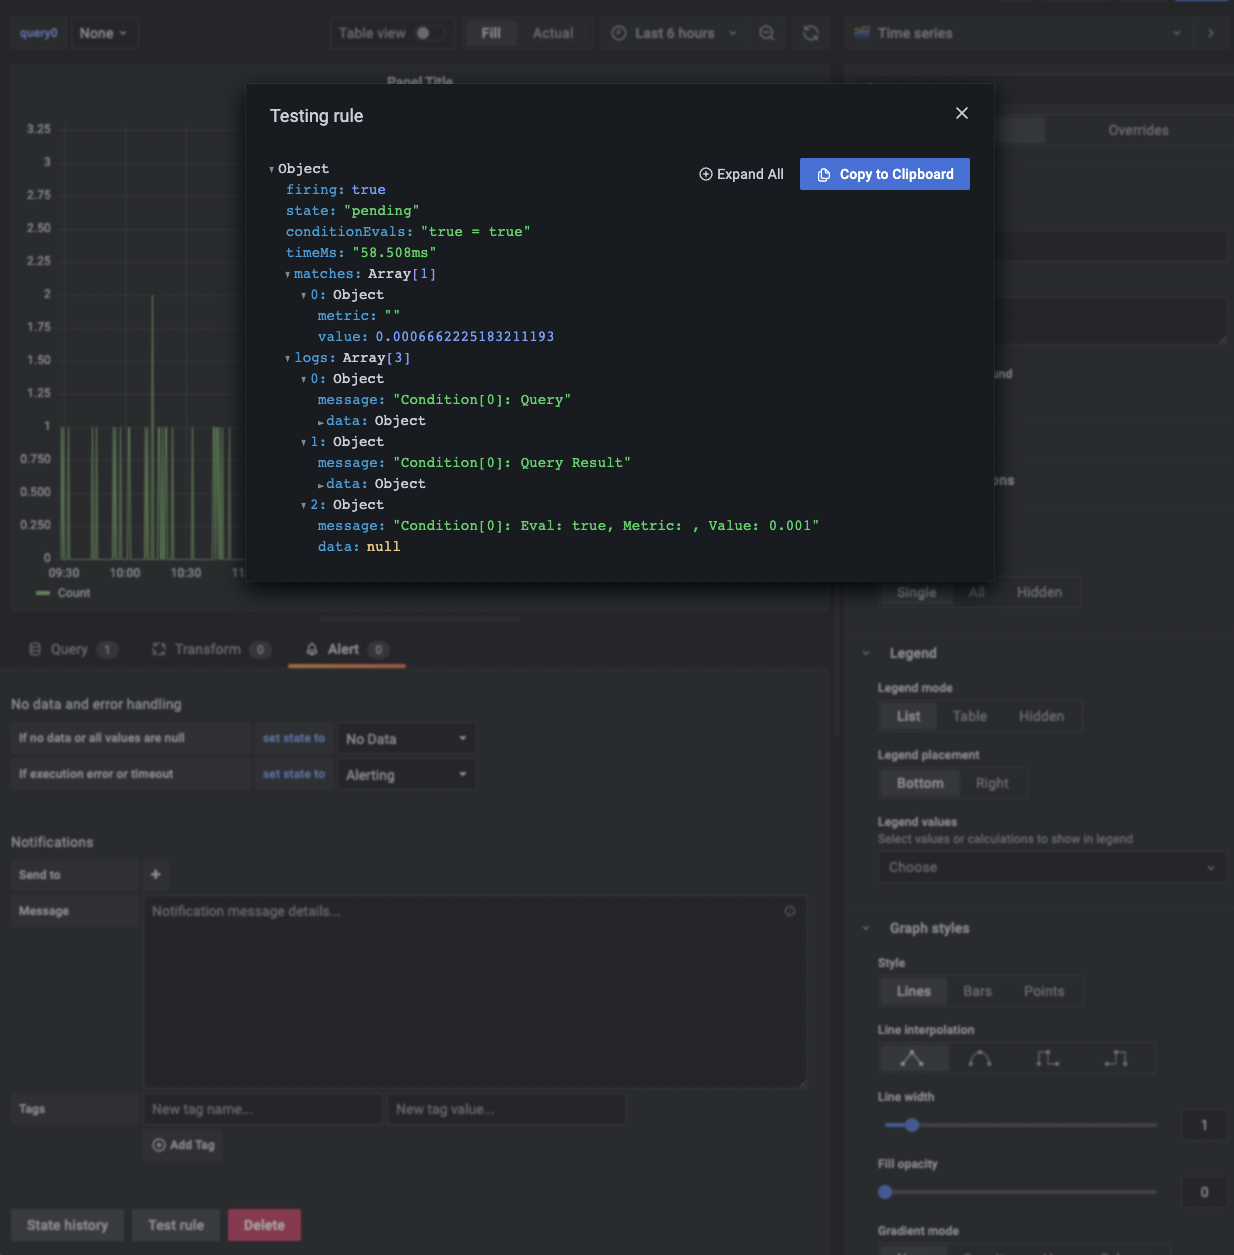
When clicking "Test rule" in "alerts tab" getting:
The text was updated successfully, but these errors were encountered: