How to get data into Graphite using plaintext protocol?[Q] #2642
Comments
|
I think you got a few zeros too much in your date. |
|
@dinBo : in Graphite timestamp is in seconds, not milliseconds or nanoseconds. |
|
@dinBo Have you been able to test with "lower" resolution on your time? export PORT=2003 |
|
This issue has been automatically marked as stale because it has not had recent activity. It will be closed if no further activity occurs. Thank you for your contributions. |
Sign up for free
to join this conversation on GitHub.
Already have an account?
Sign in to comment
First of all, I’m new to Graphite, so sorry if this question has an obvious answer that I’m somehow missing.
So, I’ve set up Graphite and Grafana via Docker using the following instructions (The “Up and running in (almost) 5 minutes“ section): https://www.sitespeed.io/documentation/sitespeed.io/performance-dashboard/. I’m using these instructions because I’ll be using both metrics gained from sitespeed.io and from a custom Node.js script.
I’m trying to send the data from Node.js script to Graphite using plaintext protocol (https://graphite.readthedocs.io/en/latest/feeding-carbon.html#the-plaintext-protocol). I’ve used the ’net’ library (https://nodejs.org/api/net.html) to send the data via TCP:
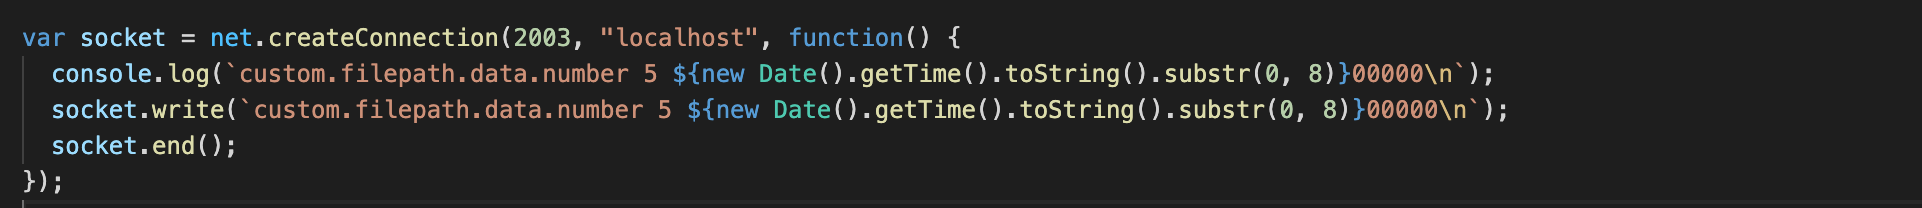
When I run the script, this is what is logged:

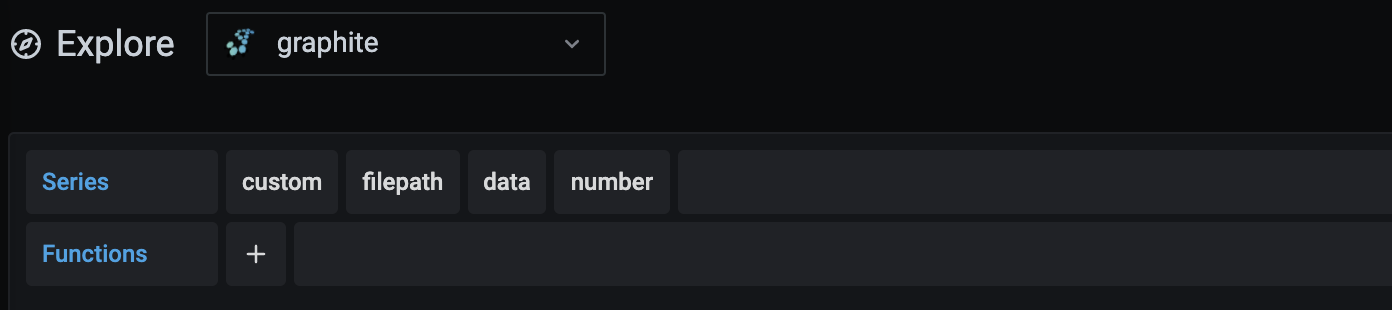
And also, I’m able to access it in grafana:
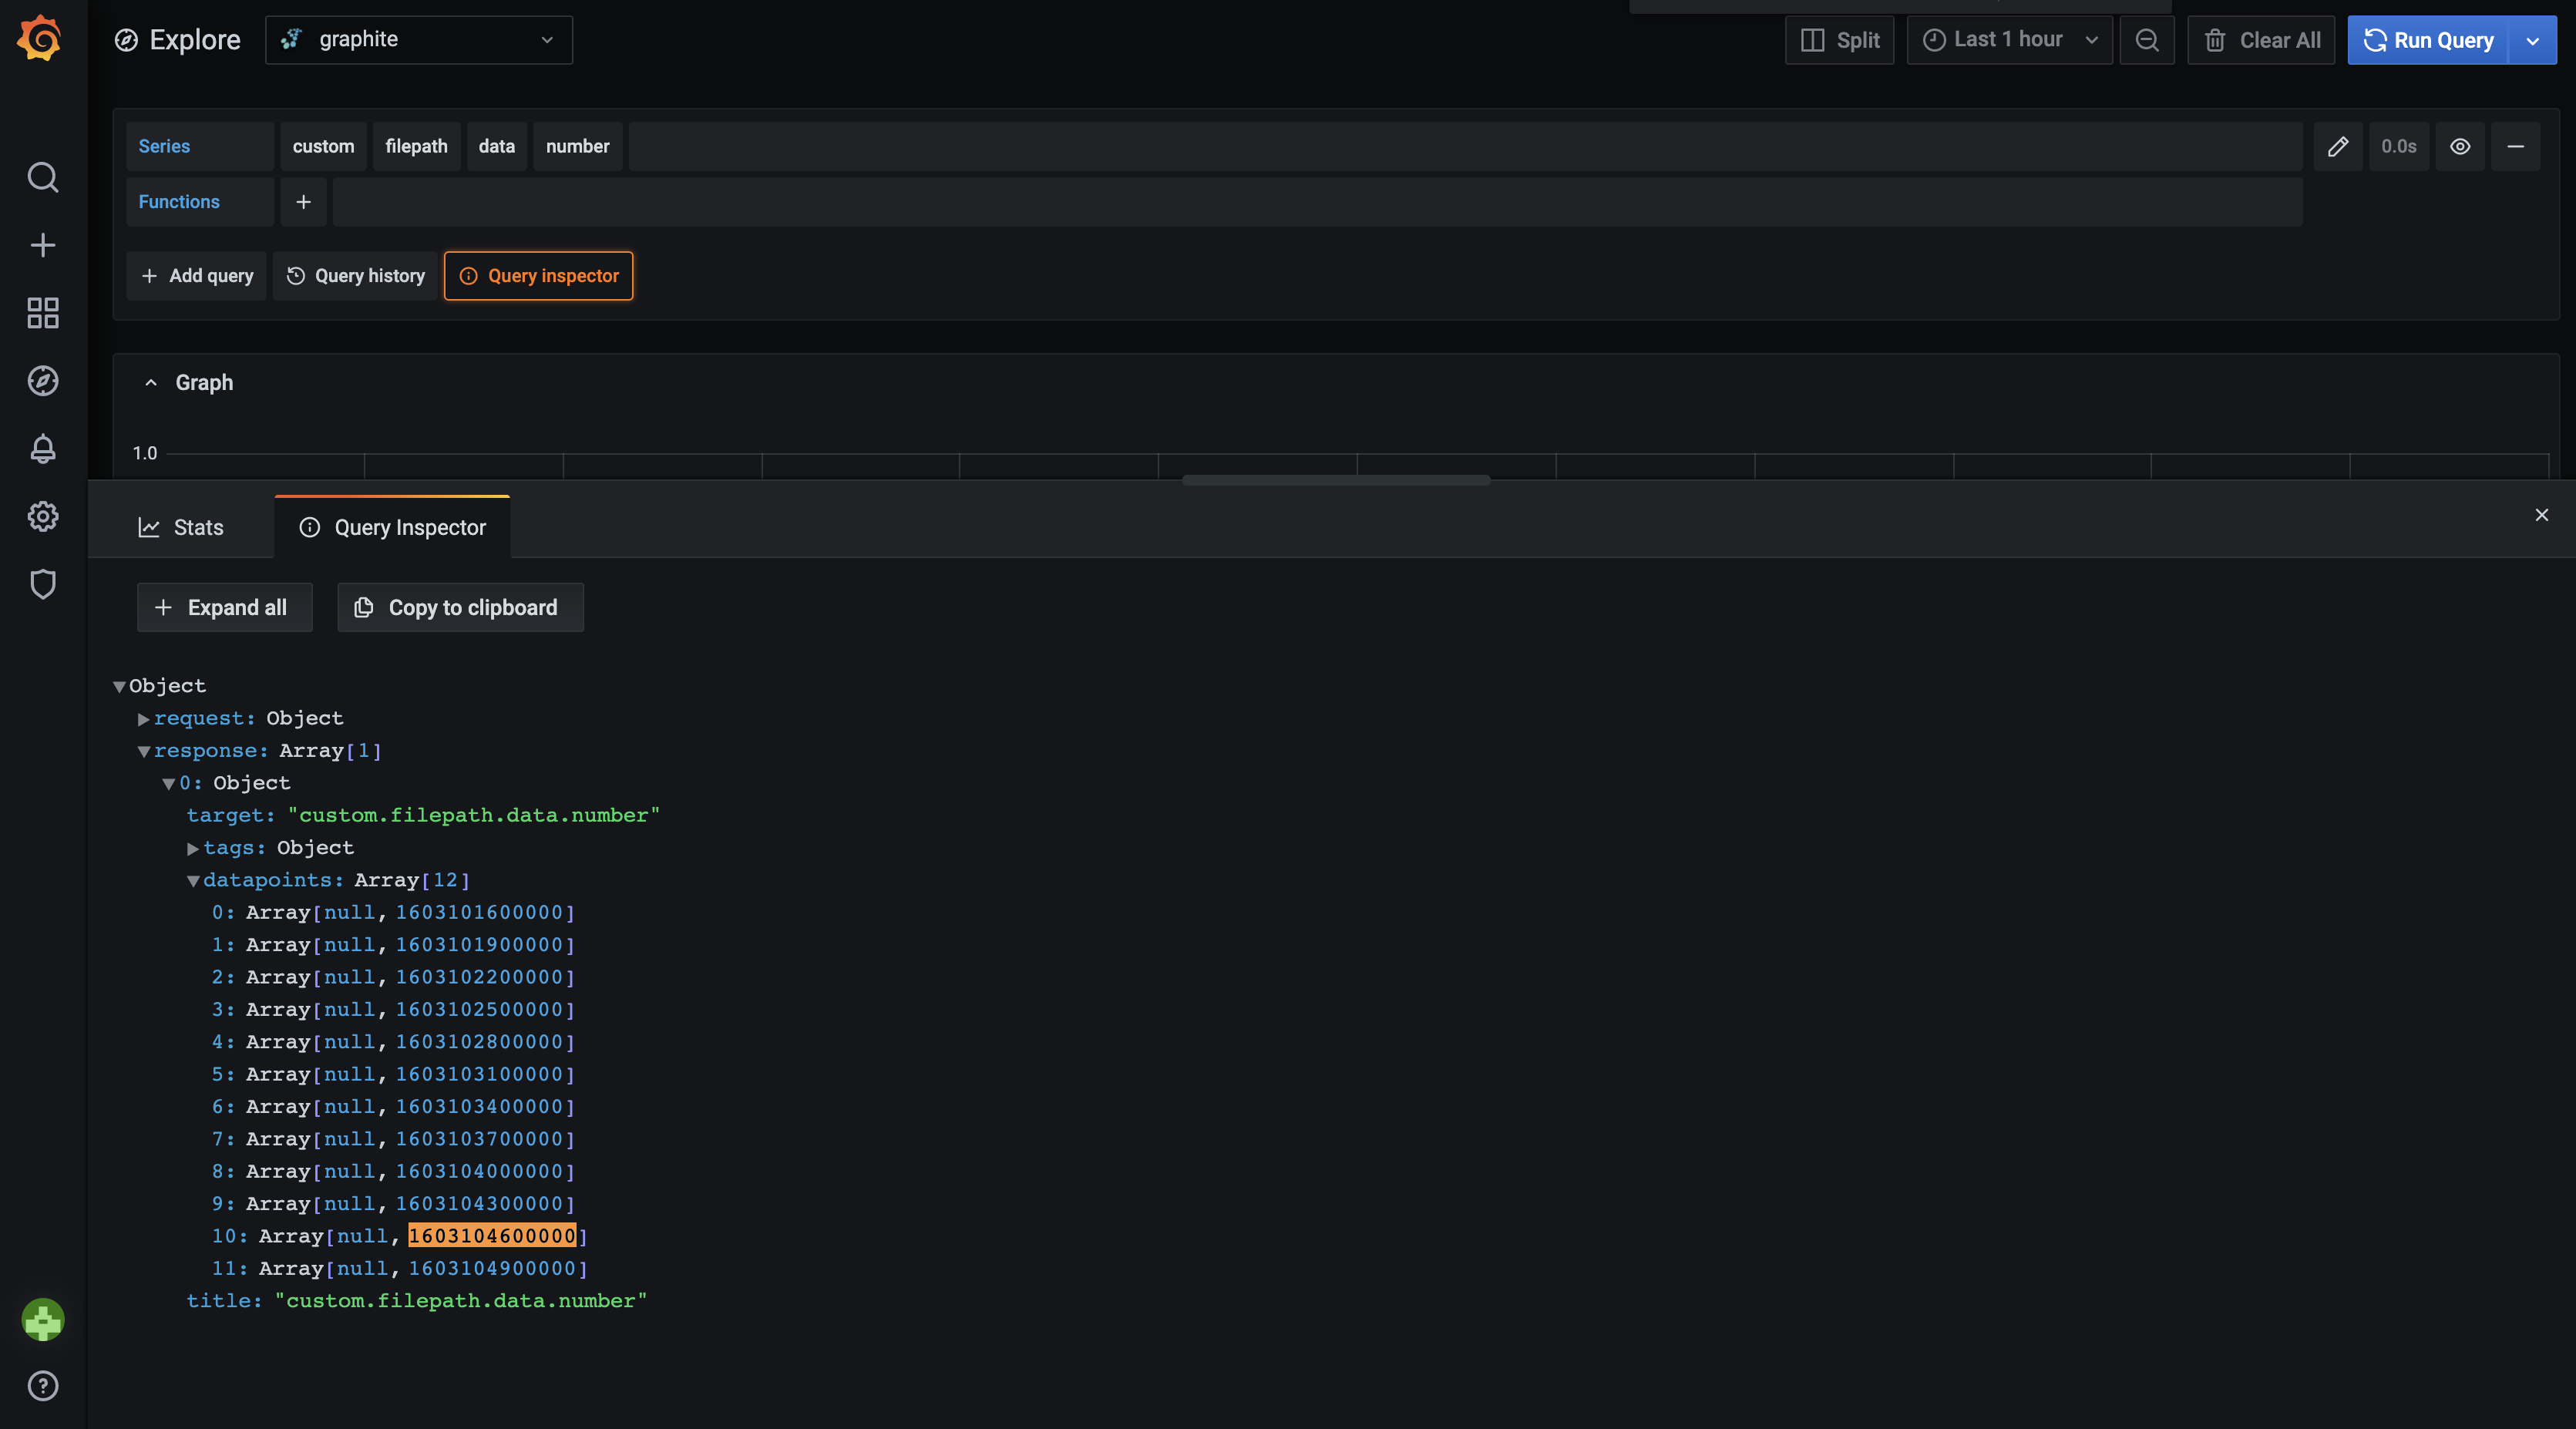
The problem is that I’m not able to see the data value in Grafana, even when I explicitly give it the timestamp, it’s like it doesn’t reach it. Here’s the example for timestamp 1603104600000 (Date and time for GMT+2 zone: 2020-10-19 12:50:00 AM):

It’s not shown in the graph or table in Explore tab (look at the last entry in table):

And in Query inspector it says it’s null for the given timestamp:
How can I get the data into graphite using plaintext protocol? Am I missing to add something when sending data to Graphite?
Thanks,
Bodin
The text was updated successfully, but these errors were encountered: