Large number of PoolThreadCache garbage objects #5671
Comments
|
I did some logging for the pool arenas in PooledByteBufAllocator.DEFAULT instance. It seems like there are lots of thread pool caches being generated and then they are GC'ed. Before GC After GC |
|
As an experiment, try setting This may be related to #4317. |
|
@ejona86 Thanks for the parameter. It significantly reduces the GC pressure. The total GC time reduced from ~3min to 37 secs. There are still lots of thread caches getting associated to every pool. I could see 773 thread caches in every pool which after GC went down to 109. While building a netty server I am currently using separate executors for RPC processing and worker event group. Which threads would these thread caches be associated to? |
|
@lokeshj1703, with that paramater, Netty would still create a cache for every eventLoop thread. By default Netty creates (2 x cores) threads. So if you are creating two You may be interested in the other "system property" mentioned in https://netty.io/4.1/api/io/netty/buffer/PooledByteBufAllocator.html . Documentation is a bit terse. There's a few more comments sprinkled in the code. Remember to prefix them with |
|
When re-reading " While building a netty server I am currently using separate executors for RPC processing and worker event group." it now seems obvious what you meant. Only the worker event group would count there. If you use any ManagedChannels, then they could have their own event loop (we have a default one we use if you don't provide one). The biggest question to determine if the 109 number makes sense is how many cores you have. |
|
@ejona86 Thanks a lot for the information! |
|
4 direct memory arenas... I'd expect two arenas from PooledByteBufAllocator.DEFAULT: one for direct memory and one for heap memory. I'd only expect more if there were more shaded/unshaded copies of Netty in your classpath (under a different package from org.apache.ratis.thirdparty.io.netty). Or if someone else is using Netty and calling How long-lived are the ManagedChannels? When there are no usages of our default event loops, we release them after 1 second. If there is at least one ManagedChannel alive at all times, then those threads wouldn't be re-created. It looks like Ratis's Given you have set I poked at Ratis. I'm sort of amazed. They properly are shaded gRPC (at least) because they were using unstable APIs. Props to them. |
|
In our case the default number of arenas turn out to be correct. NettyRuntime.availableProcessors() = 2, runtime.maxMemory() = 4096 * 1048576 and defaultChunkSize=16 * 1048576. Therefore number of heap arenas turn out to be 4. Am I missing something? It makes sense that the thread caches should be constant. I'll look into it. Please let me know if you have any pointers for where to start. |
|
@lokeshj1703, you're right. I was thinking a different concept was the arena. I would start by looking at Netty thread creation/death, since that can be pretty easy to notice with just two thread dumps. I am pretty sure the Netty threads will by default all have unique names. That won't be true when someone specifies a ThreadFactory that chooses its own name, though. |
|
We are also affected by this memory leak large amounts of io.netty.util.internal.shaded.org.jctools.queues.MpscArrayQueue.buffer objects. Upto 30% of the heap |
|
netty/netty@94d7557 |
|
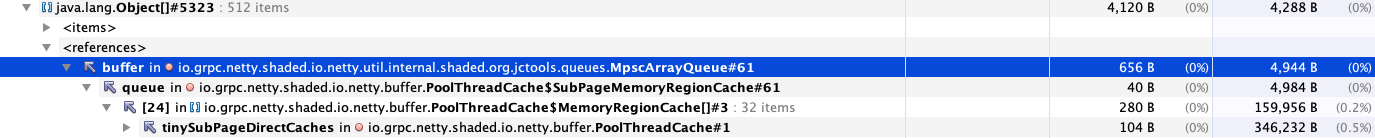
@ejona86 Hi. I wonder if you could help me out with some related (?) problem that I've encountered. Maybe I can try to use: |
|
@yosezky, if I'm reading that right, then "32-512 items" and "350 KB" would not be "a lot of objects" for most people. I don't see any obvious problem demonstrated in your screenshot. |
|
@ejona86 Thanks for your reply!! |

Hello, is there any process to solve this problem? |
|
I have the same issue. P.S. setting system property |
|
why?I have the same issue |

What is the side effect? Will the competition become more intense during direct bytebuffer allocation? Why don't we allocate direct byte buffers in the event loop thread like Lettuce does? |
We are using grpc-java version 1.16.0 in Apache Ratis for RPC communication. Apache Ratis is a java implementation of Raft consensus protocol and uses grpc for server-server and client-server communication. In the scenario there are ~10KB requests coming from the client to the server and the server is replicating those requests to other servers. There are thousands of these requests coming gradually to the server from the client. There are other small sized metadata related communications as well.
We are currently seeing a lot of GCs getting triggered and lot of garbage PoolThreadCache objects. Here is a snippet of the major unreachable heap objects.
It seems like there is lot of garbage being generated via thread caches.
The text was updated successfully, but these errors were encountered: