Add LowerBound and UpperBound options #12
Conversation
Pull Request Test Coverage Report for Build 42
💛 - Coveralls |
1 similar comment
Pull Request Test Coverage Report for Build 42
💛 - Coveralls |
Pull Request Test Coverage Report for Build 5349798357
💛 - Coveralls |
|
I've been using this fork myself recently and can attest to its robustness. Let's get this baby merged! |
|
Hi, @carlosms thanks for the PR These options are definitely needed, here I'm little skeptical about the name of the options. They actually mean 👋 @jesseduffield would like to have your views on this. Naming is hard! Jeff Atwood's tweet 😄 |
|
@guptarohit I'm not sure why MinLower and MinUpper are more correct. Do you mean MaxUpper? What about LowerBound and UpperBound:
Although technically that's referring to data points on the graph.. damn. This is tricky because as the end-user, the names which are most intuitive are coincidentally names that don't map well onto the actual terminology. What about WindowMax and WindowMin? |
|
@jesseduffield if I understand correctly these options ensure the minimum lower bound of the graph (therefore MinLower) & minimum upper bound of the graph(therefore MinUpper),
Whereas, |
|
@guptarohit I'm not quite sure what you mean. Do you want to use MinLower and MaxUpper or MinLower and MinUpper? These comments don't seem to be cohesive:
At any rate, I'm find with MinLower and MaxUpper |
|
hi @jesseduffield, I actually meant MinLower and MinUpper (edited my comment now, please check) |
|
@guptarohit I am still a little confused. Lets say that we're using this PR's terminology, and I set Min to 0 and Max to 10, but then my data set ranges from -10 to 20. The lowest value on the graph will be 0 and the highest value will be 10. I'm not sure why the Max would be better named MinUpper in that case |
|
@jesseduffield I'm afraid it won't be like that as per this PR, please check the test case #16 or check the O/P by following example: data := []float64{-2, 1, 11, 2, -10, 5, 7, 11, -9, -4, -1, 5, 13, -2}
asciigraph.Plot(data, asciigraph.Min(0), asciigraph.Max(10)) 15.00 ┤ ╭╮
14.00 ┤ ││
13.00 ┤ ││ ╭╮
12.00 ┤ ││ ││
11.00 ┤ ╭╮ ╭╯│ ││
10.00 ┤ ││ │ │ ││
9.00 ┤ ││ │ │ ││
8.00 ┤ ││ │ │ ││
7.00 ┤ ││ ╭╯ │ ││
6.00 ┤ ││ │ │ ││
5.00 ┼ ││ ╭╯ │ ╭╯│
4.00 ┤ ││ │ │ │ │
3.00 ┤ ││ │ │ │ │
2.00 ┤ │╰╮│ │ │ │
1.00 ┤╭╯ ││ │ │ │
0.00 ┤│ ││ │ │ │
-1.00 ┤│ ││ │╭╯ │
-2.00 ┼╯ ││ ││ ╰
-3.00 ┤ ││ ││
-4.00 ┤ ││ ││
-5.00 ┤ ││ ││
-6.00 ┤ ││ ││
-7.00 ┤ ││ ││
-8.00 ┤ ││ ││
-9.00 ┤ ││ ╰╯
-10.00 ┤ ╰╯
|
|
That's strange, I'm not really sure whether Min or Max are having any effect at all there. I would have expected it to have a max y-axis value of 10, and a min of 0. @carlosms is the above example an expected output? |
|
Any progress on this? |
228c545
to
5deec54
Compare
f0b23df
to
9f3ce84
Compare
|
Updated options names to |
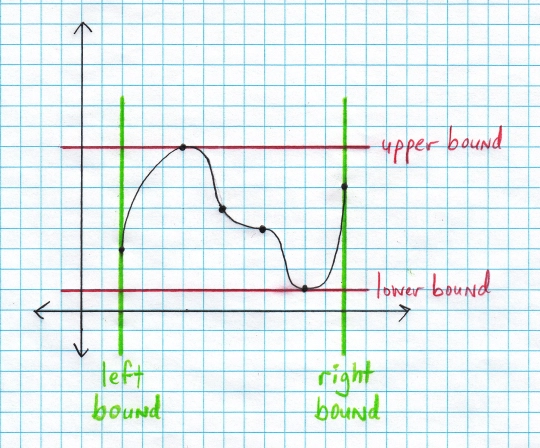
This PR adds a couple of options to set the
minandmaxvalues of the Y axis.I needed them for a personal project and figured it might be useful to other people.
Update: options name updated to
LowerBoundandUpperBound