A fork from https://github.com/doublemarket/grafana-rrd-server wich is made for use with Observium
Simply give it the path to observium rrds and add it to grafana the query to do is like this : "/"
Example:
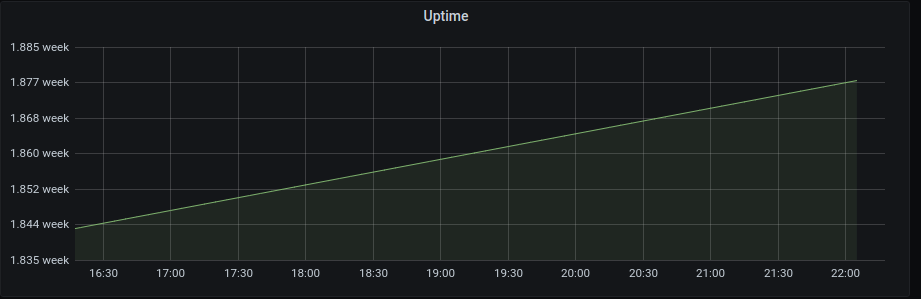
localhost/uptime
will give
[
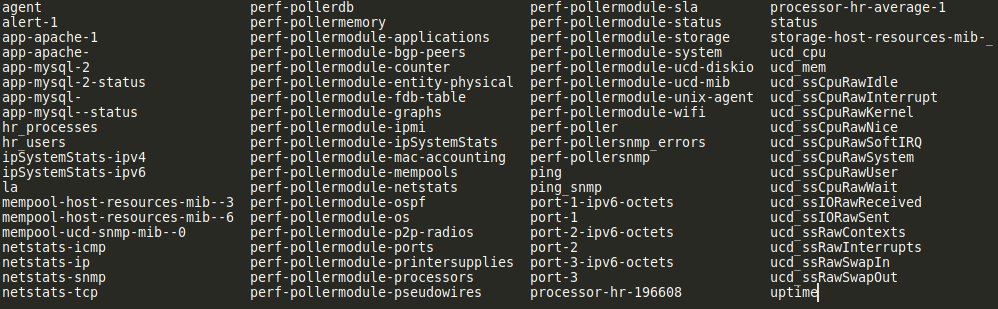
You can list rrds for a specific host with ls <grafana_path>/rrd/
The commons are :
[
A simple HTTP server that reads RRD files and responds to requests from Grafana with Grafana Simple JSON Datasource plugin.


This server supports all endpoints (urls) defined in the Grafana Simple JSON Datasource plugin documentation but:
- You can use
*as a wildcard in thetargetvalues (but not fords) for the/queryendpoint.
- librrd-dev (rrdtool)
- Go
- Grafana 3.0 and newer + Simple JSON Datasource plugin 1.0.0 and newer
-
Install librrd-dev (rrdtool).
On Ubuntu/Debian:
sudo apt install librrd-devOn CentOS:
sudo yum install rrdtool-develOn openSUSE
sudo zypper in rrdtool-develOn Mac:
brew install rrdtool -
Get the package.
go get github.com/doublemarket/grafana-rrd-serverOtherwise, download the latest release, gunzip it, and put the file in a directory included in
$PATH:gunzip grafana-rrd-server_linux_amd64.gz -
Run the server.
grafana-rrd-serverYou can use the following options:
-h: Shows help messages.-p: Specifies server port. (default: 9000)-i: Specifies server listen address. (default: any)-r: Specifies a directory path keeping RRD files. (default: "./sample/")- The server recursively searches RRD files under the directory and returns a list of them for the
/searchendpoint.
- The server recursively searches RRD files under the directory and returns a list of them for the
-a: Specifies the annotations file. It should be a CSV file which has a title line at the top like the sample file.-s: Default graph step in second. (default: 10)- You can see the step for your RRD file using:
$ rrdtool info [rrd file] | grep step
step = 300
- You can see the step for your RRD file using:
-
Setup Grafana and Simple JSON Datastore plugin.
-
Create datasource.
-
Install librrd-dev (rrdtool).
See the Usage section.
-
Clone the repository.
-
Commit your code on a separate branch.
-
Create a pull request.
MIT