Last Update: 2022
- 2018
- neutral theory 中立説
- adaptation 適応
- amelioration
- abduction
- allele 対立遺伝子
- ancestral reconstruction 祖先推定
- basal
- concerted evolution 協調進化
- convergent 収斂進化
- concordance
- divergence time 分岐時間
- effective population size 集団の有効な大きさ
- homology ホモログ、オーソログ、パラログ
- homoplasy
- overall similarity 全体的類似度
- phylogenetic diversity
- recombination 組換え
- Newick
- species
- taxon
- treedist
- dNdS 適応
- RELL
- selective inference
- taxon sampling
- revisionterm
- branch length 枝長
- LBA 長枝誘引
- partition
- microbe 微生物
- constraint 制約
- duplication 遺伝子重複
- togetter
- outgroup
- root
- clade 分岐群、単系統群
- unclassified
- pcm phylogenetic comparative methods
- brownian ブラウン運動モデル
- tree
- marker
- taxon_sampling タクソンサンプリング
- model
- substitution matrix 置換行列
- HGT 遺伝子水平伝播
- rate_of_evolution 進化速度
- mutation 変異
- saturation 飽和
Substitution saturation 飽和 transition/transversion
https://www.ncbi.nlm.nih.gov/pmc/articles/PMC8388027/ PhyKIT: a broadly applicable UNIX shell toolkit for processing and analyzing phylogenomic data (11)Saturation. Saturation refers to when an MSA contains many sites that have experienced multiple substitutions in individual taxa. Saturation is estimated from the slope of the regression line between patristic distances and pairwise identities. Saturated MSAs have reduced phylogenetic information and can result in issues of long branch attraction (Lake, 1991; Philippe et al., 2011).
https://jlsteenwyk.com/PhyKIT/tutorials/index.html#saturation Saturation Saturation in a multiple sequence alignments is driven by sites with multiple substitutions and results in the alignment underestimating real genetic distances among taxa. Values of 1 have no saturation and values of 0 are completely saturated by multiple substitutions (Philippe et al. 2011).
https://jlsteenwyk.com/PhyKIT/ Alignment- and tree-based functions Saturation https://jlsteenwyk.com/PhyKIT/usage/index.html#saturation Saturation
Calculate saturation for a given tree and alignment.
Saturation is defined as sequences in multiple sequence alignments that have undergone numerous substitutions such that the distances between taxa are underestimated.
Data with no saturation will have a value of 1. Completely saturated data will have a value of 0.
Saturation is calculated following Philippe et al., PLoS Biology (2011), doi: 10.1371/journal.pbio.1000602.
https://pubmed.ncbi.nlm.nih.gov/21423652/ PLoS Biol . 2011 Mar;9(3):e1000602. doi: 10.1371/journal.pbio.1000602. Epub 2011 Mar 15. Resolving difficult phylogenetic questions: why more sequences are not enough Hervé Philippe 1, Henner Brinkmann, Dennis V Lavrov, D Timothy J Littlewood, Michael Manuel, Gert Wörheide, Denis Baurain https://journals.plos.org/plosbiology/article?id=10.1371/journal.pbio.1000602 https://www.ncbi.nlm.nih.gov/pmc/articles/PMC3057953/ Figure 5. Saturation levels of datasets from Schierwater et al., Dunn et al., and Philippe et al. The level of saturation was estimated for each dataset by computing the slope of the regression line of patristic distances (y-axis) versus uncorrected distances (x-axis), as previously described [12].
01 March 1994 https://academic.oup.com/jeb/article-abstract/7/2/247/7322433 https://onlinelibrary.wiley.com/doi/pdf/10.1046/j.1420-9101.1994.7020247.x Fig. 6. (A) Comparison, for SOD data, between the number of substitutions estimated from the most parsimonious tree (X-axis) and the number of observed differences (Y-axis). (B) Comparison, for our rRNA data set between the number of substitutions estimated from the most parsimonious tree (X axis) and the number of observed differences (Y axis).
https://www.youtube.com/watch?v=qtAL8X3314g
https://onlinelibrary.wiley.com/doi/10.1002/imt2.87 Using PhyloSuite for molecular phylogeny and tree‐based analyses - Xiang - 2023 - iMeta - Wiley Online Library
Substitution saturation analysis What is substitution saturation?
Box 9: Why analyze substitution saturation?
Substitution saturation is often strongly pronounced in datasets comprising distantly-related lineages or rapidly evolving sequences (sites). Identification and removal of loci that exhibit substitution saturation can improve the reliability of phylogenetic tree reconstruction [72, 73].
How to analyze substitution saturation in PhyloSuite?
https://www.frontiersin.org/articles/10.3389/fmars.2021.696523/full Frontiers | Commentary: Unbiasing Genome-Based Analyses of Selection: An Example Using Iconic Shark Species Nicholas J. Marra1 Michael J. Stanhope2 Nathaniel K. Jue3 Vincent P. Richards4 Stephen J. O'Brien5,6 Agostinho Antunes7,8 Mahmood S. Shivji5,9*
Response To Investigation of Substitution Saturation
https://www.frontiersin.org/articles/10.3389/fmars.2021.573853/full Frontiers | Unbiasing Genome-Based Analyses of Selection: An Example Using Iconic Shark Species Kazuaki Yamaguchi Shigehiro Kuraku*
FIGURE 1 (B) Substitution saturation plots for transition and transversion of the coding region of the Fgg, Mdm4, Chek2, and Dtl genes chosen from those previously regarded as positively selected (Marra et al., 2019).
Investigation of Substitution Saturation
To investigate possible substitution saturation, we further analyzed the Fgg, Mdm4, Chek2, and Dtl genes. Indices of substitution saturation (Iss), introduced by Xia (2009), were computed for the first, second, and third codon positions of ortholog sequences using the DAMBE program (Xia, 2018).
2012 http://ape-package.ird.fr/APER.html https://link.springer.com/book/10.1007/978-1-4614-1743-9 Analysis of Phylogenetics and Evolution with R | SpringerLink https://link.springer.com/chapter/10.1007/978-1-4614-1743-9_5 130 5 Phylogeny Estimation 5.1.2 Exploring and Assessing Distances | On the other hand, large distances will lead to a similar problem because of mutation saturation: the JC69 distance cannot exceed 0.75, but in practice distances greater than 0.3 lead to difficulties. A second useful, though very simple, graphical exploration tool is to plot two sets of distances computed on the same data with the goal to contrast the effect of different methods. A form of this approach is well-known as the ‘saturation plot’ where the number of transitions or transversions is plotted against the K80 distance (see p. 191), but this can be generalized.
5.8 Case Studies 189 Table 5.5. Some points to be considered in phylogeny estimation | Histogram and saturation plots
190 5 Phylogeny Estimation 5.8.1 Sylvia Warblers | This shows that the GG95 distances differ substantially from the others. Note that a perfect correlation does not guarantee that the distances are the same: some graphical analyses are needed to check this. We do this to examine the saturation of substitutions in the sequences. We first compute the distances using the JC69 model and the raw distance (i.e., proportion of different sites):
5.8 Case Studies 191 | Fig. 5.15. Saturation plots for the cytochrome b sequences of 25 species of Sylvia showing the effects of multiple substitutions (left) and of the transition/transversion ratio (right)
This analysis, though informative, is not what is usually called “saturation plots” in the literature. The latter is a plot, eventually for each codon position, of the numbers of transitions and transversions on the x-axis against the K80 distance on the y-axis.
http://www.iu.a.u-tokyo.ac.jp/lectures/AG01/180502/20180502.pdf Microsoft PowerPoint - 2018_生物配列解析基礎_3回目.pptx 1つの遺伝⼦の系統解析だけでは進化の歴史を調べるのに不⼗分な場合がある
- 異なる遺伝⼦を⽤いて系統樹を作成した場合に,トポロジーが⼀致しないことがある
- これには,遺伝⼦の⽔平移動,分岐年代の近さ,塩基・アミノ酸置換の飽和,個々の遺伝⼦にかかる選択圧の違いなど,様々な原因が考えられる
2014年01月21日 https://bookclub.kodansha.co.jp/product?item=0000194810 『分子からみた生物進化 DNAが明かす生物の歴史』(宮田 隆) p. 326, 358 飽和
http://www.fish-evol.org/DatabaseEnglish.html 系統解析の英語例文 2012 年 7 月 16 日 井上 潤
3rd ポジション この結果は,統計的有為さに悪影響を及ぼす高度の飽和を示している.このため,解析から除外する. This preliminary result indicates a high degree of saturation that severely affected the statistical significance of the estimates (results not shown) and, thus, we excluded these sites from the analysis (Schrago and Russo, 2003).
飽和しているが,3rd には系統情報が含まれていることがある. Third codon positions for both mitochondrial genes, despite obvious potential saturation problems (Cao et al. 1994), often contain phylogenetic information, even among distantly related species (Zardoya and Meyer, 1996).
系統樹が解けないときの理由 3rd の TV でも,いくらか飽和があるのは明らか. It was apparent that some degree of saturation also occurred in 3rd-codons TVs (Yamanoue et al. 2009).
https://pubmed.ncbi.nlm.nih.gov/26609078/ Mol Biol Evol . 2016 Mar;33(3):595-602. doi: 10.1093/molbev/msv274. Epub 2015 Nov 25. On the Causes of Evolutionary Transition:Transversion Bias Arlin Stoltzfus 1, Ryan W Norris 2 https://academic.oup.com/mbe/article/33/3/595/2579658 https://www.ncbi.nlm.nih.gov/pmc/articles/PMC7107541/
https://pubmed.ncbi.nlm.nih.gov/25886870/ BMC Evol Biol . 2015 Mar 11;15:36. doi: 10.1186/s12862-015-0312-6. Declining transition/transversion ratios through time reveal limitations to the accuracy of nucleotide substitution models Sebastián Duchêne 1, Simon Y W Ho 2, Edward C Holmes 3 4 https://bmcecolevol.biomedcentral.com/articles/10.1186/s12862-015-0312-6 https://www.ncbi.nlm.nih.gov/pmc/articles/PMC4358783/
https://pubmed.ncbi.nlm.nih.gov/17274688/ PLoS Genet . 2007 Feb 2;3(2):e22. doi: 10.1371/journal.pgen.0030022. Transition-transversion bias is not universal: a counter example from grasshopper pseudogenes Irene Keller 1, Douda Bensasson, Richard A Nichols https://journals.plos.org/plosgenetics/article?id=10.1371/journal.pgen.0030022 https://www.ncbi.nlm.nih.gov/pmc/articles/PMC1790724/
https://pubmed.ncbi.nlm.nih.gov/10093216/ J Mol Evol . 1999 Mar;48(3):274-83. doi: 10.1007/pl00006470. Estimation of the transition/transversion rate bias and species sampling Z Yang 1, A D Yoder https://link.springer.com/article/10.1007%2FPL00006470
進化速度
https://en.wikipedia.org/wiki/Rate_of_evolution
https://pubmed.ncbi.nlm.nih.gov/31570957/ J Mol Evol . 2019 Dec;87(9-10):317-326. doi: 10.1007/s00239-019-09912-5. Epub 2019 Sep 30. Investigating Evolutionary Rate Variation in Bacteria Beth Gibson 1, Adam Eyre-Walker 2 https://link.springer.com/article/10.1007/s00239-019-09912-5 https://www.ncbi.nlm.nih.gov/pmc/articles/PMC6858405/ Across species, we find that accumulation rates vary by over 3700-fold. We investigate whether accumulation rates are associated to a number potential correlates including genome size, GC content, measures of the natural selection and the time frame over which the accumulation rates were estimated. After controlling for phylogenetic non-independence, we find that the accumulation rate is not significantly correlated to any factor. Furthermore, contrary to previous results, we find that it is not impacted by the time frame of which the estimate was made.
We compiled estimates of the accumulation rate for 34 species of bacteria. These vary by over 3700 fold (Fig. 1.), but the majority of species accumulate mutations at rates of between 1 × 10⁻⁶ and 2 × 10⁻⁶ per site per year.
Fig. 1 Distribution of accumulation rate estimates for 34 species of bacteria
Duchêne S, et al. Genome-scale rates of evolutionary change in bacteria. Microb Gen. 2016;2(11):e000094. [PMC free article] [PubMed] [Google Scholar]
2016-11-30 https://pubmed.ncbi.nlm.nih.gov/28348834/ Microb Genom . 2016 Nov 30;2(11):e000094. doi: 10.1099/mgen.0.000094. eCollection 2016 Nov. Genome-scale rates of evolutionary change in bacteria Sebastian Duchêne 1 2 3, Kathryn E Holt 2 3, François-Xavier Weill 4, Simon Le Hello 4, Jane Hawkey 2 3, David J Edwards 2 3, Mathieu Fourment 1, Edward C Holmes 1 https://www.microbiologyresearch.org/content/journal/mgen/10.1099/mgen.0.000094#tab2 https://www.ncbi.nlm.nih.gov/pmc/articles/PMC5320706/ The robustly estimated evolutionary rates spanned several orders of magnitude, from approximately 10−5 to 10−8 nucleotide substitutions per site year−1.
Despite the wealth of sequence data, genome-wide rates of evolutionary change in bacteria are often uncertain. At one end of the spectrum, rates as high as ~10−5 nucleotide substitutions per site year−1 have been reported for Neisseria gonorrhoeae (Pérez-Losada et al., 2007). In contrast, genome-wide rates of only ~10−9 substitutions per site year−1 have been observed in Mycobacterium tuberculosis (Comas et al., 2013). Importantly, however, these estimates are not always readily comparable because they use different methods and sources of data.
To provide a comprehensive picture of genomic-scale evolutionary rates in bacteria and their temporal dynamics, particularly the extent of time-dependency in the data, we analysed, using a variety of phylogenetic methods, 36 publically available whole genome SNP data sets from bacterial pathogens associated with human disease sampled over periods extending over 2000 years.
https://pubmed.ncbi.nlm.nih.gov/33560364/ PhyKIT https://www.ncbi.nlm.nih.gov/pmc/articles/PMC8388027/ estimation of mutation rate
https://jlsteenwyk.com/PhyKIT/usage/index.html#evolutionary-rate Calculate a tree-based estimation of the evolutionary rate of a gene. Evolutionary rate is the total tree length divided by the number of terminals. Calculate evolutionary rate following Telford et al., Proceedings of the Royal Society B (2014).
https://jlsteenwyk.com/PhyKIT/usage/index.html#covarying-evolutionary-rates Determine if two genes have a signature of covariation with one another. Genes that have covarying evolutionary histories tend to have similar functions and expression levels.
2015/06/12 https://www.youtube.com/watch?v=2zPXHmqM3rk&list=RDLV6_XMKmFQ_w8 2. Phylogenetics & Phylogeography(lecture-part 2) a.Why consider time?
| RNA Viruses | DNA Viruses | Bacteria | |
|---|---|---|---|
| Mutations per year | 10-100 | 1-20 | 0-1 |
6:01 AM · Jul 18, 2018 https://twitter.com/ASMicrobiology/status/1019326186625912832 ASM on Twitter: "Complexities of viral mutation rates, including 3 hypotheses for why mutation rates have not evolved to be zero, in a new @JVirology Gem: https://t.co/bWwl3Xa6Ti https://t.co/SnGlN65JxL" / Twitter
https://pubmed.ncbi.nlm.nih.gov/29720522/ Review J Virol . 2018 Jun 29;92(14):e01031-17. doi: 10.1128/JVI.01031-17. Print 2018 Jul 15. Complexities of Viral Mutation Rates Kayla M Peck 1, Adam S Lauring 2 3 https://journals.asm.org/doi/10.1128/JVI.01031-17 https://www.ncbi.nlm.nih.gov/pmc/articles/PMC6026756/ substitutions per nucleotide site per cell infection (s/n/c)
https://covid-19chronicles.cseas.kyoto-u.ac.jp/post-041-jp-html/ 東南アジアにおける新型コロナウイルスの突然変異と拡散──今後のワクチンの行方── | Corona Chronicles: Voices from the Field
図3 RNAウイルスの進化速度の比較。進化速度(s/n/y、塩基置換を塩基あたり、年あたりで示す)はy軸上、ゲノムサイズ(nt、塩基数に基づく)はx軸上に示す。より大きなゲノムを持つ生命体は、変異速度がより遅い傾向にある。SARS-CoV-2を含むコロナウイルス科は、30,000ntという巨大なゲノムを持ち、その他のRNAウイルスに比べて遅い変異を示す。DNAウイルスの単純ヘルペスウイルスは、比較のために示すもの。データは複数の資料を基に編集した16,17,19–22。
https://www.nig.ac.jp/museum/evolution-x/01_c.html 遺伝学電子博物館
分子進化の中立説 ~木村資生と中立説 (1) 中立説の誕生
(2)中立説の展開
「機能的に重要でない分子(または分子内の重要でない部分)ほど、そうでないものより進化の過程でアミノ酸やDNA塩基の置換が急速に起こり、置換率(進化速度)の最高は突然変異率で決まる」という考えに達したのは1973年頃で、これが伝統的な進化遺伝学から見れば全くの異端的な考えであることは十分承知していた。
(3)中立説の確立 筆者は1977年に、もし、進化速度の上限が突然変異率で決まるという結果が分子進化の研究から将来出れば、それは中立説を支持することになるという主張を発表したが、しばらくして、予想もしなかったところからこれを支持する劇的なデータが出てきた。それはマウスで見い出されたヘモグロビンの偽遺伝子に関するものである。ここで、偽遺伝子(pseudogene)とは、既知の正常遺伝子と塩基配列の上で非常に似ているが、正常遺伝子から重複によって生まれた後、何らかの理由で遺伝子としての機能を失ったもので、「死んだ遺伝子」とよばれることもあるものである。九州大学の宮田隆博士は世界に先がけ、この進化速度の推定に成功した。得られた値はDNAの塩基置換率としては最高と考えられる値であった。
(4) 中立説と分子進化速度 4-1:速度の一定性の説明
分子進化には二つの大きな特徴、すなわち年あたりの「速度の一定性」と、変化様式の「保守性」がある。これらの特徴は中立説によってどのように説明されるであろうか。
中立突然変異に対しては「進化速度=突然変異率」という簡単な法則が成り立つ。したがって、進化速度の年あたりの一定性は中立突然変異の出現率が特定の遺伝子(またはそれから作られるタンパク質)について各種の生物の系統で年あたり一定であると仮定して説明される。したがって、中立説が正しければ、分子レベルの突然変異(DNA塩基の変化)、特に中立突然変異の起こる率は環境条件、集団の大きさ、一世代の長さほとんど影響されないはずである。
4-2:単位は世代か物理的時間か
4-3:突然変異率は生殖細胞の分裂回数に比例
4-5:世代あたりで一定の突然変異
資料:木村資生「生物進化を考える」岩波新書,1988
2005年4月1日 https://www.brh.co.jp/research/formerlab/miyata/2005/post_000003.php 【パラダイムシフト:分子進化の中立説】 | JT生命誌研究館
もしこの関係を知っていれば、置換数から分岐年代が簡単に推定できることになる。 分子時計は、言い方を変えれば、分子進化速度の一定性である。この結果は中立説で容易に理解できる。中立説によると、分子進化速度kは総突然変異率μに対する中立な突然変異の割合fに比例する。 k = f・μ (1)
2005年8月1日 https://www.brh.co.jp/research/formerlab/miyata/2005/post_000006.php DNA、RNA、タンパク質といった分子の進化速度は機能的制約の強さに直接依存する。分子進化の中立説によると、分子進化速度kは中立な突然変異率で決まる。すなわち、k=f・μである(本シリーズ「パラダイムシフト:分子進化の中立説」を参照)。ここで、μは総突然変異率で、fはそのうちの中立な変異の割合である。突然変異は大ざっぱに有利、不利、及び中立な変異に分けられるが、有利な変異は数の上で非常に少ないので無視すると、1-fは不利な変異の割合になり、機能的制約の大きさに比例する量である。従って機能的制約が大きくなるとfが小さくなり、進化速度kが小さくなる。このことを実際の例で確かめてみよう。
https://en.wikipedia.org/wiki/Mutation_bias
2020年05月01日 https://hc.nikkan-gendai.com/articles/272230?page=2 RNAウイルスは塩基配列が変わりやすく、変異が蓄積する速度はヒトの核ゲノムのDNAと比べて100万倍速いといわれています。 新型コロナウイルスの進化速度は、SARS、MERSと比較して、ほぼ同じで新型コロナウイルスのRNAゲノムに1年間で蓄積される塩基変異は3万個の塩基のうち24個程度と推定されています。 https://www.yodosha.co.jp/jikkenigaku/special/SARS-CoV-2.html 新型コロナウイルスSARS-CoV-2の比較ウイルス学と比較ゲノム解析|2020年5月号|実験医学online:羊土社 - 羊土社 SARS-CoV-2の変異 RNAウイルスの複製を担うRNAポリメラーゼは校正機構を有さないため,突然変異率が非常に高く,そのため塩基置換速度(進化速度)も非常に速い.ただし,コロナウイルスについては他のRNAウイルスと異なり,複製時のエラーを校正する酵素をもち15),SARS-CoV-2でも機能していると考えられる.2020年3月6日にエジンバラ大学のAndrew Rambautらが報告したSARS-CoV-2の176配列(進化速度解析に使用した配列は86配列)を用いた解析結果によると,進化速度は0.80×10⁻³ substitution/site/yearと推定された(95%信頼区間:0.14〜1.31×10-3)(http://virological.org/t/phylodynamic-analysis-176-genomes-6-mar-2020/356).SARS-CoV-2のゲノムサイズがおよそ30×103塩基ということを考えると,1年でおよそ24箇所くらいの塩基置換が蓄積していくと考えられる※3. https://sites.google.com/site/sonakagawa/etc/sars-cov-2_yodosha_etc 「新型コロナウイルスSARS-CoV-2の比較ウイルス学と比較ゲノム解析」執筆のよもやま話 - So Nakagawa Website ・変異について、具体的に1年で24箇所くらいの変異を蓄積するという書き方ですが、これはどのくらいの変異があるのかを想像してほしくて具体的な数字を上げたものです。これは、ウイルス集団のなかで残っている株がそれぞれオリジナルと比較すると24程度の突然変異が残っているというだけで、集団中にはもっと多くの突然変異が存在します(これは集団サイズに依存します)。
https://sites.google.com/site/nosada17/Home/osada_text?authuser=0 Naoki Osada (CV) - 生命情報解析学テキスト https://drive.google.com/file/d/12TOTW2kOEtqC2G7vZRqRswH_5bNTXG5F/view 第2章 集団遺伝学
世代あた りに固定する変異の数は μ となり,突然変異率と等しくなる.世代あたりに固定する変異 の数のことを分子進化速度(rate of molecular evolution)と呼ぶ.中立な変異では分子進化速 度は突然変異率に等しくなる.この関係が分子進化の中立説(the neutral theory of molecular evolution)と呼ばれる説の中心になる.
https://drive.google.com/file/d/1gHH9qLdrOrOF5ptLaJCBIg_LJ25UfVFa/view?usp=sharing 第3章 分子進化
- 中立な変異の置 換速度は突然変異率(μ)に等しくなることは第 2 章で既に述べた.
- Kimura’s 2-parameter model 前章でも述べたとおり,塩基間の突然変異率は(JC モデルで仮定しているように)均一で はない.一般的にはトランジッションと呼ばれるプリン,ピリミジン同士の変異がトランス バージョンと呼ばれるプリン,ピリミジン間での変異よりも 2 倍程度起こりやすいことが 知られている.この違いを考慮に入れているのが,木村の 2 パラメータモデル(Kimura’s 2- parameter model)である(
- サイトによる置換速度の違い これまでのモデルではサイトごとの置換速度は一定と仮定されていた.ところが,遺伝子の 中でも塩基配列の置換速度には差があることがよく知られている.これは突然変異率がサ イトによって違っていることが原因の一つだろう.例えば前述したように CpG サイトの C は変異率が他に比べてとても高い.程度の差こそあれ,このような置換速度のばらつきが存 在する.この問題を解決するために様々な方法が提案されてきたが,よく用いられているの が,サイトごとの置換速度のばらつきをガンマ分布(gamma distribution)と仮定するモデル である (Yang1993).
- 同義・非同義サイト 非コード領域においては,「サイト当たりの突然変異率」などのように塩基サイトの定義は 明確であった.それではコドンを考えた場合の同義・非同義サイトの定義はどうなるだろう.
- 非同義置換と同義置換の比 非同義置換率を KA または dN,同義置換率を KS または dS と表記することが多い.これらの 比(コドンモデルでは ω として推定されるパラメータ)は遺伝子ごとのコドンに対する自 然選択を表す指標として用いられている.同義置換には自然選択が働かないと仮定すると, Ks はその領域での突然変異率を反映していると考えられる.
http://www.iu.a.u-tokyo.ac.jp/lectures/AG01/170517/2017_生物配列解析基礎_3回目_資料.pdf 分子系統樹 12 DNAに蓄積する変異は一定の割合で起こっており、そのほとんどが自然選択とは無関 係な中立の変異である DNAの配列がどのくらい似ているかを調べることによって、進化的にどの程度近縁で あるかを知ることができる
https://kimuraseminar.wordpress.com/2017年8月3日-系統学2/ 2017年8月3日 系統学2 系統学2(岸野洋久) 集団に固定されない有害な変異は観測されないので、分子進化速度は突然変異率と中立な変異の割合で表現されます。分子進化速度の一定性の作り出す分子時計からは、これら二つの要素が安定しており、あまり変化しないことが伺われます。
2008 https://www.ism.ac.jp/editsec/toukei/abstract/56-1j.html コドンモデルを用いた分岐年代のベイズ推定 https://www.ism.ac.jp/editsec/toukei/pdf/56-1-037.pdf 中立説の下では f = 1 2N となり,分子進化速度は集団の大きさに左右されず,遺伝 子の突然変異率になる.従って,突然変異率が一定であるような状況では,分子時計が成立す ることになる.進化速度の一定性が認められる場合においては,化石データと一部の配列デー タから推定された進化速度を全系統樹に適用し,系統樹の全ての分岐点の年代を推定すること ができる.
2002 https://www.ism.ac.jp/editsec/toukei/pdf/50-1-017.pdf 中立説の下では,突然変異率が一定であれば,分子進化速度は 一定となり,いわゆる分子時計が成立するため,これを検定する方式がいくつか提唱されてき た(
最終更新日: 2020.05.07 https://www.sbj.or.jp/sbj/sbj_yomoyama_2.html 生物工学会誌 –『続・生物工学基礎講座-バイオよもやま話-』 | 公益社団法人 日本生物工学会 微生物の系統樹,どう描くの? 飯野 隆夫・伊藤 隆 91-10-576 https://www.sbj.or.jp/wp-content/uploads/file/sbj/9110/9110_yomoyama.pdf
https://www.sbj.or.jp/sbj/sbj_yomoyama.html 生物工学基礎講座-バイオよもやま話-(2011年89巻4号~2013年91巻3号掲載) | 公益社団法人 日本生物工学会 知っておきたい殺菌・除菌・滅菌技術 松村 吉信・中田 訓浩 89–12–739 https://www.sbj.or.jp/wp-content/uploads/file/sbj/8912/8912_yomoyama_1.pdf 何から始めよう 微生物の同定-細菌・アーキア編- 浜田 盛之・鈴木 健一朗 89–12–744 https://www.sbj.or.jp/wp-content/uploads/file/sbj/8912/8912_yomoyama_2.pdf
https://jcm.brc.riken.jp/ja/ 微生物材料開発室 (JCM) (RIKEN BRC)
タクソンサンプリング
https://www.fifthdimension.jp/documents/molphytextbook/answers.pdf 分子系統解析における様々な問題について
2019/04/20 https://sites.google.com/view/enter-the-fungi/phylogenetic-analysis/pre-phylogenetic-analysis Enter the FUNGI - 系統解析の前準備の話
https://twitter.com/i/events/939216389797068800 Nov 3, 2017 BAMMを使ってみて感じたことは
- 結果がタクソンサンプリングに左右される、解析材料が系統樹だけなので。
http://setoblo.blogspot.com/2013/10/ せとブロ ‐ 瀬戸臨海実験所公式ブログ: October 2013 祝! 岡西政典さん 論文出版! また本研究では、タクソンサンプリングと適切な遺伝子の選択が分子系統解析に与える影響についても言及しています。
2010-08-17 https://blog.goo.ne.jp/acornworm/e/e286ffe827f0270406c8410b17a85b9f 祖先的な動物の系統関係 - 深海生物研究者の日常 分子の数を増やすよりもタクソンサンプリングの方が重要 Long branch attractionにも気をつけろ
https://www.ikushimo.com/news/2007/02/10.html ◆ [Science] Detecting the Node-Density Artifact in Phylogeny Reconstruction - 09:53:39 タクソンサンプリング密度が高ければ高いほど、最節約・最尤・ベイジアン系統推定における多重置換検出率は上昇する。つまり、タクソンサンプリングが粗な分類群と密な分類群では枝長の推定精度が異なる。多重置換検出率が低ければ低いほど「見かけの進化速度」が遅くなり、逆は速くなる。ここで、現在の系統推定法では進化の速い分類群どうしが引きつけ合うLong-Branch Attractionという効果が知られている。故に、密にサンプリングされた分類群では多重置換がよく検出されて進化が見かけ上高速になり、そのような分類群どうしがLong-Branch Attractionによって引きつけ合う効果が生まれる。これが系統推定を誤る原因になり得る。
https://ja.wikipedia.org/wiki/遺伝子マーカー もしくは系統(個人の特定、親子・親族関係、血統あるいは品種など)の目印となる、つまりある性質をもつ個体に特有の、DNA配列をいう[1]。 また系統の解析に遺伝子マーカーを利用する方法は、一般にDNA型鑑定などの名で呼ばれている。これにはマイクロサテライトなどがマーカーとして用いられている。
https://www.ncbi.nlm.nih.gov/pubmed/24146954 PLoS One. 2013 Oct 17;8(10):e77033. doi: 10.1371/journal.pone.0077033. eCollection 2013. Systematic identification of gene families for use as "markers" for phylogenetic and phylogeny-driven ecological studies of bacteria and archaea and their major subgroups. Wu D1, Jospin G, Eisen JA.
https://github.com/haruosuz/microbe/blob/master/references/README.microbiome.md#16s
https://www.aist.go.jp/aist_j/press_release/pr2017/pr20170830/pr20170830.html 産総研:進化系統分類の指標となる16S rRNA遺伝子の進化的な中立性を実験的に証明 生物の系統進化を正確に反映する「分子マーカー(分子時計)」の要件は、 分子時計(進化系統解析における分子マーカー)と呼ぶ。
model-selection
系統(樹形や祖先配列)推定において、進化モデル選択は不要な手順であり、最も複雑なモデル(GTR+I+G)を使用することで回避できる。
https://www.nature.com/articles/s41467-019-08822-w Model selection may not be a mandatory step for phylogeny reconstruction | Nature Communications
https://natureecoevocommunity.nature.com/users/207830-shiran-abadi/posts/44527-is-model-selection-a-mandatory-step-for-phylogeny-reconstruction Is Model Selection a mandatory step for phylogeny reconstruction? | Nature Research Ecology & Evolution Community
We reconstructed all phylogenies with the most complex model, GTR+I+G, regardless of the Model Selection methods, and the inferences were even better than those of the models selected by the Model Selection methods.
any model could serve just as well as the best fitted one.
Model Selection is an unnecessary step and can be avoided by employing the most complex model.

モデル選択法に関係なく、最も複雑なモデルGTR+I+Gを使用してすべての系統を再構築したところ、モデル選択法によって選択されたモデルよりも推論が優れていました。
どのモデルも、最適なモデルと同様に機能します。
モデル選択は不要な手順であり、最も複雑なモデルを使用することで回避できます。
https://twitter.com/fburki/status/1100003521569660929 Fabien Burki on Twitter: "This will likely stir some S: Model selection may not be a mandatory step for phylogeny reconstruction https://t.co/p0XYygiJxM" 7:04 AM - 25 Feb 2019
https://twitter.com/3rdreviewer/status/1100151955110809600 Matthew Hahn on Twitter: "This seems like a big deal. Hope to hear from some people who know this stuff better (cc: @roblanfear) Model selection may not be a mandatory step for phylogeny reconstruction https://t.co/In76QkR5yH" 4:54 PM - 25 Feb 2019
http://cse.naro.affrc.go.jp/minaka/cladist/NOTES/stochastic.html 確率過程概論(分子進化モデル) マルコフ過程についての概論 「一般時間逆転モデル」(GTR:general time-reversible model)
http://cse.naro.affrc.go.jp/minaka/cladist/NOTES/modeltest.html ●最尤法でのモデル選択問題(ModelTestを用いて) ここでは塩基置換モデルに焦点を当ててモデル選択問題を考えてみます.一般時間逆転モデル(GTR)をもっとも緩いモデル,Jukes-Cantorモデル(JC)をもっとも厳しいモデルとすると,現在用いられている塩基置換モデルはGTRとJCを両極端とする階層のいずれかの場所に位置づけられます.
http://www.tezuru-mozuru.com/?cat=200 系統解析 – チームてづるもづる
2017年3月9日 http://www.tezuru-mozuru.com/?p=9843 MEGAによるモデルテスト – チームてづるもづる 今回の解析では,GTR+G+Iがベストなモデルとして選択されました.
2016-10-12 http://www.geocities.jp/ancientfishtree/RAxML RAxML - 井上 潤
-m GTRCAT モデルの選択.ブートストラップ解析では CAT-based のモデル (尤度を最大化するのではなく,ベストの系統樹を探索することに的を絞ったモデル) がマニュアルでは推奨されています. ブートストラップ解析は GTRCAT で行った方がよいと思います.
https://www.fifthdimension.jp/documents/molphytextbook/molphytextbook.ja.html 分子系統学演習 データセットの作成から仮説検定まで 田辺晶史 2015/10/20 第2章 分子進化モデルの基礎 2.1 塩基置換モデル 一般時間反転可能(general time-reversibleを略してGTR)モデル 2.2 アミノ酸置換モデル 2.3 より複雑なモデル なお、RAxMLというソフトにもCATモデルというものが実装されていますが、名前が同じなだけで全くの別物です。こちらのCATモデルは、Γ分布を使わずに、座位を任意の数の速度カテゴリに分けて尤度を計算するASRVモデルです。+ G モデルの高速な近似法として用いられています。
2011-05-07 https://anond.hatelabo.jp/20110507155609 モテる系統解析系女子力を磨くための4つの心得 「RAxMLでしょ?かなり短時間で最尤法を終わらせることがでできるけど、基本的にGTRモデルかCATモデルでないとめんどくさいことになるみたいだよ。
https://en.wikipedia.org/wiki/Substitution_model The Dayhoff PAM matrices were based on relatively few alignments (since not more were available at that time), but in the 1990s, new matrices were estimated using almost the same methodology, but based on the large protein databases available then (,[16][17] the latter being known as "JTT" matrices).
http://motdb.dbcls.jp/?plugin=attach&pcmd=open&file=20130730ajacs41_onami.pdf&refer=AJACS41 T1R3アミノ酸配列の系統樹構築 2.最尤法(系統樹推定)
48件のアミノ酸置換モデルの内、BIC (Bayesian Information Criteria)が最も低いモデルは「JTT+G」
■Model/Method →「Jones‐Taylor‐Thornton(JTT) model」 ■Rates among Sites →「Gamma Distributed (G)」 上記二か所のパラメータを「JTT+G」に合わせて設定し、 「Compute」
https://www35.atwiki.jp/kojimakk/pages/21.html ModelGenerator - 小島生物学御研究室 @ ウィキ - アットウィキ
JTT(Jones, Taylor, Thornton):DayhoffのPAM行列の改良。
WAG:最尤推定によるJTTの改良版(JTTは最節約的な置換推定)、球状タンパク質の置換頻度から行列を生成。(Whelan and Goldman, 2001)
DcMut:DayhoffとJTTの亜型を統合したもの。(Kosiol and Goldman, 2005)
統計数理(2008) https://www.ism.ac.jp/editsec/toukei/abstract/56-1j.html 複数遺伝子の結合データに基づく分子系統樹の推測 —真核生物の大系統の解析を例として— http://www.ism.ac.jp/editsec/toukei/pdf/56-1-145.pdf 今,アミノ酸レベルの解析を行うものとし,経験的なアミノ酸置換確率(PAM モデ ル(Dayhoff et al., 1978),JTT モデル(Jones et al., 1992),WAG モデル(Whelan and Goldman, 2001)など)を用い,アミノ酸組成をデータから推定するものとし,
RAxML プログラ ムにより,アミノ酸置換モデルとして JTT を用い,アミノ酸組成をデータから推定(F オプショ ン)し,座位間の進化速度の不均一性を離散 Γ 分布で近似して解析した結果,図 2 に示す系統 樹が最良な系統樹として選択された.
アミノ酸置換モデルとして JTT + Γ を用い,アミノ酸の組成値はデータから推定した.
一 方,アミノ酸置換モデルとして,JTT(F)+ Γ モデルの代わりに WAG(F)+ Γ モデル,PAM (F)+ Γ モデルを用いて同様の解析を行った(データ不表示).全般的に JTT(F)+ Γ モデル に比べて PAM(F)+ Γ モデルはやや高い対数尤度の値を与え,WAG(F)+ Γ モデルはさら に高い対数尤度の値を与えた.しかしながら,系統樹の選択という観点では,いずれのモデル による結果も JTT(F)+ Γ モデルによる結果と全く同様であった.このように,置換モデル を変えても結合データ解析のモデルを変えても推測の結果に大差がないということから,リボ ソームタンパク質による今回のデータ解析の結果は非常に頑健なものであると考えられた.
置換行列
https://en.wikipedia.org/wiki/BLOSUM
https://github.com/haruosuz/r4bioinfo/blob/master/references/R.bio.md#subvis
https://github.com/haruosuz/r4bioinfo/blob/master/R_Avril_Coghlan/README.md#pairwise-global-alignment-of-dna-sequences-using-the-needleman-wunsch-algorithm scoring matrix (substitution matrix) BiostringsパッケージのnucleotideSubstitutionMatrix()関数でスコアマトリックス(置換行列)を作る:
https://github.com/haruosuz/r4bioinfo/blob/master/R_Avril_Coghlan/README.md#pairwise-global-alignment-of-protein-sequences-using-the-needleman-wunsch-algorithm アミノ酸置換行列 BLOSUM (BLOcks SUbstitution Matrix)
https://github.com/haruosuz/bioinfo/blob/master/2019/CaseStudy.md#akifumi-tanabe https://doi.org/10.7875/togotv.2019.195 2019-12-08 分子系統学演習 - データセットの作成から仮説検定まで @ 分子系統樹推定法:理論と応用 ワークショップ 1:07:45 / 3:22:38 アミノ酸 置換速度 行列 https://www.fifthdimension.jp/documents/molphytextbook/ 分子進化の統計モデリングとモデル選択 https://www.fifthdimension.jp/documents/molphytextbook/modelselection_lecture.pdf 20x20 の置換速度行列 ● 189 の rXY と 19 の πX をパラメータとして持つ 計算困難 ● Empirical Model – 既知の系統樹と大量のデータから推定した値に固定 – データから推定するパラメータ数は 0
https://www.fifthdimension.jp/documents/molphytextbook/molphytextbook.ja.html 第2章 分子進化モデルの基礎
2.1 塩基置換モデル 2.1.1 塩基置換速度行列 塩基置換速度行列(nucleotide substitution rate matrix)は、座位(site)内における、形質状態(character state)間の移行速度の不均質性(heterogeneity)を表現するものです。
2.2 アミノ酸置換モデル 2.2.1 Empirical model 塩基置換速度行列は4x4の行列でしたが、アミノ酸置換速度行列は20x20の行列となるため、RateXYとFreqXの数は時間反転可能モデルでも 190 + 20 = 210 となり膨大です。そこで、既に系統関係の分かっている分類群間の系統樹において、大量のデータを用いてあらかじめ推定されたRateXY FreqXの値を用いたモデルをアミノ酸置換モデルとして用います。
2.3 より複雑なモデル
https://bi.biopapyrus.jp/seq/ 2018.08.17 https://bi.biopapyrus.jp/seq/score-matrix.html 置換行列 | スコアマトリックスの作り方 置換スコアは、アライメントから求める。アライメントは必要に応じて、近縁種の塩基配列やアミノ酸配列を用いたり、遠縁種のそれを用いたりする。
https://bioinformaticshome.com/bioinformatics_tutorials/sequence_alignment/substitution_matrices.html Bioinformatics tutorial: Construction of substitution matrices 2020
http://feynmanino.watson.jp/10717_220MolecularPhylogenetics.html 220・分子系統学の手法
- BLOSUM62はblastpのデフォルトで使われている置換スコア行列で、62%以上の配列一致性を示すアミノ酸配列間で観測された置換を基に算出して得られたアミノ酸の置換行列、という意味です(https://slidesplayer.net/slide/11313941/)。
- PAM行列(Dayhoffのアミノ酸置換行列)は、アミノ酸の変化率が合計で1%の変化の割合になるときの相対的な割合を示す行列がPAM1行列で、それをN乗(PAM(250)行列なら250乗)することで得られた遷移行列です(https://www.slideserve.com/claus/pam250-matrix)。
2.3 years ago https://www.biostars.org/p/291408/ Creating a custom substitution matrix from multiple alignments/trees?
You can use BayesTraits in Multistate mode
21 months ago https://www.biostars.org/p/322615/ Creating your own substitution matrix from an alignment
https://www.ncbi.nlm.nih.gov/pubmed/28583067 BMC Bioinformatics. 2017 Jun 5;18(1):293. doi: 10.1186/s12859-017-1703-z. PFASUM: a substitution matrix from Pfam structural alignments. Keul F1, Hess M2, Goesele M3, Hamacher K1.
http://goto.kuicr.kyoto-u.ac.jp/lecture/2_homology_search.pdf 2016年度「バイオインフォマティクス」
- 配列アライメント(五斗) スコアマトリックス(アミノ酸置換行列)
- PAM (Accepted Point Mutations)
- BLOSUM (BLOck SUbstitution Matrices)
https://www.ncbi.nlm.nih.gov/pubmed/20808876 PLoS Comput Biol. 2010 Aug 19;6(8). pii: e1000885. doi: 10.1371/journal.pcbi.1000885. CodonTest: modeling amino acid substitution preferences in coding sequences. Delport W1, Scheffler K, Botha G, Gravenor MB, Muse SV, Kosakovsky Pond SL.
2009年9月12日 https://www.jst.go.jp/nbdc/bird/jinzai/literacy/streaming/ バイオインフォマティクスの基礎:配列解析 講師:川端 猛 講義資料1 (PDF;2241 KB) https://www.jst.go.jp/nbdc/bird/jinzai/literacy/streaming/h21_3_1.pdf
https://www.youtube.com/watch?v=VpYaLtaU_dw 【ゲノムリテラシー講座】配列解析基礎(講義1) - YouTube 19:33 / 1:08:21
http://www.fish-evol.org/AAmatrix.html 井上潤:アミノ酸置換行列 Note on amino acid R matrix 2007 年 11 月 3 日 改訂 井上 潤 アミノ酸置換行列に関する個人的なメモです.
5 January 2005 http://abacus.gene.ucl.ac.uk/software/pamlFAQs.pdf How can I estimate an amino acid substitution matrix from my own data, like mtmam.dat and wag.dat?
https://assets.geneious.com/manual/2020.0/static/GeneiousManualsu114.html 12.3.4 Distance models or molecular evolution models for Amino Acid sequences
Jukes-Cantor This is the simplest substitution model. It assumes that all amino acids have the same equilibrium base frequency, i.e., each amino acid occurs with a frequency of 0.05 in protein sequences. This model also assumes that all amino acid substitutions occur at equal rates.
https://www.megasoftware.net/mega1_manual/Contents.html Contents --MEGA manual
4. Distance Estimation
4.1 Nucleotide Substitutions
4.2 Synonymous and Nonsynonymous Substitutions
4.3 Amino Acid Substitutions
https://www.megasoftware.net/mega1_manual/Distance.html#4-3
https://www.megasoftware.net/webhelp/contexthelp_hc/hc_estimate_substitution_matrix_ml_.htm Estimate Substitution Matrix (ML) Models | Estimate Substitution Matrix This option estimates and displays the nucleotide substitution rate matrix using the Maximum Likelihood method for the current data set and evolutionary model selected. This method finds the set of values for the substitution rate matrix parameters that maximizes the probability (likelihood) of the data. This is applicable only to nucleotide data (coding or non-coding).
Horizontal gene transfer 遺伝子水平伝播
https://ja.wikipedia.org/wiki/遺伝子の水平伝播 Horizontal gene transfer(HGT)またはLateral gene transfer(LGT)
2017年8月18日 http://www.nikkei-science.com/page/sci_book/bessatu/51221.htmll 微生物の驚異 | 日経サイエンス
【別冊221 微生物の脅威 マイクロバイオームから多剤耐性菌まで】親から子へ遺伝情報が受け継がれるという遺伝学の基本原理では説明できない遺伝情報のやりとり「水平伝播」の発見のきっかけとその後の展開。「自然界を渡り歩く細菌のDNA」 http://www.nikkei-science.com/page/magazine/9804/DNA.html …
http://www.nikkei-science.com/?p=14437 細菌の遺伝子交換,ずっと頻繁~日経サイエンス2011年6月号より 「水平伝播」という現象が進化を促している
2015-12-12 http://horikawad.hatenadiary.com/entry/2015/12/12/014019 「クマムシに外来遺伝子17%」は真実か - クマムシ博士のむしブロ
2013-04-05 http://horikawad.hatenadiary.com/entry/20130405/1365159629 パワーアップした遺伝子コレクター - クマムシ博士のむしブロ この藻類にはATPアーゼ遺伝子は多数のコピーがあり、水平伝搬で取込んだ後に重複化が進んだものと見られる。ATPアーゼ遺伝子が多くあるほど熱に耐性をもつようになることが知られており、古細菌からコレクションしたこのATPアーゼ遺伝子を多くもつことにより、この藻類が高温耐性を身につけ、熱水環境に適応したのだろう。 他にも、高濃度の重金属に対処するために重要な機能を担う遺伝子を細菌から取り入れたことも示唆されている。ヒ素を細胞外に排出するポンプをつくる遺伝子は、好熱性細菌から取込んだようだ。このようにして、重金属が豊富なスープの中でも元気に増殖できるものと思われる。
メタゲノムにおける遺伝子水平伝播イベント同定手法に関する総説 https://pubmed.ncbi.nlm.nih.gov/31504488/ Review Genome Biol Evol . 2019 Oct 1;11(10):2750-2766. doi: 10.1093/gbe/evz184. Current and Promising Approaches to Identify Horizontal Gene Transfer Events in Metagenomes Gavin M Douglas 1, Morgan G I Langille 1 https://academic.oup.com/gbe/article/11/10/2750/5554466 https://www.ncbi.nlm.nih.gov/pmc/articles/PMC6777429/
https://twitter.com/MicrobiomeJ/status/1102948766972145664 Microbiome on Twitter: "MetaCHIP: community-level horizontal gene transfer identification through the combination of best-match and phylogenetic approaches https://t.co/eFx9Jk1jdU" 10:07 AM - 5 Mar 2019 https://github.com/songweizhi/MetaCHIP songweizhi/MetaCHIP: Horizontal gene transfer (HGT) identification pipeline
共生細菌ボルバキアから宿主への遺伝子水平伝播 9:13 AM · Oct 14, 2018 https://twitter.com/KentsisResearch/status/1051264658030714890 KentsisResearchGroup on Twitter: "Horizontal gene transfer in eukaryotes: The first draft genomes of the ant Formica exsecta, and its Wolbachia endosymbiont reveal extensive gene transfer from endosymbiont to host. https://t.co/ZakV1uyz8B"
https://twitter.com/TetYahara/status/1083497343897333760 Tetsukazu Yahara on Twitter: "寄生植物のヤセウツボとナンバンギセルで、宿主への遺伝子の水平移動を確認した研究。イントロンが保持されているので、RNAではなくDNAそのものが移った。移った後の遺伝子の進化も起きている。こんなことがわかる時代になったことに驚く。… " 5:54 PM - 10 Jan 2019 https://twitter.com/kfuku0502/status/1083325395657723904 ハマウツボ科5種のトランスクリプトームを使って寄主植物からの水平伝播遺伝子を探索。絶対寄生の2種のみで水平伝播が確実そうなものが見つかる。 この手の研究の課題はいかにコンタミを除外するかだけど、ゲノムも一緒に読んでその可能性を除外している。遺伝子が本当に水平伝播して寄生植物ゲノムに挿入されているならk-mer頻度がsingle-copy regionのそれと一致する。これを水平伝播の証左としている。これならゲノムアセンブリーは必要ない。
https://twitter.com/Greeeening/status/1075562589382311936 小林 康一 (K. Kobayashi) on Twitter: "バクテリアの分類・同定に関しては詳しくないのだけど、以前に生物全体のヘム代謝系のゲノム解析を佐藤直樹先生と一緒にやらせてもらったときはすごく勉強になった。https://t.co/kYsNeienRZ バクテリアは遺伝子の水平伝播が多くて、tree of lifeというより、ring of lifeの様相であることを知った。" 8:24 PM - 19 Dec 2018
https://pubmed.ncbi.nlm.nih.gov/31828235/ Annu Rev Biomed Data Sci . 2018 Jul;1:93-114. doi: 10.1146/annurev-biodatasci-080917-013431. Epub 2018 Apr 25. Alignment-Free Sequence Analysis and Applications Jie Ren 1, Xin Bai 1 2, Yang Young Lu 1, Kujin Tang 1, Ying Wang 3, Gesine Reinert 4, Fengzhu Sun 1 2 https://www.annualreviews.org/doi/10.1146/annurev-biodatasci-080917-013431 https://www.ncbi.nlm.nih.gov/pmc/articles/PMC6905628/ https://www.annualreviews.org/doi/abs/10.1146/annurev-biodatasci-080917-013431
https://www.ncbi.nlm.nih.gov/pubmed/29713314 Front Microbiol. 2018 Apr 16;9:711. doi: 10.3389/fmicb.2018.00711. eCollection 2018. Background Adjusted Alignment-Free Dissimilarity Measures Improve the Detection of Horizontal Gene Transfer. Tang K1, Lu YY1, Sun F1,2.
https://www.ncbi.nlm.nih.gov/pubmed/29176581 Nat Rev Microbiol. 2018 Feb;16(2):67-79. doi: 10.1038/nrmicro.2017.137. Epub 2017 Nov 27. Functional horizontal gene transfer from bacteria to eukaryotes. Husnik F1,2,3, McCutcheon JP2.
https://www.ncbi.nlm.nih.gov/pubmed/27894995 Mol Phylogenet Evol. 2017 Feb;107:338-344. doi: 10.1016/j.ympev.2016.11.016. Epub 2016 Nov 26. Short branches lead to systematic artifacts when BLAST searches are used as surrogate for phylogenetic reconstruction. Dick AA1, Harlow TJ2, Gogarten JP3. https://linkinghub.elsevier.com/retrieve/pii/S1055-7903(16)30377-3
Short Branch Attraction (SBA)
SBA is an intended feature of BLAST searches, but becomes an issue, when top scoring BLAST hit analyses are used to infer Horizontal Gene Transfers (HGTs), assign taxonomic category with environmental sequence data in phylotyping, or gather homologous sequences for building gene families.
Therefore, one should look for this phenomenon when conducting best BLAST hit analyses as a surrogate method to identify HGTs, in phylotyping, or when using BLAST to gather homologous sequences.
It is well established that the top scoring BLAST hit does not necessarily represent the nearest phylogenetic neighbor (Eisen, 2000, Koski and Golding, 2001) and this is indeed expected, because the nearest neighbor is not always the most similar.
https://pubmed.ncbi.nlm.nih.gov/27189546/ Mol Biol Evol . 2016 Jul;33(7):1843-57. doi: 10.1093/molbev/msw062. Epub 2016 Apr 6. Estimating the Frequency of Horizontal Gene Transfer Using Phylogenetic Models of Gene Gain and Loss Seyed Alireza Zamani-Dahaj 1, Mohamed Okasha 1, Jakub Kosakowski 1, Paul G Higgs 2 https://academic.oup.com/mbe/article/33/7/1843/2579271
A gene gain could occur by horizontal transfer or by origin of a gene within the lineage being studied. 遺伝子の獲得は、水平伝播によって起こる場合と、研究対象の系統内で遺伝子が発生する場合とがある。
The distribution of rates of gene loss is very broad, which explains why many genes follow a treelike pattern of vertical inheritance, despite the presence of a significant minority of genes that undergo horizontal transfer. 遺伝子消失の割合の分布は非常に広く、水平転移をする遺伝子はかなり少数であるにもかかわらず、多くの遺伝子が樹状遺伝のパターンをとっていることが説明される。
https://www.ncbi.nlm.nih.gov/pubmed/27508073 F1000Res. 2016 Jul 25;5. pii: F1000 Faculty Rev-1805. doi: 10.12688/f1000research.8737.1. eCollection 2016. Horizontal gene transfer: essentiality and evolvability in prokaryotes, and roles in evolutionary transitions. Koonin EV1. Quantitatively, however, horizontal gene transfer (HGT) dominates microbial evolution, with the rate of gene gain and loss being comparable to the rate of point mutations and much greater than the duplication rate.
https://www.ncbi.nlm.nih.gov/pubmed/27303384 Front Microbiol. 2016 May 31;7:797. doi: 10.3389/fmicb.2016.00797. eCollection 2016. Gene Loss and Horizontal Gene Transfer Contributed to the Genome Evolution of the Extreme Acidophile "Ferrovum". Ullrich SR1, González C2, Poehlein A3, Tischler JS1, Daniel R3, Schlömann M1, Holmes DS4, Mühling M1. Furthermore, analysis of their genome synteny provides first insights into their genome evolution, suggesting that horizontal gene transfer and genome reduction in the group 2 strains by loss of genes encoding complete metabolic pathways or physiological features contributed to the observed diversification.
2016-08-20 https://katosei.jsbba.or.jp/view_html.php?aid=652 細胞外核酸を利用した簡便で迅速な形質転換系の確立 微生物間で生じるDNAの水平伝播(Horizontal Gene Transfer; HGT)は自然界での微生物の多様性に大きく貢献していることが知られている(1, 2).HGTの分子メカニズムは,ファージによる「形質導入(transduction)」,type IV secretion systemによる「接合伝達(conjugation)」,そして細胞外核酸による「自然形質転換(natural genetic transformation)」の3つに大別される.
https://www.ncbi.nlm.nih.gov/pubmed/26439115 PLoS Comput Biol. 2015 Oct 6;11(10):e1004408. Detecting Horizontal Gene Transfer between Closely Related Taxa.
https://www.ncbi.nlm.nih.gov/pubmed/26184597 Nat Rev Genet. 2015 Aug;16(8):472-82. Horizontal gene transfer: building the web of life.
24 August 2015. https://www.jstage.jst.go.jp/article/jjprotozool/48/1-2/48_31/_article/-char/ja/ Review 微生物生態系における細菌の遺伝子水平伝播現象 - 日本原生生物学会 松井一彰 著 Bacterial HGTs are mediated by one of three mechanisms: transformation, conjugation, or transduction. https://www.jstage.jst.go.jp/article/jjprotozool/48/1-2/48_31/_pdf http://protistology.jp/journal/jjp48/JJP48MATSUI.pdf 形質導入による遺伝子水平伝播に関わる因子
また海洋を模し た形質導入の実験結果を元に,Tampa Bay の汽水域 (アメリカフロリダ州)における形質導入頻度を求 めた研究では,一年間に 1.3 × 10¹⁴ 回の形質導入が Tampa Bay で起こっていると見積もられている (Jiang and Paul, 1998).
遺伝子水平伝播の検出には「系統情報」や「塩基組成」に基づく手法が用いられる。 https://en.wikipedia.org/wiki/Inferring_horizontal_gene_transfer http://topicpageswiki.plos.org/wiki/Inferring_horizontal_gene_transfer https://www.ncbi.nlm.nih.gov/pubmed/26020646 PLoS Comput Biol. 2015 May 28;11(5):e1004095. Inferring horizontal gene transfer.
2014年6月16日 https://www.brh.co.jp/salon/shinka/2014/post_000009.php 水平遺伝子伝搬 | JT生命誌研究館
2004 June http://www.origin-life.gr.jp/3202/3202121/3202121.html 生態系における広宿主域遺伝子伝達粒子の意義
- 自然界での遺伝子伝播形式の生物学と,その生態系への寄与 i. 形質転換(Transformation): ii. 接合(Conjugation): iii. Transduction(形質導入):
http://www.au-techno.com/microbio/microbio_body.htm 微生物学用語 形質転換 (transformation:けいしつてんかん) 形質導入 (transduction:けいしつどうにゅう) 接合 (conjugation:せつごう)
https://www.ncbi.nlm.nih.gov/pubmed/24387194 BMC Genomics. 2014 Jan 3;15:8. doi: 10.1186/1471-2164-15-8. ITEP: an integrated toolkit for exploration of microbial pan-genomes. Benedict MN, Henriksen JR, Metcalf WW, Whitaker RJ, Price ND1. https://www.ncbi.nlm.nih.gov/pmc/articles/PMC3890548/ Analysis of core and variable gene content Studying gene gain and loss and examining the core (conserved) and variable (non-conserved) genes in a collection of organisms can provide insights into the plasticity of cellular functions and can be used to identify genes that define a clade [47]. Ochman H, Lerat E, Daubin V. Examining bacterial species under the specter of gene transfer and exchange. Proc Natl Acad Sci USA. 2005;15(Suppl 1):6595–6599. [PMC free article] [PubMed]
https://www.ncbi.nlm.nih.gov/pubmed/21170026
Nature. 2011 Jan 6;469(7328):93-6. doi: 10.1038/nature09649. Epub 2010 Dec 19.
Rapid evolutionary innovation during an Archaean genetic expansion.
David LA1, Alm EJ.
gene birth, transfer, duplication and loss events
http://almlab.mit.edu/angst.html
the proposal of a series of horizontal gene transfer (HGT), gene duplication (DUP) and gene loss (LOS) events to explain observed distributions of orthologous genes amongst extant prokaryotic genomes.

https://www.ncbi.nlm.nih.gov/pubmed/20551134 Bioinformatics. 2010 Aug 1;26(15):1910-2. doi: 10.1093/bioinformatics/btq315. Epub 2010 Jun 15. Count: evolutionary analysis of phylogenetic profiles with parsimony and likelihood. Csurös M1. It implements popular methods employed in gene content analysis such as Dollo and Wagner parsimony, propensity for gene loss, as well as probabilistic methods involving a phylogenetic birth-and-death model. http://www.iro.umontreal.ca/~csuros/gene_content/count.html
https://www.ncbi.nlm.nih.gov/pubmed/20376325 PLoS One. 2010 Apr 1;5(4):e9989. doi: 10.1371/journal.pone.0009989. A benchmark of parametric methods for horizontal transfers detection. Becq J1, Churlaud C, Deschavanne P. https://www.ncbi.nlm.nih.gov/pmc/articles/PMC2848678/ Some methods such as GCtotal, GC1-GC3,
https://pubmed.ncbi.nlm.nih.gov/19864285/ Review Proc Biol Sci . 2010 Mar 22;277(1683):819-27. doi: 10.1098/rspb.2009.1679. Epub 2009 Oct 28. Horizontal gene transfer in evolution: facts and challenges Luis Boto 1 https://royalsocietypublishing.org/doi/10.1098/rspb.2009.1679 https://www.ncbi.nlm.nih.gov/pmc/articles/PMC2842723/ secondly, about the extent of horizontal gene transfer towards different evolutionary times.
For example, it has been shown that the integration of a single transferred gene into regulatory interaction networks is very slow (Lercher & Pál 2008) in the case of genes providing the receptor with new functions, and it is dependent on the number of partners for the gene product in the regulatory network, according to the complexity hypothesis. 例えば、受容体に新しい機能を与える遺伝子の場合、1つの転移遺伝子が調節相互作用ネットワークに統合されるのは非常に遅く(Lercher & Pál 2008)、複雑性仮説によれば、調節ネットワークにおけるその遺伝子産物のパートナーの数に依存することが示されている。
水平伝播した遺伝子が調節相互作用ネットワークに統合されるには、何百万年もかかる https://pubmed.ncbi.nlm.nih.gov/18158322/ Mol Biol Evol . 2008 Mar;25(3):559-67. doi: 10.1093/molbev/msm283. Epub 2007 Dec 24. Integration of horizontally transferred genes into regulatory interaction networks takes many million years Martin J Lercher 1, Csaba Pál https://academic.oup.com/mbe/article/25/3/559/1060663 Fine-tuned integration of horizontally transferred genes into the regulatory network spans more than 8-22 million years and encompasses accelerated evolution of regulatory regions, stabilization of protein-protein interactions, and changes in codon usage. 水平伝播した遺伝子は、800万年から2200万年の間に、制御領域の加速的進化、タンパク質間相互作用の安定化、コドン使用量の変化などを経て、制御ネットワークにきめ細かく統合された。
https://www.ncbi.nlm.nih.gov/pubmed/18632554 Proc Natl Acad Sci U S A. 2008 Jul 22;105(29):10039-44. doi: 10.1073/pnas.0800679105. Epub 2008 Jul 16. Modular networks and cumulative impact of lateral transfer in prokaryote genome evolution. Dagan T1, Artzy-Randrup Y, Martin W.
https://www.ncbi.nlm.nih.gov/pubmed/18366724 BMC Genomics. 2008 Mar 24;9:136. doi: 10.1186/1471-2164-9-136. Estimating the extent of horizontal gene transfer in metagenomic sequences. Tamames J1, Moya A. https://www.ncbi.nlm.nih.gov/pmc/articles/PMC2324111/ We have created two different methods that are suitable for the study of HGT in metagenomic samples. The methods are based on phylogenetic and DNA compositional approaches, and have allowed us to assess the extent of possible HGT events in metagenomes for the first time. The methods are shown to be compatible and quite precise, although they probably underestimate the number of possible events. Our results show that the phylogenetic method detects HGT in between 0.8% and 1.5% of the sequences, while DNA compositional methods identify putative HGT in between 2% and 8% of the sequences. These ranges are very similar to these found in complete genomes by related approaches. Both methods act with a different sensitivity since they probably target HGT events of different ages: the compositional method mostly identifies recent transfers, while the phylogenetic is more suitable for the detections of older events.
https://www.ncbi.nlm.nih.gov/pubmed/18174121 Microbiology. 2008 Jan;154(Pt 1):1-15. doi: 10.1099/mic.0.2007/011833-0. Are all horizontal gene transfers created equal? Prospects for mechanism-based studies of HGT patterns. Zaneveld JR1, Nemergut DR, Knight R. http://mic.microbiologyresearch.org/content/journal/micro/10.1099/mic.0.2007/011833-0#tab2 Mechanisms of intercellular DNA transfer include conjugation, phage transduction, and transformation.
https://www.ncbi.nlm.nih.gov/pubmed/15653627 Nucleic Acids Res. 2005 Jan 13;33(1):e6. Detection and characterization of horizontal transfers in prokaryotes using genomic signature. Dufraigne C1, Fertil B, Lespinats S, Giron A, Deschavanne P. https://www.ncbi.nlm.nih.gov/pmc/articles/PMC546175/
https://pubmed.ncbi.nlm.nih.gov/12902542/ Review Proc Natl Acad Sci U S A . 2003 Aug 19;100(17):9658-62. doi: 10.1073/pnas.1632870100. Epub 2003 Aug 5. Horizontal gene transfer: a critical view C G Kurland 1, B Canback, Otto G Berg https://www.pnas.org/doi/full/10.1073/pnas.1632870100 In E. coli the overall rate of import has been estimated at 10–6 genes per cell per generation (6, 37, 39). If one in a thousand is a possible replacement and one in a hundred of these is neutral, the rate of gene replacement in E. coli would be one per 109 years. 大腸菌では、全体の輸入速度は1世代あたり細胞あたり10-6個の遺伝子と見積もられている(6, 37, 39)。1000個に1個が置換の可能性があり、そのうち100個に1個が中立であるとすると、大腸菌における遺伝子の置換速度は109年に1個ということになる。 The residence time of a neutral coding sequence in E. coli seems to be <1 million years (6, 37, 39). 大腸菌における中性コード配列の滞留時間は100万年未満と思われる(6, 37, 39)。
https://www.ncbi.nlm.nih.gov/pubmed/11076857 Genome Res. 2000 Nov;10(11):1719-25. Horizontal gene transfer in bacterial and archaeal complete genomes. Garcia-Vallvé S1, Romeu A, Palau J. https://www.ncbi.nlm.nih.gov/pmc/articles/PMC310969/ total and positional G+C contents (G+C[T], G+C[1], G +C[2] and G+C[3]), We considered genes as extraneous in terms of the G+C content if their G+C(T) content deviated by >1.5σ from the mean value of their genome or if deviations of G+C(1) and G+C(3) were of the same sign and at least one was >1.5σ.
Karlin S (2001) Trends Microbiol. "Detecting anomalous gene clusters and pathogenicity islands in diverse bacterial genomes." | pdf
http://virtualgenomeproject.blogspot.com/ Virtual Genome Project Blog
http://virtualgenomeproject.blogspot.com/2008/12/functions-of-horizontally-transferred.html Virtual Genome Project Blog: Functions of horizontally transferred genes
http://virtualgenomeproject.blogspot.com/2008/09/contribution-of-horizontal-gene.html Virtual Genome Project Blog: Contribution of horizontal gene transfer to microbial evolution
http://virtualgenomeproject.blogspot.com/2008/07/reticulate-classification-of-mobile.html Virtual Genome Project Blog: Reticulate classification of mobile genetic elements
https://nextstrain.org/help/general/how-to-read-a-tree How to interpret the phylogenetic trees
https://artic.network/how-to-read-a-tree.html How to read a phylogenetic tree Revision Date: 2018-07-30
https://archosaurmusings.wordpress.com/2008/12/18/how-to-read-a-phylogenetic-tree/ How to read a phylogenetic tree | Dave Hone's Archosaur Musings basal taxa (at the bottom of the tree)
2:30 AM · May 14, 2022 https://twitter.com/jilloberski/status/1525166721161523202 Jill Oberski 🐜 on Twitter: "Maybe a hot take: I think circular phylogenies are a bad choice for manuscript figures. They’re hard to read and hard to interpret." / Twitter
6:40 PM · Sep 24, 2020 https://twitter.com/copypasteusa/status/1309065045201096704 "Tree A is in polar format (often called a circle tree). These tree formats are often used to make a big visual impact in papers but generally have reduced readability - it is difficult to compare how far nodes are from the centre. They are best avoided. https://artic.network/how-to-read-a-tree.html
Feb 5, 2021 https://twitter.com/windowmoon/status/1357643379950067715 だからあれほど円形系統樹は使うなと小一時間以下略。今回の例は一方向の系統樹にしても解釈が分かれそう。わたしは「どちらとも言えない」派かな。 https://twitter.com/mutselbalance/status/1357642470587199490 丸い系統樹で書いてしまうと、人間の遠近感覚には多様性があるため、解釈が困難になってしまう……その好例。僕には近いように見える…。 https://twitter.com/Parapriacanthus/status/1357629304788590592 長寿の木は進化的に離れた系統でみられる https://twitter.com/sPlot_iDiv/status/1357249814178725900 How old do trees grow? Why and where? All answers in a #TansleyReview by #GianlucaPiovesan and #FrancoBiondi in @NewPhyt https://nph.onlinelibrary.wiley.com/doi/full/10.1111/nph.17148 On tree longevity
2:02 PM · Sep 24, 2020 https://twitter.com/windowmoon/status/1308995216729399296 窓月@S級在宅士 on Twitter: "何度も言ってますが、円形系統樹は害悪です。かっこいいだけで見やすくない。科学者なら使うべきではない。本当にやめてほしい。" / Twitter Most tree plotting programs have "collapse branches" function. Therefore, I recommend to use this function and plot "collapsed" whole tree and several subtrees of "collapsed" branches.
5:35 PM · Mar 19, 2019 https://twitter.com/windowmoon/status/1107923607349424129
- 相変わらず皆さん円形系統樹好きですね。見づらいからやめろ。
- 円形系統樹って、「デザイン的にカッコいい」以外のメリットあるんでしょうかね?
- 一切ないと思います。有害無益。禁止すべき。円グラフみたいなものですね。
12:58 AM - 19 Mar 2019 https://twitter.com/Tyu_Shi/status/1107868946269519872 Megaphylogeny resolves global patterns of mushroom evolution https://www.nature.com/articles/s41559-019-0834-1 … キノコのTimetree論文。
https://nam-students.blogspot.com/2013/03/blog-post_2476.html NAMs出版プロジェクト: 全生物の系統樹、円形バージョン:メモ
https://en.wikipedia.org/wiki/Sister_group https://ja.wikipedia.org/wiki/姉妹群
https://ja.wikipedia.org/wiki/創始者効果
https://ja.wikipedia.org/wiki/適応放散
https://www.digitalatlasofancientlife.org/learn/systematics/phylogenetics/reading-trees/ 2.1 Reading Trees - Digital Atlas of Ancient Life
2.1 Reading Trees Chapter contents: Systematics — 1. Taxonomy — 2. Phylogenetics —— 2.1 Reading trees ← —— 2.2 Building trees —— 2.3 Character mapping —— 2.4 Phylogenetic trees and classification
Clades and Sister Groups A clade (from the Greek klados = branch) is a group that includes an ancestor (node) and all of its descendants (all shallower nodes and terminal taxa that descend from that node) on a phylogenetic tree.
http://www.saitama-u.ac.jp/ohnishi/jikken/phylogenetic_methods.htm 系統樹の基礎知識 (図参照) Node(節)とBranch(枝)から成っている.NodeにはExternal Nodes (右端の現生の [生物あるいは配列] (以下では配列とのみ記述)) と系統樹内のInternal Nodes (過去に存在した,あるいは,存在したと推定される配列) がある(図(1)).Root (R)は仮想的な共通祖先 (Common ancestor). また,Internal Nodesにはbifurcating (2鎖分岐)とmultifurcating (多鎖分岐) するものの2種類がある.原則的には,2鎖分岐のはずだが,分岐の順序が正確に決まらない場合は,multifurcatingの形に表示される.(下図 (2)右のN1)
https://www.kochi-u.ac.jp/w3museum/Fish_Labo/Member/Endoh/animal_taxonomy/termonology01.html 1.分類学に関するおもな用語 更新日:2017.4.14
2.系統学に関する用語
phenetics, phenetic classification:表形学,表形分類 *phenetists 表形学者 A system of classification in which the organisms are grouped together on the basis of their overall similarity*. *総類似度,総体的類似度 *phenotype は表現形
numerical taxonomy:数量分類学;numerical phenetics:数量表形学 ★表形分類では基本的にすべての形質を等価と見なし,形質の共有を数量的に処理してグルーピングするため,数量分類学とも呼ばれる.
cladistics, cladistic classification:分岐学,分岐分類 *cladists 分岐学者 A system of classification in which the only groups formally recognized are clades. ★分岐分類では,共有派生形質で支持される単系統群に基づいてグルーピングする.祖先形質の共有は系統関係を示さない.内群と外群を含めたグループを最節約法で解析し,系統関係を推定する(内群の形質の極性も推定される).
https://quizlet.com/153288496/chpt-261-263-flash-cards/ Chpt. 26.1-26.3単語カード | Quizlet branch points -in picture, point 3 is common ancestor of A, B, C -4 shows that taxa B and C diverged after their shared lineage split from lineage leading to A

http://lbm.ab.a.u-tokyo.ac.jp/~omori/phylogeny/txt/phylogeny_txt.html Morecular phylogeny 2015年度生物測定学応用実験 分子系統樹 東京大学大学院農学生命科学研究科 大森宏 2016年 1月 4日
- 塩基置換の確率モデル
- 系統樹作成手法 参考文献 分子進化遺伝学,根井正利,(Molecular Evolutionary Genetics, 五條堀孝・斎籐成也 共訳,根井正利 監訳), 培風館,1990.
http://nesseiken.info/Chiba_lab/index.php?cmd=read&page=授業%2FH24%2F進化生物学I%2F系統樹に関する基本用語 系統推定の基本用語
https://ja.wikipedia.org/wiki/退化 一般語としての退化は進化の対義語と位置づけられ得る[2]が、生物学において退化は進化の一側面であり、対義語ではない[3]。
Tomoaki NISHIYAMA Wed Dec 27 18:49:55 JST 2000 http://www.nibb.ac.jp/~tomoaki/protocols/genetree/words 用語集

https://ja.wikipedia.org/wiki/非加重結合法 (Unweighted Pair Group Method with Arithmetic mean、UPGMAと略す)は系統樹を作製するためのボトムアップ式のクラスタ解析法である。入力データは対象の各ペア間の距離であり、有根系統樹が作製される。進化速度が一定(分子時計仮説)と仮定して有根系統樹を作製するのにときどき用いられる。 UPGMAは進化速度一定の仮定を用いているため、これが対象に関して正しいことが示されない限り、系統樹の推定に適した方法ではない。 やはり距離を用いる方法であるが上記の仮定を要しないものに近隣結合法(NJ法)がある。 https://ja.wikipedia.org/wiki/近隣結合法
https://shorebird.hatenablog.com/entry/20180601/1527842963 「系統体系学の世界」 - shorebird 進化心理学中心の書評など
https://twitter.com/hashtag/ws222
https://github.com/haruosuz/bioinfo/blob/master/2019/CaseStudy.md#ws222 第222回農林交流センターワークショップ「分子系統樹推定法:理論と応用」
https://www.fifthdimension.jp/documents/molphytextbook/ 分子系統学演習 - データセットの作成から仮説検定まで
https://www.fifthdimension.jp/documents/molphytextbook/answers.pdf 分子系統解析における様々な問題について
タクソンサンプリング法

● 全種サンプリングは必ずしも良くない
● 系統樹上の分岐点・端点の密度ができるだけ偏らない方が良い
– 同一配列や近縁配列が一部では多く一部では少ないのは×
https://togetter.com/li/742642 2014年度・第188回農林交流センターワークショップ〈分子系統学の理論と実習〉ツイートまとめ
https://togetter.com/li/587872 2013年度・第176回農林交流センターワークショップ〈分子系統学の理論と実習〉ツイートまとめ
https://togetter.com/li/399359 2012年度・第166回農林交流センターワークショップ〈分子系統樹推定法:理論と応用〉 ツイートまとめ
10:03 PM · Mar 6, 2023 https://twitter.com/M123Takahashi/status/1632728666873696261 高橋将宜 Masayoshi Takahashi on X: "確かにt検定、分散分析、回帰分析を同じ枠組みで考えられることに言及している書籍は少ないかもしれませんね。なお、拙著『統計的因果推論の理論と実装』p.43と岩崎先生の『統計的因果推論』p.50では、説明変数にダミー変数のみを用いた回帰分析は2標本t検定と同じであることに言及しています。" / X
6:35 AM · Feb 25, 2020 https://twitter.com/gekkou583/status/1232056543006183424 トリウマ on Twitter: "いわゆる『ゾウの時間 ネズミの時間』説に対する疑義。内温性外温性含む陸上性脊椎動物4100種のデータ比較、代謝速度と寿命に負の相関があるという‘rate‐of‐living’ 理論は証明されず、その平均寿命は外因によるところが大きいとのこと。 https://t.co/Du5H6OmwQw" / Twitter https://onlinelibrary.wiley.com/doi/full/10.1111/geb.13069 No evidence for the ‘rate‐of‐living’ theory across the tetrapod tree of life
10:53 AM · Dec 10, 2019 https://twitter.com/JunShimizu/status/1204217634662731776 Junichi Shimizu / 清水準一 on Twitter: "気をつけたい。 関西学院大学の清水先生のブログ「都道府県単位の分析、国単位の分析は、いろいろ罠があるので気をつけようね、というお話でした。」 納豆と牛肉の「イケナイ」関係:空間的自己相関のモデリング | Sunny side up! https://t.co/JvGfvTWF2Y" / Twitter 2019年12月10日 by norimune http://norimune.net/3313 納豆と牛肉の「イケナイ」関係:空間的自己相関のモデリング | Sunny side up!
2019-06-15 http://www.unp.or.jp/ISBN/ISBN978-4-8158-0950-8.html 生命科学の実験デザイン[第4版] « 名古屋大学出版会 第5章 偽反復 5.1 独立とはどういうことか、偽反復とは何か 5.2 偽反復のよくある原因 5.2.1 囲いの共有 5.2.2 共通の環境 5.2.3 血縁関係(類似の遺伝子) 5.2.4 刺激の共有 5.2.5 個体もまた環境の一部である 5.2.6 時間を追ってとった測定の偽反復 5.2.7 種間比較と偽反復 5.3 非独立性に対処する 5.3.1 反復体の非独立性は生物学的な問題である
2016 年 https://www.jstage.jst.go.jp/article/sjpr/59/1/59_123/_article/-char/ja/ 統計学の現場は一枚岩ではない 三中 信宏 https://www.jstage.jst.go.jp/article/sjpr/59/1/59_123/_pdf 2.統計学の使用と誤用: 農業試験研究の場合 いったん実験や観察が開始されたならば,それらの初期設定を変えてはならないし,事後の統計解析は事前の実験計画に忠実に沿わなければならない。Fisher はイギリス王立統計学会の会長就任講演で,「実験終了後に統計学者に相談を持ちかけるのは,統計学者に,単に死後診察を行って下さいと頼むようなものである。統計学者はおそらく何が原因で実験が失敗したかという実験の死因について意見を述べてくれるだけであろう」(Fisher, 1953;Rao, 1997: 183 から引用)と述べたほどである。 ところが,私が見てきた農業試験研究の現場では必ずしもそうではない。たとえば,本来ならば「反復(replicate)」は別々の実験区から複数回抽出しなければならないにもかかわらず,同一の実験区から複数個のサンプルを抽出したもので代用するという「擬似反復(pseudoreplicate)」の誤用がきわめて多く見られると指摘されている(Hurlbert, 1984;山村,1999)。擬似反復を使えばたくさんの実験区を用意する必要がないからだ。これはもちろん「反復実施」の原則に反する。「無作為化」に違反して,無作為化すべき実験区をちゃんと無作為化しなかったという初歩的なミスもいまなおある。また,乱塊法のブロックの切り方があやふやな事例も少なからず見受けられる。まちがったブロック設置は「局所管理」の原則に抵触する危険がある。 このような実験計画法上の“誤用”を生む原因には,実験者がもともと実験区配置の理論を知らなかったとか,(農業試験場ではよくあることだが)前任者が実施した試験設計をそのまま継承せざるを得ないという情状酌量の余地がある場合もある。しかし,その一方で,得られたデータから何とか“有意” な検定結果を導き出すために故意に行われる“不正” の手口もいろいろ見聞きした。上述の「擬似反復」のほかにも,つごうの悪いデータに「外れ値(outlier)」という主観的なレッテルを貼って解析から除外するという事例もある。さらには,多要因実験で高次の交互作用項を恣意的に誤差とみなすことで,自由度を荒稼ぎして,検定結果を有意にもちこむというような“裏ワザ” が農業試験ではときどきある(「p 値ハッキング」の一例)。あるいは,実験前に仮定した統計モデルとは異なる分散分析を事後的に適用してしまうという事例もある。得られたデータを前にしてモデルそのものを操作するというこの“誤用” は「HARKing」そのもので,その動機は検定結果を有意にしたいという思惑である。このようなダークゾーンの「QRPs」は農業試験研究では相当前からあったものと推測される。
phylogenetic comparative methods
https://en.wikipedia.org/wiki/Phylogenetic_comparative_methods Phylogenetic comparative methods (PCMs) use information on the historical relationships of lineages (phylogenies) to test evolutionary hypotheses.
https://hydrodictyon.eeb.uconn.edu/people/plewis/courses/phylogenetics/lectures/2022/IndependentContrasts.pdf Fig. 5 from Felsenstein (1985) Fig. 6 from Felsenstein (1985b) Fig. 7 from Felsenstein (1985b)
https://www.jstor.org/stable/2461605 Joseph Felsenstein (1985) Phylogenies and the Comparative Method
FIG. 7.-The same data set, with the points distinguished to show the members of the 2 monophyletic taxa. It can immediately be seen that the apparently significant relationship of fig. 6 is illusory
https://pubmed.ncbi.nlm.nih.gov/34750532/ Nat Ecol Evol . 2021 Dec;5(12):1624-1636. doi: 10.1038/s41559-021-01573-2. Epub 2021 Nov 8. Plasmids do not consistently stabilize cooperation across bacteria but may promote broad pathogen host-range Anna E Dewar # 1, Joshua L Thomas # 2, Thomas W Scott 2, Geoff Wild 3, Ashleigh S Griffin 2, Stuart A West 2, Melanie Ghoul 2 https://www.ncbi.nlm.nih.gov/pmc/articles/PMC7612097/
Statistical tests typically assume that data points are independent, and even slight non-independence can lead to heavily biased results (type I errors)21,22. There is an extensive literature in the field of evolutionary biology showing that species share characteristics inherited though common descent, rather than through independent evolution, and so cannot be considered independent data points23–25. Genomes are nested within species, and genes are nested within genomes, multiplying this problem of non-independence, analogous to the problem of pseudoreplication in experimental studies26–29.
Why does using bacterial genomes as independent data points lead to a significant result? By using a Wilcoxon signed-rank test, at the level of the genome, we are implicitly assuming that all the genomes analysed are: (i) independent from one another; (ii) a representative sample of bacteria in nature. Neither of these are true for multi-species genomic datasets. First, due to shared ancestry, species are not independent from one another, and so neither are genomes in such analyses24,42. Even a slight lack of independence can lead to heavily biased results in statistical analyses and spurious conclusions21. Second, genomic databases tend to have a disproportionate abundance of certain species and genera. This will bias the results towards commonly sequenced species.
8:02 AM · Aug 6, 2020 https://twitter.com/wsdewitt/status/1291147602507862016 William DeWitt on Twitter: "Genome of the whale shark, Earth's largest fish—contributed by @geochurch and colleagues. Ostensibly extremely significant correlations are reported between physiological and genomic features across taxa, interpreted as evincing scaling laws. https://t.co/9EvT18ClPR (1/n)" / Twitter
For example, here are the first couple panels of Fig 2. Impressive p-values. But the species (points) in these correlations are phylogenetically related, so they are not independent samples, as it seems the simple correlation analysis done here assumes. History is shared. (2/n)
Not accounting for the null covariance structure induced by phylogeny seems like a problem. The effective number of independent samples is smaller, so statistical significance is inflated. Shared evolutionary history means independent traits will appear linked (3/n)
Joe Felsenstein showed how to do this correctly in 1985 using phylogenetically independent contrasts. It's a widely known paper (although perhaps not widely enough). American Naturalist has a recent piece on the history and impact of Joe's paper: https://journals.uchicago.edu/doi/10.1086/703055 (4/n)
To demonstrate the problem, Joe considers two independent traits randomly evolving on this phylogeny (according to independent Brownian motion for each trait) (5/n)
If you measure the two traits for each species (the tips of the tree) and make a scatter plot, it looks like they're correlated. (5/n)
But this is an artifact of the phylogeny. If we annotate the points by which clade they came from, the correlation disappears. The traits are independent, but the samples are not. Samples within a clade share most of their random history. (6/n)
Although the correlation analysis and p-values in this new paper are not meaningful, it would be interesting to see if the scaling relationships held up to a phylogenetically correct analysis. Also, having the whale shark genome is totally awesome (🦈/n)
10:22 AM · Dec 26, 2021 https://twitter.com/9w9w9w92/status/1474913385733312517 尾上正人 on Twitter: "「ひとつの現生種をひとつのデータ点だと単純に見て相関などを調べることにより形質の進化を検討すると、ある枝で起こった同じ進化的変化を別の現生種を見て何度もくりかえし評価してしまうことになる。統計的な言い方では、誤ってデータ点すなわち現生種が独立であると仮定してしまっている」58頁" / Twitter 9:17 PM · Dec 24, 2021 https://twitter.com/9w9w9w92/status/1474353642673426432 石川統・斎藤成也・佐藤矩行・長谷川眞理子編(2005)『進化学の方法と歴史 シリーズ進化学7』岩波書店
6:42 AM · Jan 13, 2020 https://twitter.com/vsbuffalo/status/1216475530066743296 Vince Buffalo on Twitter: "A question for comparative methods folks: when we think about patterns across extremely broad taxonomical groups, such as the body length and generation time (Bonner 1983) and body size and pop density (Damuth 1987), does it make sense to correct for phylogeny? https://t.co/0Ggr9uEAJA" / Twitter
2019-09-25 https://eprints.lib.hokudai.ac.jp/dspace/bitstream/2115/76072/1/Yusaku_OHKUBO_abstract.pdf Author(s) 大久保, 祐作 Citation 北海道大学. 博士(環境科学) 甲第13743号 On the phylogenetic comparative analysis of directional evolution by Approximate Bayesian Computation (近似ベイズ計算を用いた方向性進化の分析について) 系統比較法 (Phylogenetic Comparative Method; PCM 系統種間比較とも呼ばれる)は、生物の形質進化を 分析する統計的な手法であり、近年生態学や進化学を中心に非常に重要な役割を果たしている。しかしこれ まで多くの系統比較法は、形質の従う進化としてブラウン運動モデルやOrnstein-Uhlenbeckモデルなどのご く限られたプロセスを仮定しており、生物進化の中で最も重要なプロセスの1つである方向性進化をどのよ うに分析するべきか十分検討されてこなかった。そこで本研究は、既存のPCMにおける方向性進化の分析に おける問題点を指摘し、新たな分析方法を提案した。また、その成果を先行研究の再分析とシミュレーショ ン実験で確認した。
https://pubmed.ncbi.nlm.nih.gov/27536807/ J Evol Biol . 2016 Dec;29(12):2422-2435. doi: 10.1111/jeb.12966. Epub 2016 Sep 9. A comparative perspective on longevity: the effect of body size dominates over ecology in moths S Holm 1, R B Davis 1, J Javoiš 1, E Õunap 1 2, A Kaasik 1, F Molleman 1 3 4, T Tammaru 1 https://onlinelibrary.wiley.com/doi/full/10.1111/jeb.12966 Phylogenetic comparative analyses were applied to study variation in species‐specific values of lifespan and to reveal its ecological and life‐history correlates.
https://pubmed.ncbi.nlm.nih.gov/27499839/ Methods Ecol Evol . 2016 Jun;7(6):693-699. doi: 10.1111/2041-210X.12533. Epub 2016 Jun 13. Shedding light on the 'dark side' of phylogenetic comparative methods Natalie Cooper 1, Gavin H Thomas 2, Richard G FitzJohn 3 https://www.ncbi.nlm.nih.gov/pmc/articles/PMC4957270/ https://www.nhm.ac.uk/our-science/our-work/origins-evolution-and-futures/phylogenetic-comparative-methods.html Phylogenetic comparative methods can be used to investigate the relationships between body size, life span and flight
https://www.esj.ne.jp/meeting/abst/62/T02-4.html 日本生態学会第62回全国大会 (2015年3月、鹿児島) 系統種間比較法(PCM: phylogenetic comparative methods)は種間の系統関係を考慮した形質比較を行う手法であり,適応進化を検証するうえで有力なアプローチである.これまで,量的形質に関する分析では系統一般化最小二乗法(PGLS: phylogenetic generalized least squares)が用いられることが多かった.しかし,PGLSは形質進化が基本的にブラウン運動(ランダム浮動)に従うことを仮定するため,検証できるモデルが限られる.一方で,近年開発された近似ベイズ計算(ABC: approximate Bayesian computation)を用いた系統種間比較(ABC-PCM; Kutsukake & Innan 2013)ではより柔軟なモデルも検証できる.
https://www.fifthdimension.jp/wiki.cgi?page=FrontPage&file=20100522BiometricsJapanPreprint%2Epdf&action=ATTACH 田辺晶史, 2010, "ベイジアンMCMCによる生物間系統関係の推定法"
生物学における系統樹の必要性
系統樹は、表現型形質などをその上に配置 (祖先形質復 元) したりすることで進化の過程を明らかにすることがで きる。
そもそも、これまでに「系統的に独立した生物」は確認 されていない。そのため、統計解析上の最も重要な仮定の一つである「サンプル間の独立 性」が生物では成立し得ないことは明白である。 系統関係=サンプル間の非依存性を考慮して統計解析を行うことでこのような問題を 解決しようとする手法があり、系統的独立比較法などと呼ばれている (Felsenstein, 1985; Grafen, 1989)。これが系統樹の第 2 の用途である。
系統樹の第 3 の用途は、多様性の定量化である。
https://www.ikushimo.com/news/2009/03/23.html ◆ [Science] 空間自己相関と時間自己相関、そして系統自己相関 - 00:45:32 空間自己相関がある(空間的に近い点は互いに似ている)データを独立データと見なして解析してはいけない、というのが「自己相関と偽反復」企画集会の趣旨でした。もちろん、自己相関があるのは空間だけではなく、時間にもあります。時間自己相関を考慮した解析は昔からあり、時系列解析と呼ばれる解析方法群がそれに当たります。 また、時間自己相関の1種と言えるかもしれませんが、系統的に近い生物は互いに似ているという系統自己相関も存在します。これをちゃんと考慮に入れてやろうというのが、系統自由集会でもう一人の演者が話した「系統的独立比較」(Phylogenetic Independent Contrast)です。 しかし、空間自己相関には実は他の二つとは大きく異なる点があります。それは、「跳躍」があり得るという点です。
http://leeswijzer.org/files/seibutsu-keitou.html 5-1-1-2:懊悩-統計的独立の問題 334 統計的独立の問題。種間に系統関係があるならば、統計学的にみてデータ点は独立ではあり得ない。(三中信宏「生物系統学」334ページ) FIG.2. データ点が独立 FIG.3. データ点が非独立
- https://lukejharmon.github.io/pcm/
- https://lukejharmon.github.io/pcm/chapters/
- https://lukejharmon.github.io/pcm/chapter1_introduction/ Introduction · Phylogenetic Comparative Methods
https://lukejharmon.github.io/pcm/pdf/phylogeneticComparativeMethods.pdf Phylogenetic Comparative Methods Luke J. Harmon 2019-3-15
https://lukejharmon.github.io/pcm/chapter6_beyondbm/ Beyond Brownian motion · Phylogenetic Comparative Methods https://lukejharmon.github.io/pcm/chapter6_beyondbm/#section-6.3a-rate-tests-using-phylogenetic-independent-contrasts
Section 6.3a: Rate tests using phylogenetic independent contrasts
In particular, Garland (1992) suggests using a t-test, as long as the absolute value of independent contrasts are approximately normally distributed. However, under a Brownian motion model, the contrasts themselves – but not the absolute values of the contrasts – should be approximately normal, so it is quite likely that absolute values of contrasts will strongly violate the assumptions of a t-test.
A t-test is not significant (Welch two-sample t-test P = 0.42), but we also can see that the distribution of PIC absolute values is strongly skewed (Figure 6.2C).
Alternatively, we can again follow Garland’s (1992) suggestion and use a Mann-Whitney U-test, the nonparametric equivalent of a t-test, on the absolute values of the contrasts.
https://ja.wikipedia.org/wiki/T検定 標本が独立で、等分散性が仮定できない(異分散)場合。これは正確にはウェルチのt検定と呼ばれる。 t検定は母集団の正規分布を前提とするパラメトリック検定であるが、この条件が満たされず、さらに標本サイズが小さいと、t検定で近似することも困難となる。そういった場合にはノンパラメトリック検定を用いる方法がある。 標本が独立ならばマン・ホイットニーのU検定など
Brownian motion ブラウン運動モデル
http://www.phytools.org/***SanJuan2016/ex/5/Fitting-BM.html Exercise 5.2: Fitting Brownian motion models
https://lukejharmon.github.io/ilhabela/instruction/2015/07/04/multi-regime-models/ Multi-rate, multi-regime, and multivariate models for continuous traits Jul 4, 2015 This tutorial is about fitting multi-rate Brownian motion models (using phytools), multi-regime OU models (using the OUwie package), and multivariate Brownian models (using phytools). Written by Liam J. Revell. Last updated July 4, 2015
http://phytools.org/eqg/Exercise_4.1/ Simulating Brownian motion in R Written by Liam J. Revell. Last updated Aug. 8, 2013
6:59 PM · Jul 6, 2018 https://twitter.com/tharano34/status/1015173437885538305 系統種間比較では、形質の進化にブラウン運動モデルを仮定するのが一般的である。ブラウン運動モデルでは、進化の方向と変化量がランダムに変化する。このモデルに対して、ネコ科系統樹内でウンピョウ、スミロドン、ホモテリウムのそれぞれに至る枝に、方向性選択の効果を表すパラメータを組み込んだ。
https://sites.google.com/site/nkutsukake/research/phenotype/pcms a. 系統種間比較 - nkutsukake 研究 > 2. 表現型の進化・多様性 > a. 系統種間比較 JSTさきがけ研究「表現型の進化モデルと系統種間比較から適応進化を明らかにする計算行動生態学」 の最終報告書です。 動物の行動や表現型形質の適応的意義を考察する際、生物進化の歴史である系統関係を考慮することが必要不可欠である。その理由として、進化の歴史を最近まで共有してきた近縁な二種は、形質が類似することが多く、統計的に独立であるとみなせないためである。Felsenstein (1985, Am Nat)に始まる系統種間比較 (phylogenetic comparative methods) と呼ばれるアプローチでは、現世種にみられる形質の種間比較から、進化のプロセス(進化速度、進化モード、祖先形質)を推定することが可能である(沓掛 2012 行動生態学)。現在までに、系統種間比較を用いた研究は数多く行われ、適応進化に関する多くの知見をもたらしてきた。しかし、従来の系統種間比較には、単純な進化モデルしか検証することしかできないという欠点が存在した。多くの系統種間比較法において、表現型の進化モデルとして用いられるものがブラウン運動Brownian motionである。この進化モードは中立進化に相当し、適応進化の検出を主目的とする研究において有用なモデルと見なせるかどうかについては議論があった。ブラウン運動に基づくモデルを拡張し、異なる進化速度を持つ複数のブラウン運動による進化、進化速度の加速・減速を伴うブラウン運動などを想定した手法も開発されてきたが、これらも先述の議論に答えを与えるものではない。そのため、系統樹上で複数の進化モードが混在する進化モデルのもと、各パラメーターの推定、さらには複数の進化モデルの統計的に比較する手法は限定されてきた。さらに、多くの手法では形質の種内変異が考慮されていなかった。 この現状は、遺伝子型を対象にした系統関連の分析手法が大きく発展している状態とは対照的である。とくに、遺伝子型の研究で頻用されている計算機的手法やベイズ統計学は、表現型を対象にした系統種間比較では十分に導入されていない。 これらの問題点をふまえ、本研究では新しい系統種間比較の理論・分析手法を開発した(図1)。開発した分析手法を進化・行動生態学の実証的研究に適用し、従来の研究では実現できなかった適応進化プロセスの推定を行った。
https://www.jsps.go.jp/j-biol/29_pastrecipients_speach.html 国際生物学賞|日本学術振興会 第29回国際生物学賞 受賞者あいさつ ジョセフ・フェルゼンシュタイン博士 Dr. Joseph Felsenstein
最初は系統樹の推定という問題に最尤法という統計学的手法を取り入れました。その結果、エドワーズとカヴァッリ=スフォルツァの先駆的な論文で提起された問題のいくつかを解決することができました。彼らの論文の内容は、系統樹の進化過程の推定に、遺伝子頻度の変化を表すブラウン運動モデルを利用するというものでした。1973年、私は系統樹の尤度を計算するための効率的な動的プログラミング・アルゴリズムを作成し、1981年には、そのアルゴリズムをDNA塩基配列データに応用しました。
http://www.ecology.kyoto-u.ac.jp/~ushio/rstat/20101126PhyloAnal.pdf 統計セミナー第6回 2010年11月26日 「系統解析」 川北 篤 系統的最小二乗法 PhylogeneTc generalized least squares (PGLS) method •系統的独立対比の拡張版 •ブラウン運動モデルを補正し、系統の効果を 調節する •α parameter 0のときブラウン運動モデルと同じ 大きい値をとるほど系統の効果がなくなる
20090903EvoJapanPoster.pdf Untitled - Akifumi S. Tanabehttps://www.fifthdimension.jp › wiki PDF 従来の分子進化速度がブラウン運動すると仮定した分岐年代推定法では分岐の一方では加速、 ... 従来法と、分岐の両方で加速や両方で減速を採用しやすい「定向進化的モデル」を仮定した ... 系統樹:有胎盤哺乳類の最尤系統樹 (Murphy et al.
2008年 福岡 https://www.esj.ne.jp/meeting/abst/55/P3-159.html 日本生態学会全国大会 ESJ55 講演要旨 一般講演(ポスター発表) P3-159 形質進化における自然選択と遺伝的浮動の相対的な重要性:ブラウン運動モデルとの比較 *遠山弘法(九大・理・生態), 矢原徹一(九大・理・生態) 選択と浮動の相対的な重要性を明らかにするために、系統樹を基にした解析を行った。具体的には、系統樹と形質値から推定される対比を用いて、中立(ブラウン運動モデル)を仮定した形質進化を10000回シミュレーションし、実データとの比較を行った。
https://en.wikipedia.org/wiki/Computational_phylogenetics#Using_outgroups
https://en.wikipedia.org/wiki/Outgroup_(cladistics) In cladistics or phylogenetics, an outgroup[1] is a more distantly related group of organisms that serves as a reference group when determining the evolutionary relationships of the ingroup, the set of organisms under study,
https://en.wikipedia.org/wiki/Outgroup_(cladistics)#Choice_of_outgroup
To qualify as an outgroup, a taxon must satisfy the following two characteristics:
- It must not be a member of the ingroup.
- It must be related to the ingroup, closely enough for meaningful comparisons to the ingroup.
https://ja.wikipedia.org/wiki/外群 外群は、内群の他のグループに近縁であるが、しかし他のどの内群のグループよりも互いに遠縁であると考えられるものを選択する。 外群は内群の姉妹群、またはより遠縁なものである[2]。
外群の選択 最適な外群は以下の2つの条件を満足しなければならない。
- 内群に含まれてはならない
- 内群と意味のある比較ができるほど内群に近縁でなければならない
http://nesseiken.info/Chiba_lab/index.php?授業%2FH24%2F進化生物学I%2F系統樹に関する基本用語
- 内群(ingroup) 今、系統推定の対象としているグループのこと。
- 外群 (outgoup) 内群に含まれない分類群はすべて外群(outgroup)になる。外群は通常、系統樹に根をつけるときに使われ、内群の姉妹群から複数のものを用いることが多い。
2023/05/24 https://www.iu.a.u-tokyo.ac.jp/textbook/chapter6.html Web連携テキスト バイオインフォマティクス 第6章 生物配列統計学
page174 外群(outgroup) 系統関係を知りたい生物(これを内群といいます)の系統的位置関係を決定するに参照する群のことです。内群の他のグループに近縁であり、他のどの内群のグループよりも互いに遠縁であると考えられるものを選択するのが基本のようです。
有胎盤類 哺乳類と有袋類の中で、特に胎盤を有する動物の総称と理解すればよいです。有袋類のオポッサムは、胎盤を持たない(育児嚢をもつ)ので外群(outgroup)として取り扱えます。
6.6 分子系統樹
6.6.1 無根系統樹と外群、トポロジーと枝の長さ
2023年1月20日 https://note.com/fish_and_worms/n/n67cd44ebcebd Outgroupは何でもよいわけではありません。”少し違う”くらいがちょうどよいです。上の図は、キンギョとフナを比較するので、Outgroupとして同じコイ科のコイを使う感じです。
https://sci-tech.ksc.kwansei.ac.jp/~tohhiro/Systematics/Systematics-2-23.pdf 外群の利⽤ 研究対象である群:内群 (ingroup) 内群に対して遠い関係であることがわかっているもの:外群(outgroup), 外群を含めて系統樹を構築 全体としては無根系統樹だが、内群の根(root)を決めることができる。 今、種1~4(哺乳類)の系統関係を調べたい 根を導⼊するために種5(爬⾍類)を外群として導⼊
外群としてパラログを利⽤して3つのドメインの根を決定したのは 宮⽥隆のグループの研究 (Iwabe et al. 1989)
2012-10-31 https://togetter.com/li/399359?page=3 #166ws Outgroupの選定も重要。一本だけというのはあまりよくないことが多い。 #166ws ヘタに遠い外群をポツンと入れると「長枝誘引」の弊害が心配.
2011-07-13 https://togetter.com/li/161578?page=3 ある無根系統樹に「根」の情報を付け加えることで、複数の有根系統樹を導くことができます。したがって、無根系統樹は有根系統樹の「集合」とみなすことが可能です。逆にいえば、無根系統樹は「祖先」の概念を抜かれた系統樹ということもできます。(三中 2006: 171) 生物の系統樹を推定する場合には、対象となる生物群の中に少なくともひとつは「遠縁であると仮定された生物」を含めておきます。この生物を外群と呼びます。たとえば、ヒトを含む霊長類の系統関係を推定するときには、霊長類に含まれないサルが外群に指定されるでしょう。(三中 2006: 172) このような外群は、単に「遠縁であると仮定」されているだけですが、その仮定を置くことで対象生物群――外群に対して「内群(ingroup)」と呼ばれます――の系統樹に根をつけることができます。(三中 2006: 173)
2009年5月12日(火) http://isw3.naist.jp/IS/Kawabata-lab/LECDOC_KINDAI/2009/phylo_09May12.pdf ・根は適当な外群(out group)の選択で決める。 外群:他の全てのOTUと十分遠いと考えられるOTU
・無根系統樹から有根系統樹への変換:OTUの中から適切な外群(out group)を選べばよい。 外群の選択基準:(1)他の全てのOTUと相同、(2)他のどのOTUとも十分遠縁
系統樹に根(root)をつける
2016-04-21 https://www.ncbi.nlm.nih.gov/labs/pmc/articles/PMC7149615/ Rooting Trees, Methods for
(Brady et al., 2011,
Brady S.G., Litman J.R., Danforth B.N. Rooting phylogenies using gene duplications: An empirical example from the bees (Apoidea) Molecular Phylogenetics and Evolution. 2011;60(3):295–304. [PubMed] https://pubmed.ncbi.nlm.nih.gov/21600997/ outgroup versus paralogous rooting
2015-01-05 https://phylobotanist.blogspot.com/2015/01/how-to-root-phylogenetic-tree-outgroup.html How to root a phylogenetic tree: outgroup, midpoint and other methods
- Outgroup rooting
- Midpoint rooting
- Ultrametric trees
- Asymmetric step-matrices
- Gene duplication events
2012-06-07 http://cabbagesofdoom.blogspot.com/2012/06/how-to-root-phylogenetic-tree.html How to root a phylogenetic tree Unrooted. Midpoint Rooting. Outgroup Rooting. Why does the root matter?
https://www.fifthdimension.jp/documents/molphytextbook/modelselection_lecture.pdf 分子進化の統計モデリングとモデル選択 時間反転可能モデル 時間反転不能モデル
2021-05-18 IQ-TREE Non-Reversible Models 時間反転不能モデルを用いて、外群なしで有根系統樹を推定 https://github.com/haruosuz/evolve/blob/master/references/README.evolve.tools.md#iqtree_rootstrap
2021-05-01 root_digger https://github.com/haruosuz/evolve/blob/master/references/README.evolve.tools.md#root_digger
FastTreeのルートの位置は生物学的に意味がない。 https://github.com/haruosuz/evolve/blob/master/references/README.evolve.tools.md#fasttree http://www.microbesonline.org/fasttree/ Output formats: FastTree outputs trees in Newick format. The placement of the root is not biologically meaningful. http://www.microbesonline.org/fasttree/#FAQ What does the rooting of the tree mean? FastTree's placement of the root is arbitrary and is not biologically meaningful. To place the root accurately, you need outside information beyond what is in the alignment. If you do not have such information, another common approach is to use the midpoint, so that the maximum distance from the root to any leaf is minimized. This makes sense if the sequences are evolving according to a molecular clock. Most tree viewers can reroot a tree, but for huge trees I use the stat/reroot.pl script in MicrobesOnline's code base.
https://github.com/haruosuz/DS4GD/blob/master/2021/CaseStudy.md#mega Barry G. Hall (2017) Phylogenetic Trees Made Easy: A How-To Manual (5th edition)
- p.79-80 Rooted and Unrooted Trees | For display purposes, MEGA has put a bend in one branch or another by the midpoint rooting method, but that does not accurately root an unrooted tree. (see Chapter 7 for a more detailed discussion of rooting trees.)
- p.112 Rooting a Tree | The rectangular format is obtained by selecting a branch of an unrooted tree and placing an interior node—the root—within that branch. Some tree-draw-ing programs simply place the apparent root in the branch that leads to the first sequence listed in the alignment. MEGA improves upon that by placing the apparent root at the midpoint of the NJ tree, in the branch located midway between the two most distant sequences. If the rate of evolution is roughly con- stant along all branches, then this midpoint rooting will have placed the root correctly. More often, however, midpoint rooting places the root incorrectly, so it should not be trusted. So how can we find the root of the tree?
https://github.com/deropi/PhyloRooting
https://pubmed.ncbi.nlm.nih.gov/37247390/ Genome Biol Evol . 2023 Jun 1;15(6):evad096. doi: 10.1093/gbe/evad096. Phylogenomic Testing of Root Hypotheses Fernando D K Tria 1, Giddy Landan 1, Devani Romero Picazo 1, Tal Dagan 1 https://academic.oup.com/gbe/article/15/6/evad096/7185701 https://www.ncbi.nlm.nih.gov/pmc/articles/PMC10262964/ Data Availability The source code to run the phylogenomic rooting as well as the unrooted trees with AD values used in this study are found in the following repository: https://github.com/deropi/PhyloRooting.git. Additionally, R code to replicate some of the figures in this paper is also provided.
5:55 AM · May 31, 2023 https://twitter.com/DaganLab/status/1663650390057930752 DaganLab on Twitter: "Phylogenomic Testing of Root Hypotheses. Extremely happy to have this work out. We reformulate root inference in the framework of statistical hypothesis testing and outline an analytical procedure to test competing root positions for a group of species. https://t.co/n0Z2WUIt34" / Twitter
https://pubmed.ncbi.nlm.nih.gov/36992393/ Viruses . 2023 Mar 5;15(3):684. doi: 10.3390/v15030684. Rooting and Dating Large SARS-CoV-2 Trees by Modeling Evolutionary Rate as a Function of Time Xuhua Xia 1 2 https://www.mdpi.com/1999-4915/15/3/684 https://www.ncbi.nlm.nih.gov/pmc/articles/PMC10057463/ software TRAD [22] freely available at http://dambe.bio.uottawa.ca/TRAD/TRAD.aspx (accessed on 7 May 2022). http://dambe.bio.uottawa.ca/TRAD/TRAD.aspx
https://pubmed.ncbi.nlm.nih.gov/35143961/ Mol Phylogenet Evol . 2022 Apr:169:107434. doi: 10.1016/j.ympev.2022.107434. Epub 2022 Feb 7. The performance of outgroup-free rooting under evolutionary radiations Alessandra P Lamarca 1, Beatriz Mello 1, Carlos G Schrago 2 https://www.sciencedirect.com/science/article/abs/pii/S1055790322000471 https://search.lib.keio.ac.jp/permalink/81SOKEI_KEIO/uccs31/cdi_proquest_miscellaneous_2628301396 Elsevier ScienceDirect Journals Complete https://www-sciencedirect-com.kras.lib.keio.ac.jp/science/article/pii/S1055790322000471?via%3Dihub
In this work we analyzed the performance of two of these methods, the midpoint rooting (MPR) and the minimal ancestor deviation (MAD), in rooting topologies evolved under challenging scenarios of fast evolutionary radiations derived from empirical data, characterized by short internal branches near the crown node. Considering all branch length combinations investigated, both methods exhibited average success rates below 50%, although MAD slightly outperformed MPR. Moreover, tree balance significantly impacted the relative performance of the methods. 調査したすべての枝長の組み合わせを考慮すると、両手法とも平均成功率は50%未満、MADはMPRをわずかに上回った。系統樹のバランスは手法の相対的な性能に大きく影響した。 If predictive models of the outcomes of outgroup-free rooting methods could be inferred for any topology, they would be useful in situations when phylogenetically close outgroups are absent, as is the case in evolutionary analyses of fast evolving pathogens and bacteria (Pipes et al., 2021).
https://pubmed.ncbi.nlm.nih.gov/34436605/ Mol Biol Evol . 2021 Dec 9;38(12):5514-5527. doi: 10.1093/molbev/msab254. Phylogenetic Signal, Congruence, and Uncertainty across Bacteria and Archaea Carolina A Martinez-Gutierrez 1, Frank O Aylward 1 2 https://academic.oup.com/mbe/article/38/12/5514/6358142?login=false https://www.ncbi.nlm.nih.gov/pmc/articles/PMC8662615/ Our results indicate that the Patescibacteria (also called the CPR) are a derived group that is sister to the Chloroflexota, consistent with two recent studies (Coleman et al. 2021). This is in contrast to other studies that placed this group as either basal-branching or falling outside of the Terrabacteria (Hug et al. 2016; Parks et al. 2017; Castelle et al. 2018; Méheust et al. 2019).
https://scholar.google.co.jp/scholar?cites=15482149728459064999&as_sdt=2005&sciodt=0,5&hl=ja
https://pubmed.ncbi.nlm.nih.gov/33958464/ Comment Science . 2021 May 7;372(6542):574-575. doi: 10.1126/science.abh2814. Illuminating the first bacteria Laura A Katz 1 https://science.sciencemag.org/content/372/6542/574
https://pubmed.ncbi.nlm.nih.gov/33958449/ Science . 2021 May 7;372(6542):eabe0511. doi: 10.1126/science.abe0511. A rooted phylogeny resolves early bacterial evolution Gareth A Coleman # 1, Adrián A Davín # 2, Tara A Mahendrarajah 3, Lénárd L Szánthó 4 5, Anja Spang 3 6, Philip Hugenholtz # 7, Gergely J Szöllősi # 8 5 9, Tom A Williams # 10 https://science.sciencemag.org/content/372/6542/eabe0511 Our analyses place the root between two major bacterial clades, the Gracilicutes and Terrabacteria. We found no support for a root between the Candidate Phyla Radiation (CPR), a lineage comprising putative symbionts and parasites with small genomes, and all other Bacteria. Instead, the CPR was inferred to be a member of the Terrabacteria and formed a sister lineage to the Chloroflexota and Dormibacterota.
6:40 PM · May 7, 2021 https://twitter.com/BIRDlab_ENS/status/1390602531219312647 Alice Lebreton on Twitter: ""Illuminating the first bacteria": Perspective by Laura A. Katz in @ScienceMagazine on recent research that aim at finding out where the bacterial tree is rooted. https://t.co/iGcpUV1P24 https://t.co/PZztmTbRKU" / Twitter https://twitter.com/BIRDlab_ENS/status/1390602535124209664 Alice Lebreton on Twitter: "The original research: "A rooted phylogeny resolves early bacterial evolution", by Coleman, Davín et al. in @ScienceMagazine. https://t.co/uz1IuHs3g1 https://t.co/ipg4dH9GCR" / Twitter
11:36 AM · May 7, 2021 https://twitter.com/takatoh_life/status/1390495662588923906 本研究では独自開発した手法により、遺伝子の垂直伝搬だけでなく水平伝搬や遺伝子の重複や消失を考慮して、細菌の系統樹の根元を推定した。その結果、遺伝子の伝達の2/3は垂直方向であり、その根元はグラム陰性菌Gracilicutesとグラム陽性菌Terrabacteriaの間に根元がある可能性が高いと推定した。
https://pubmed.ncbi.nlm.nih.gov/33295605/ Mol Biol Evol . 2021 Apr 13;38(4):1537-1543. doi: 10.1093/molbev/msaa316. Assessing Uncertainty in the Rooting of the SARS-CoV-2 Phylogeny Lenore Pipes 1, Hongru Wang 1, John P Huelsenbeck 1, Rasmus Nielsen 1 2 3 https://academic.oup.com/mbe/article/38/4/1537/6028993 https://www.ncbi.nlm.nih.gov/pmc/articles/PMC7798932/
7:09 PM · Aug 7, 2020 https://twitter.com/AlexisCompBio/status/1291677772570603522 Alexis Stamatakis on Twitter: "In our latest preprint https://t.co/kg6LYXJmaF we find that phylogenetic analyses of SARS-CoV-2 data are extremely challenging due to weak signal and that rooting the tree is difficult. We provide some recommendations on analyzing SARS-CoV-2 data." / Twitter
https://www.biorxiv.org/content/10.1101/2020.08.05.239046v1 Phylogenetic analysis of SARS-CoV-2 data is difficult | bioRxiv We further find that rooting the inferred phylogeny with some degree of confidence either via the bat and pangolin outgroups or by applying novel computational methods on the ingroup phylogeny does not appear to be possible.
https://pubmed.ncbi.nlm.nih.gov/32413061/ PLoS One . 2020 May 15;15(5):e0232950. doi: 10.1371/journal.pone.0232950. eCollection 2020. Assessing the accuracy of phylogenetic rooting methods on prokaryotic gene families Taylor Wade 1, L Thiberio Rangel 2, Soumya Kundu 1, Gregory P Fournier 2, Mukul S Bansal 1 3 https://journals.plos.org/plosone/article?id=10.1371/journal.pone.0232950 https://www.ncbi.nlm.nih.gov/pmc/articles/PMC7228096/ Among other findings, this study identifies parsimonious Duplication-Transfer-Loss (DTL) rooting and Minimal Ancestor Deviation (MAD) rooting as two of the most accurate gene tree rooting methods for prokaryotes and specifies the evolutionary conditions under which these methods are most accurate, demonstrates that DTL rooting is highly sensitive to high evolutionary rates and gene tree error, and that rooting methods based on branch-lengths are generally robust to gene tree reconstruction error.
2:27 PM · May 23, 2020 https://twitter.com/MicrobiomDigest/status/1264065321817653248 Elisabeth Bik on Twitter: "Assessing the accuracy of phylogenetic rooting methods on prokaryotic gene families - Taylor Wade et al. * 3098 gene trees from 504 bacterial species * parsimonious Duplication-Transfer-Loss rooting, Minimal Ancestor Deviation rooting most accurate https://t.co/1UKaubCOJS https://t.co/zMma2416gh" / Twitter
https://pubmed.ncbi.nlm.nih.gov/30753429/ Genome Biol Evol . 2019 Mar 1;11(3):883-898. doi: 10.1093/gbe/evz034. Investigating the Origins of Membrane Phospholipid Biosynthesis Genes Using Outgroup-Free Rooting Gareth A Coleman 1, Richard D Pancost 2, Tom A Williams 1 https://academic.oup.com/gbe/advance-article/doi/10.1093/gbe/evz034/5310093 https://www.ncbi.nlm.nih.gov/pmc/articles/PMC6431249/
Materials and Methods
Phylogenetics
The trees were rooted with an uncorrelated lognormal relaxed molecular clock (RMC), using the LG model with a discretized Gamma distribution (Yang 1994) with four rate categories, and a Yule tree prior (Stadler 2009; Hartmann et al. 2010) in BEAST (Drummond and Rambaut 2007; Drummond et al. 2012). We also rooted the trees using minimal ancestor deviation (MAD) rooting (Tria et al 2017).
Results and Discussion
Table 1
We used two complementary approaches to root these single-gene trees: a RMC in BEAST (Drummond and Rambaut 2007; Drummond et al. 2012), and the recently described MAD rooting method of Tria et al. (2017).
Tria
https://pubmed.ncbi.nlm.nih.gov/29388565/ Nat Ecol Evol . 2017 Jun 19;1:193. doi: 10.1038/s41559-017-0193. Phylogenetic rooting using minimal ancestor deviation Fernando Domingues Kümmel Tria 1, Giddy Landan 1, Tal Dagan 1 https://www.nature.com/articles/s41559-017-0193 Access options https://search.lib.keio.ac.jp/permalink/81SOKEI_KEIO/1rcqpmf/cdi_proquest_miscellaneous_1993387992 Tria, Fernando Domingues Kümmel ; Landan, Giddy ; Dagan, Tal
6:00 AM · Mar 23, 2018 https://twitter.com/kfuku0502/status/976926638012211200 Kenji Fukushima (福島 健児) on Twitter: minimal ancestor deviation法でのルーティング、いくつかの遺伝子系統樹で試してみたけどめちゃくちゃうまくいく。251枝中1枝のみ、そこでルーティングすると遺伝子重複イベントが最小となるような樹形でも的確にその1枝を見つけている。 重複イベントの最小化と組み合せたら精度増すんじゃないかと思ってたけど、MADだけで十分かも。 今試してみたらこの系統樹はmidpoint rootingでもきちんと遺伝子重複数最小の枝でルーティングされる…。 うーん、やっぱりいろんなデータ見てると最終的にはreconciliation-basedのルーティングに落ち着きそうなきがする…。 reconciliation-basedの方法はroot node付近がduplication nodesばかりだと爆死するので、そういう場合でなおかつreconciliation scoreが最小の枝の中にMADの枝があればそれを採用、という方向で行こう。
8:03 AM - 20 Jul 2018 https://twitter.com/NatureEcoEvo/status/1020277970299162624 Phylogenetic rooting using minimal ancestor deviation https://www.nature.com/articles/s41559-017-0193 … #July2017highlight #ICYMI
https://pubmed.ncbi.nlm.nih.gov/19571238/ Review Philos Trans R Soc Lond B Biol Sci . 2009 Aug 12;364(1527):2177-85. doi: 10.1098/rstb.2009.0035. Genome beginnings: rooting the tree of life James A Lake 1, Ryan G Skophammer, Craig W Herbold, Jacqueline A Servin https://royalsocietypublishing.org/doi/10.1098/rstb.2009.0035 https://www.ncbi.nlm.nih.gov/labs/pmc/articles/PMC2873003/
2015 https://search.lib.keio.ac.jp/permalink/81SOKEI_KEIO/188bto4/alma99275963904031 Welcome to the Microbiome : Getting to Know the Trillions of Bacteria and Other Microbes In, On, and Around You / Rob DeSalle, Susan L. Perkins. DeSalle, Rob, author. Perkins, Susan L., author. Wynne, Patricia J. What Is Life? 23 If traces of a single gene family can be found in organisms of all three major groups of cells (Archaea, Eukarya, and Bacteria), then one can assume that the gene duplication event occurred in the common ancestor of all life on the planet, and a gene from one can be used to root genes in the others. The rooting of one gene family with a closely related gene family is called “paralog rooting” パラログ・ルーティング
midpoint rooting (MPR)
例:
2020 https://www.ncbi.nlm.nih.gov/pmc/articles/PMC7738440/ A Novel Family of Acinetobacter Mega-Plasmids Are Disseminating Multi-Drug Resistance Across the Globe While Acquiring Location-Specific Accessory Genes The resulting tree was annotated with FigTree v.1.4.3 (Rambaut, 2017) with midpoint root.
2019 Jan 8; https://www.ncbi.nlm.nih.gov/pmc/articles/PMC6325168/ Pangenomic Approach To Understanding Microbial Adaptations within a Model Built Environment, the International Space Station, Relative to Human Hosts and Soil FIG 3 Phylogenetic tree constructed from core gene codon alignment with midpoint rooting. The Newick trees were processed with Phangorn v2.4.0 (81) for midpoint rooting and plotted with Ape v5.1 (82).
2006 May https://www.ncbi.nlm.nih.gov/pmc/articles/PMC1458961/ Genome Sequence of Rickettsia bellii Illuminates the Role of Amoebae in Gene Exchanges between Intracellular Pathogens Figure 5 The tree was built using a maximum likelihood method with JTT substitution model and midpoint rooting based on the concatenated sequence alignment of TraDF and TraGF.
https://pubmed.ncbi.nlm.nih.gov/32287391/ Biol J Linn Soc Lond . 2007 Dec;92(4):669-674. doi: 10.1111/j.1095-8312.2007.00864.x. Epub 2007 Dec 7. An empirical test of the midpoint rooting method Pablo N Hess 1, Claudia A DE Moraes Russo 1 https://www.ncbi.nlm.nih.gov/labs/pmc/articles/PMC7110036/ Interestingly, the more consistent the outgroup root is, the more successful MPR appears to be. This is a strong indication that the MPR method is valuable, particularly for cases where a proper outgroup is unavailable.
2023 年 12 月 7 日 井上 潤 https://fish-evol.org/R_JI.html ape: BS 値付き tree の reroot はおかしい? reroot すると,BS 値の位置がおかしくなると聞きました.以下は例題です.左の tree を d という leaf で rooting しています.しかし,私には問題ないように思えます.
2012 http://nesseiken.info/Chiba_lab/index.php?cmd=read&page=授業%2FH24%2F進化生物学I%2F系統樹に関する基本用語
- 根(ルート、root) 他の全ての節に続く特定の節のことを根(ルート)と言う。根を持つ系統樹を有根系統樹(rooted tree), 根を持たない系統樹を無根系統樹(unrooted tree)と呼ぶ。無根系統樹は分類群相互の関連のみを示しており、進化的な関係(時間の経過を伴う類縁関係)を示していない。つまり、厳密に言うならば、無根系統樹は系統樹と見なせないという考え方もできる。 4つの末端節からなる無根系統樹のインターナルブランチをセントラル・ブランチ(central branch)と呼ぶ。
- 外群 (outgoup) 内群に含まれない分類群はすべて外群(outgroup)になる。外群は通常、系統樹に根をつけるときに使われ、内群の姉妹群から複数のものを用いることが多い。
2009 https://www.jst.go.jp/nbdc/bird/jinzai/literacy/streaming/ 分子系統解析(講義3) 講義資料3 https://www.jst.go.jp/nbdc/bird/jinzai/literacy/streaming/h21_4_3b.pdf 無根系統樹に根をつける方法 根をつける方法は2つ 1.最も遠い関係にあると知られている生物種の配列(外群、 outgroup)を1つ以上含める 2.最も遠い関係にある2つの配列を結ぶ枝の中点をinternal nodeとする
2018 http://leeswijzer.org/files/activity.html ●日本進化学会第20回大会・シンポジウム・S5〈Basal lineageは「原始的」か?:生物界と分野を超えて〉2018年8月22日(水)15:50〜17:50@東京大学駒場キャンパス5号館(Room 5):三中信宏「Basal Lineage の幻想と実態:系統樹の有根化と形質状態復元の観点から」→ Slideshare https://www.slideshare.net/slideshow/minaka-sesj2018-slideshare/111052581 19. 間接法(indirect method)=外群比較法 対象となる内群(ingroup)に対して “近縁” と仮定さ れる外群(outgroup)を仮定し,外群を基準として内 群の形質状態の原始性/派生性の方向性を推定し,内 群の最節約分岐図(外群有根化)を推定する. ↓ 内群+外群の全体にわたる大域的最節約分析(MP)を 行うと同時に,無根最節約分岐図の樹形推定と同時に 原始性/派生性の方向性が決まり,外群有根化される. 20. 直接法(direct method)=個体発生法 外群の仮定を置かずに,個体発生形質(発生段階遷移 の情報)を用いれば,より直接的な形質状態の方向性(原 始性/派生性)の推定と分岐図の有根化が可能だろう という主張が 1970 年代に分岐学派の中で活発に議論 された.その後,十年以上も論争が続いたが,方向性 推定の方法としては,最終的に外群比較法に押されて 影が薄くなってしまったようだ.
20060715 https://leeswijzer.hatenadiary.com/entry/20060715/1152931775 『系統樹思考の世界:すべてはツリーとともに』 - leeswijzer: een nieuwe leeszaal van dagboek 第2節:グラフとしての系統樹――点・辺・根 168 無根系統樹と有根系統樹 祖先子孫関係は原理的に不可知である
2010年07月02日 http://bbs.jinruisi.net/blog/2010/07/829.html ■無根系統樹と有根系統樹

https://en.wikipedia.org/wiki/Monophyly In cladistics, a monophyletic group, or clade, is a group of organisms that consists of all the descendants of a common ancestor (or more precisely ancestral population).
https://ja.wikipedia.org/wiki/系統群 Clade)とは、共通の祖先から進化した生物群のこと。側系統群、単系統群、多系統群などがある。
https://ja.wikipedia.org/wiki/単系統群 とは、生物の分類群のうち、単一の進化的系統からなり、しかもその系統に属する生物すべてを含むものをいう。
https://ja.wikipedia.org/wiki/分岐学 分類学における分類群(タクソン)には、単一の系統からなる「単系統群」(例えば鳥類)と、大きな単系統群から一部の単系統群を除いてまとめた「側系統群」(鳥類を除いた爬虫類など)があるが、分岐学の立場では側系統群は分類群として認めるべきではなく、単系統群(分岐学ではクレードCladeという)のみを認めるべきだということになる(進化分類学と呼ばれる考え方では側系統群も認める)。
『カラー図解 進化の教科書 第3巻 系統樹や生態から見た進化』 p.22 図9-11 クレード(単系統群)は、大きな系統樹からハサミを1回だけ使って切り取ることができる。もしハサミを2回使う必要があるなら、それはクレードではない。クレードは、ある生物とそのすべての子孫からなる。
https://www.fifthdimension.jp/documents/molphytextbook/molphytextbook.ja.html 分子系統学演習 データセットの作成から仮説検定まで 田辺晶史 2015/10/20 6.1 クレード・単系統・側系統・多系統・祖先的・派生的 まず、クレード(clade)についてです。クレードとは、系統樹上で複数のOTUが所属する部分系統樹のことです。ただし、有根系統樹と無根系統樹ではやや意味が異なります。無根系統樹では、ある内分枝(internal/interior branch)の一方の端点に接続されている部分系統樹をクレードと言いますが、有根系統樹では内分枝の根から遠い側の端点に接続されている部分系統樹を指します。つまり、有根系統樹上のクレードが根点を含むことはありません。
http://www2.tba.t-com.ne.jp/nakada/takashi/phylogeny/monophyly.html 単系統,側系統,多系統 作成:仲田崇志 更新:2006年10月13日 「単系統」(monophyly)あるいは「単系統群」(monophyletic group) 「分岐群」 (clade;「クレード」と字訳されることも多い)
http://nesseiken.info/Chiba_lab/index.php?cmd=read&page=授業%2FH24%2F進化生物学I%2F系統樹に関する基本用語 単系統群 (monophyletic group), クレード (clade) 1つの共通祖先と、それから派生した分類群全てを含むグループのこと。分子系統学では、クレードという用語を、1つの共通祖先から派生した分類群からなるグループで、他のグループのものとはその祖先を共有しないものに使う。系統樹を見て、分類群同士の関係を議論するのに、最も普通に使われる用語。
制約
http://www.iqtree.org/doc/Advanced-Tutorial#constrained-tree-search Constrained tree search IQ-TREE supports constrained tree search via -g option, so that the resulting tree must obey a constraint tree topology. The constraint tree can be multifurcating and need not to contain all species.
NOTE: While this option helps to enforce the tree based on prior knowledge, it is advised to always perform tree topology tests to make sure that the resulting constrained tree is NOT significantly worse than an unconstrained tree! See tree topology tests and testing constrained tree below for a guide how to check this.
http://www.iqtree.org/doc/Command-Reference#tree-search-parameters
-g Specify a topological constraint tree file in NEWICK format. The constraint tree can be a multifurcating tree and need not to include all taxa.
Example usages:
Infer an ML tree for an alignment data.phy obeying a topological constraint tree constraint.tree:
https://www.fifthdimension.jp/documents/molphytextbook/molphytextbook.ja.html RAxMLで樹形制約(topological constraint)を課した系統樹推定を行うには、まず制約となる系統樹を作成する必要があります。例えば、TaxonA~TaxonEの5 OTUのデータでTaxonAとTaxonBの単系統性(monophyly)を制約として課す場合、以下のような系統樹ファイルを用意します。
このように、「特定の系統仮説を満たす」樹形制約を正の制約(positive constraint)と言います。正の制約下の系統樹推定では、その系統仮説と互換性のある系統樹の中でベストな系統樹を探索することになります。「特定の系統仮説を満たさない」という制約もあり、これを負の制約(negative constraint)と呼びます。負の制約下の系統樹推定では、その系統仮説と互換性の無い系統樹の中でベストな系統樹を探索することになります。RAxMLは負の制約に対応していないため、単系統「でない」という制約を課すことができません。しかし、ブートストラップ解析結果から得られる内分枝出現頻度を見れば、その負の制約下で最も尤度の高い樹形を含む正の制約=第2位の系統仮説が推定できます(必ずこうなるわけではありませんが)ので、それを課した樹形探索を行うことで対処することができます。
http://cse.naro.affrc.go.jp/minaka/cladist/NOTES/phylostat1.html 系統推定に関わる統計的検定について(導入) PAUP*にはダイレクトに崩壊指数を計算するコマンドはないが,樹形制約(「Constraints」コマンド)を用いることで結果的に崩壊指数を計算することは可能である.
http://www.fish-evol.org/Constraint.html 井上潤:constraint の選び方 分岐年代推定に用いる制約の選び方 2014 年 11 月 20 日 改訂 井上 潤
https://en.wikipedia.org/wiki/Basal_(phylogenetics) deep-branching or early-branching are similar in meaning.
2018/6/7 http://darwin.c.u-tokyo.ac.jp/sesj2018/symposium/ Basal lineageは「原始的」か?:生物界と分野を超えて http://darwin.c.u-tokyo.ac.jp/sesj2018/wp/wp-content/uploads/2018/08/5d5ef9dd328e3e7158e5fbaff5ce1d98.pdf 特定の生物群において早い時期に分岐した系統は往々にして「basal lineage」と呼ばれ、その生物群の原始 的な表現型を持つと考えられていることが多い。近年、ゲノム情報を利用した遺伝子機能の分化メカニズム の研究などから、「basal lineage は原始的である」という観念の再検討の必要が露わとなっている。多角的 にこの問題を議論するため、生物界を超えた basal lineage の例について触れ、分野をまたいで議論する。
Aug 22, 2018 https://www.slideshare.net/leeswijzer/minaka-sesj2018-slideshare Minaka sesj2018 slideshare 講演スライド—日本進化学会第20回大会シンポジウム・S5〈Basal lineageは「原始的」か?:生物界と分野を超えて〉:三中信宏「Basal Lineage の幻想と実態:系統樹の有根化と形質状態復元の観点から」2018年8月22日(水)15:50〜17:50@東京大学駒場キャンパス5号館(Room 5)
- https://twitter.com/search?q=Basal%20Lineage%20lang%3Aja
- https://twitter.com/copypasteusa/status/1032263315752284160 #sesj2018 #日本進化学会第20回大会 #進化学会 Basal lineageは「ない」 Sister taxaは「ある」
https://archosaurmusings.wordpress.com/2008/12/18/how-to-read-a-phylogenetic-tree/ How to read a phylogenetic tree | Dave Hone's Archosaur Musings basal taxa (at the bottom of the tree)
https://quizlet.com/97829330/phylogenetic-terms-flash-cards/ Phylogenetic Terms単語カード | Quizlet
Root the most basal internode at the bottom of a tree. This is the common ancestor.
パーティション
https://www.fifthdimension.jp/documents/molphytextbook/molphytextbook.ja.html https://www.fifthdimension.jp/documents/molphytextbook/molphytextbook.ja.pdf 2.1.2 座位間の置換速度不均質性 座位 (site) 間における置換速度の不均質性 (heterogeneity) があることが知られており、これを表すモデルがいくつか 提案されています。 また、置換の起きない座位 (invariable site) と置換が起きる座位 (variable site) の 2 つにカテゴリ分けするモデル ( + I と表記) や、 + G と + I を併用したモデルもあります。これらは一定の法則に従って自動的に行われるカテゴリ分けで すが、解析者が任意のカテゴリ分け (partitioning) を指定することもできます ( + SS (site specific rate の意) と表記)。 異なるコドン位置 (codon position) や遺伝子座などの置換速度は異なる可能性が高いので、これらがしばしばカテゴ リとして指定されます。
2.1.3 Mixed model 前節では座位 (site) 間での置換速度不均質性のみを考慮していましたが、塩基置換速度行列および置換速度不均質性の 不均質性を考慮することも可能です。つまり、任意の座位のグループ=パーティション (partition) ごとに異なる塩基 置換速度行列、異なる ASRV モデルを当てはめます。これは mixed model と呼ばれています。論文によっては区分 モデル (partitioned model) と呼んでいることもあります。これに対して、パーティション間に共通の塩基置換速度行 列と ASRV モデルを当てはめるものは非区分モデル (nonpartitioned model) と呼ばれます。
https://www.fifthdimension.jp/documents/molphytextbook/answers.pdf 分子系統解析における 様々な問題について
パーティションの切り方 ● Kakusan4は以下を比較して選択 – 遺伝子座間・コドン位置間全部切る – 遺伝子座間全部切る・コドン位置間全部切らない – 遺伝子座間・コドン位置間全部切らない ● もっと柔軟にな切り方があるのでは? – PartitionFinderで探索可能
系統樹推定の勘所 ● パーティションの切り方 ● パーティション間モデル(等速度・比例・分離) ● パーティション内モデル(JC69~GTR+G)
冨田秀一郎 著 · 2018
https://www.jstage.jst.go.jp/article/konchubiotec/87/2/87_2_091/_pdf
蚕糸・昆虫バイオテック 87(2)、91-94(2018) SANSHI-KONCHU BIOTEC
特集「ポストゲノム時代の形態進化研究」 によせて進化研究と系統解析
分子系統解析について私見を述べさせていただく。最初にお断りさせていただくが,筆者は,系統解析の専門家ではなく,むしろ単なるユーザーであるので,数理統計学的な面で誤解をしている可能性もある。
図 1.DNA 塩基配列データの場合の分子進化モデル
複数パーティションとなる場合にはパーティションごとに異 なる置換確率行列と不均質性モデルを当てはめる。
さて,実際の分子系統解析は通常以下のようなステッ プを踏むことになる。 1)配列情報を収集する。 2)集めた配列を並べて,マルチプルアラインメントを行う。 3)分子進化モデルの選択とパーティショニングを行う。 4)系統推定を行う。 5)系統仮説の比較や妥当性の検定を行う。
3)と 4)で私は にわかに途方に暮れることになった。系統推定を行うプ ログラムはモデル選択やパーティションの切り方を教え てくれないが,そもそもそれが何なのか知らなかったの である。
(図 1)。この分 子進化様式は,厳密にいえばサイト(塩基のポジション) ごとに異なっているはずであるので,サイトごとに異な るモデルを適用すれば良いように思うかもしれないが, データからモデルを引き出している以上,それは統計学 でいうところのいわゆるフルモデルとなり決して良いモ デルとは言えない。そこで進化様式が似ていそうなとこ ろをまとめるのがパーティショニングである。遺伝子ご と,コドンポジションごとなどのストラテジーが考えら れ,それだけでも膨大なパターンになることも多い。そ こで,パーティションの切り方やモデル選択を AIC や BIC のような統計量基準で評価してくれるプログラムを 利用することになるが,最終的にその妥当性を判断する のは生物学者である。
2017年3月22日 http://www.tezuru-mozuru.com/?p=9927 iqtreeによる最尤法系統樹推定 – チームてづるもづる iq treeは,パーティション分けが可能な最尤法系統樹推定ソフトです.
2016 年 10 月 12日 http://www.fish-evol.org/RAxML.html RAxML - 井上 潤 パーティションの設定
2012 年 7 月 16 日 http://www.fish-evol.org/DatabaseEnglish.html 井上 潤: 系統解析の英語例文 Partition 解析
Last-modified: 2015-05-13 (水) 16:39:20 (2042d) http://nesseiken.info/Chiba_lab/index.php?cmd=read&page=授業%2FH17%2F系統学特論%2F最尤法 H17/系統学特論/PAUP*使用法/最尤法 † 課題2:Modeltestと系統解析 † 本来ならば、Modeltestのときからコドンポジションでパーティションを作って解析を行いたいが、今回説明する手順でそれをやるのは難しい。そこで、パーティションを作らずにモデル選択した後、Modeltestで得られたlsetのsiteratesとratesをパーティション用の設定に置き換えて解析するという、簡便法をとる。
2008 https://www.ism.ac.jp/editsec/toukei/pdf/56-1-145.pdf
複数遺伝子の結合データに基づく分子系統樹の 推測 真核生物の大系統の解析を例として 橋本 哲男1,2 ・有末 伸子3 ・坂口 美亜子1 ・稲垣 祐司1,2
方法論の概略を述べ,真核生物の大系統の問題に関するデータ解析の実例を示した. 結合のための統計モデルとして,単に個々の遺伝子(もしくは全データセットを構成する個々 の ‘区分’)の連結データに対して 1 セットの枝長を推定する「連結モデル」,個別の遺伝子(区 分)それぞれについて独立に枝長の推定を行う「分離モデル」,枝長が遺伝子(区分)間で比例し ているという仮定を置く「比例モデル」の 3 つのモデルを取り上げ, Three models of branch length estimation are considered assuming that all genes (or partitions for the full data set)have the same branch length (concatenate model), each gene (partition) has a separate set of branch lengths (separate model), and branch lengths are proportional among genes (partitions) (proportional model).
枝長
https://ja.wikipedia.org/wiki/クラドグラム cladogram
http://www.h.chiba-u.jp/lab/florista/kokubun/biology/current/biology161005.pdf ・枝の長さに意味がない系統樹(クラドグラム)と枝の長さが変化の度合いを示す系統樹(ファイログ ラム)がある。ファイログラムには必ずスケール(時間または形質の変化の数)がつく。
https://www.ebi.ac.uk/training/online/course/introduction-phylogenetics/what-phylogeny/aspects-phylogenies/branches So if you see figures in the literature with branches longer than ~3 substitutions per site then you might want to worry about the confidence we have in those estimates!
https://github.com/haruosuz/bioinfo/blob/master/2019/CaseStudy.md#ws222 Akifumi Tanabe https://www.fifthdimension.jp/documents/molphytextbook/ 田邉晶史 https://www.fifthdimension.jp/documents/molphytextbook/answers.pdf 分子系統解析における様々な問題について そもそもどこの配列を使うべき? ● 置換が早すぎず遅すぎない(=多すぎず少なすぎない) https://www.youtube.com/watch?time_continue=10844&v=vq9Fzd0Yqzc&feature=emb_title 分子系統学演習 - データセットの作成から仮説検定まで @ 分子系統樹推定法:理論と応用 ワークショップ - YouTube 2:57:40 / 3:22:38 「置換が速すぎる = 枝の長さ(1サイトあたりの置換数の平均値)が1を超える。全サイトを通して平均置換数が1を超えている。多重置換が起きている」
Long branch attraction (LBA) 長枝誘引
https://haruosuz.hatenadiary.org/entry/20080813
https://en.wikipedia.org/wiki/Long_branch_attraction
https://ja.wikipedia.org/wiki/長枝誘引 長枝誘引[1][2](ちょうしゆういん、英:Long Branch Attraction)は、系統解析において、系統的に近縁でない2つの分類群の進化速度が極めて速い場合に、系統樹の枝が相対的に長くなり、これらの長い枝の先端に付く分類群が誤って近縁と推定される現象。系統推定法のうち特に最大節約法への影響が顕著であるが、最尤法や近隣結合法などの他の系統推定法でも主要な課題の一つである[3]。
https://www.jstage.jst.go.jp/article/jsbibr/2/1/2_jsbibr.2021.7/_html/-char/ja 総説 分子系統解析の最前線 松井 求 相対的に極端に長い枝が存在する場合、長枝誘引という現象が起きることが知られており[32]、特に最節約法への悪影響が大きい。
https://pubmed.ncbi.nlm.nih.gov/33528562/ Syst Biol . 2021 Jun 16;70(4):838-843. doi: 10.1093/sysbio/syab001. Long Branch Attraction Biases in Phylogenetics Edward Susko 1, Andrew J Roger 2 https://academic.oup.com/sysbio/article/70/4/838/6126433
2020 年 https://www.jstage.jst.go.jp/article/mammalianscience/60/2/60_269/_article/-char/ja/ 分子情報にもとづいた真獣類の系統と進化 長谷川 政美 https://www.jstage.jst.go.jp/article/mammalianscience/60/2/60_269/_pdf 配列の長さか?種の数か? 重複遺伝子は除外し,2,789 個のたんぱく質をコードしている遺伝子の合計およそ 100 万塩基座位を解析に用いたのである. この 100 万塩基をまず一つながりの連結配列として解析すると(これを連結モデルという),どのような塩基置換モデルを用いても,北方獣類が最初にほかの 2 者から分かれ,その後でアフリカ獣類と異節類が分岐したという系統樹が 100%のブートストラップ確率で支持された.これは超大陸の分断の順番と合致するものであるが,この結果を受け入れることはできない. 2,789 個の遺伝子がそれぞれ独自のパターンで進化するというモデル(これを独立モデルという)で解析すると,連結モデルでは 100%のブートストラップ確率で支持されていたアフリカ獣類 / 異節類近縁ではなく,北方獣類 / 異節類近縁が支持されるようになる.しかしその支持は,ほかの系統樹を棄却できるほど強いものではない. つまり,現実の進化過程と大きく食い違うモデルを用いた解析では,推定に偏りが生じて間違った推定をしてしまうと同時に,配列データが長くなるとそれにつれてサンプリング誤差が小さくなるために,間違った系統樹が非常に強く支持されるということが起こるのである.従って,ゲノム規模の大量データによる系統樹解析の結果を受け入れる際には注意が必要である. 以上のように配列データが長くなっても正しい系統樹推定を行うのは簡単ではない.これを克服するには,2つの方向がある.1 つは解析に用いるモデルをより現実的なものにすることである.もう 1 つが種のサンプリングを増やすことである. モデルが適切でないために系統樹推定を間違う原因として最も有名なものが長枝誘引である(Felsenstein1978).1991 年に Graur らは,10 種類のたんぱく質のアミノ酸配列データを最節約法で解析した結果,図 3b で示したようなネズミがモルモットよりもヒトに近いという系統樹が強く支持された(Graur et al. 1991).この系統樹が正しいとするとネズミとモルモットを含む齧歯目は単系統でないことになる.ところが彼らの解析を再検討してみると,用いたたんぱく質の 1 つであるリポたんぱくリパーゼの進化速度が,モルモットで非常に高くなっていることが分かったのである(Hasegawa et al.1992).最節約法や最尤法など分子系統樹推定に用いられる方法のほとんどは,進化速度の一定性を仮定しないが,置換が多くて長い枝ほど多重置換の効果が過小評価になる.そもそも最節約法では多重置換を一切考えないのでこの影響は大きい.そのために図 3a が正しい系統樹であっても,図 3b のように長い枝同士が間違って組んでしまうことになる(外群に至る枝は長いことに注意).これが長枝誘引である.この問題は最節約法の場合に特に深刻であるが,最尤法でもモデルが単純過ぎて多重置換の効果が正しく評価されない場合には問題になる. これを克服するには,種のサンプリングを増やすことが有効である.最尤法であれば,例えば図 3a でモルモットに至る長い枝の途中から分岐するマーラ,アグーチ,ヤマアラシなどを加えたり,外群であるカンガルーに至る枝の途中から分岐するウシ,ゾウなどを加えることによって多重置換の効果がより正しく評価されることになる. 長枝誘引など,モデルが現実と食い違っていることによる系統樹推定の偏りを克服するためには,モデルを改善するとともに,種のサンプリングを増やすことが有効であると述べたが,そのことを示す研究例を紹介しよう.
図 3.長枝誘引 Long branch attraction によって系統樹推定を誤る例(長谷川 2018).
https://www.natureasia.com/ja-jp/nature/highlights/92171 Nature ハイライト:ミトコンドリアの祖先を再検討する | Nature | Nature Portfolio 2018年5月3日 Nature 557, 7703 しかし、最初期の化石真核生物は約20億年前のものであり、分岐からは非常に長い時間が経過しているため、長枝誘引(long-branch attraction;LBA)に関する多くの問題があることが示唆される。
BLAST検索が系統学的再構成の代理として使用される場合、短い分岐は体系的なアーティファクトにつながります。 https://www.ncbi.nlm.nih.gov/pubmed/27894995 Mol Phylogenet Evol. 2017 Feb;107:338-344. doi: 10.1016/j.ympev.2016.11.016. Epub 2016 Nov 26. Short branches lead to systematic artifacts when BLAST searches are used as surrogate for phylogenetic reconstruction. Dick AA1, Harlow TJ2, Gogarten JP3. https://linkinghub.elsevier.com/retrieve/pii/S1055-7903(16)30377-3 Long Branch Attraction (LBA) is a well-known artifact in phylogenetic reconstruction when dealing with branch length heterogeneity. Here we show another phenomenon, Short Branch Attraction (SBA), which occurs when BLAST searches, a phenetic analysis, are used as a surrogate method for phylogenetic analysis.
http://sourui.org/publications/sorui/list/Sourui_PDF/Sourui-55-02-111.pdf Jpn. J. Phycol. (Sorlli) 55: 111-116, JlI ly 10,2007 ワークショップA 分子データ解析にかかわるエトセトラ: 偏りのない系統推定を目指して 稲垣祐司 : ロン グブランチの誘惑一分子系統解析のダークサイド https://sites.google.com/site/memicrobes/home/members/yuji 稲垣祐司 博士(理学)/Yuji Inagaki Ph.D
https://pubmed.ncbi.nlm.nih.gov/16209710/ BMC Evol Biol . 2005 Oct 6;5:50. doi: 10.1186/1471-2148-5-50. Heterotachy and long-branch attraction in phylogenetics Hervé Philippe 1, Yan Zhou, Henner Brinkmann, Nicolas Rodrigue, Frédéric Delsuc https://bmcevolbiol.biomedcentral.com/articles/10.1186/1471-2148-5-50 https://www.ncbi.nlm.nih.gov/pmc/articles/PMC1274308/ https://www.ncbi.nlm.nih.gov/pmc/articles/PMC1274308/figure/F1/ Illustration of the branch length heterogeneity conditions commonly referred as the Felsenstein zone (a) and the Farris zone (b). The Felsenstein zone [3] is characterised by two long branches that are not adjacent in the model topology, a situation where most phylogenetic methods fall into the long-branch attraction artefact [1]. Conversely, in the Farris zone [17], also called the inverse-Felsenstein zone [8], the two long branches are adjacent in the model topology. This last condition strongly favours MP over ML because of the intrinsic bias of parsimony towards interpreting multiple changes that occurred along the two long branches as false synapomorphies [8].
https://pubmed.ncbi.nlm.nih.gov/34892859/ Cladistics . 2005 Apr;21(2):163-193. doi: 10.1111/j.1096-0031.2005.00059.x. A review of long-branch attraction Johannes Bergsten 1 https://onlinelibrary.wiley.com/doi/10.1111/j.1096-0031.2005.00059.x Methods suggested to avoid LBA-artifacts include excluding long-branch taxa, excluding faster evolving third codon positions, using inference methods less sensitive to LBA such as likelihood, the Aguinaldo et al. approach, sampling more taxa to break up long branches and sampling more characters especially of another kind, and the pros and cons of these are discussed.
Adding taxa to break up long branches This leads to one of the most widely suggested remedies for LBA artifacts, i.e., to add more taxa to break up long branches (
https://pubmed.ncbi.nlm.nih.gov/15336677/ Mol Phylogenet Evol . 2004 Nov;33(2):440-51. doi: 10.1016/j.ympev.2004.06.015. Should we be worried about long-branch attraction in real data sets? Investigations using metazoan 18S rDNA Frank E Anderson 1, David L Swofford https://www.sciencedirect.com/science/article/abs/pii/S1055790304002052?via%3Dihub Attempts to break up long branches for problematic subsamples through increased taxon sampling reduced, but did not eliminate, LBA problems.
2004年12月15日 https://www.brh.co.jp/research/formerlab/miyata/2004/post_000006.php 【ミクソゾア:多細胞から単細胞への退化】 | JT生命誌研究館 進化速度の上昇は分子に基づく系統樹の推定に厄介な問題を引き起こす。分子系統樹では通常、ある生物の系統の枝の長さは進化速度に比例して取られる。従って寄生性の動物では枝の長さが長い。ところで分子系統樹の推定に際し、極端に長い枝同士が結びつけてしまう誤りをしばしば犯す。このことをLong Branch Attraction Artifact (LBA)と呼んでいる。すなわち、寄生性の生物では分子系統樹上の位置を正しく推定することがそもそも難しいのである。 前置きはこのぐらいにして18SリボソームRNAで推定された系統樹(図1a)上でのミクソゾアの位置を見てみよう。確かに主張通り、ミクソゾアは三胚葉性の動物と近縁関係にあるが、2つの枝はいずれも長い。これは上で述べたLBAの可能性がある。つまり、ミクソゾアの系統的位置は正しく推定されていないのかもしれない。 一歩下がって、単細胞のミクソゾアが多細胞動物由来かどうかだけは答えられるかもしれない。それには一方の長い枝の三胚葉動物を除いて推定し直してみるとよい。そうして解析をし直してみると、ミクソゾアは辛うじては二胚葉性の動物に近縁のようである(図1b)。従って、「ミクソゾアは多細胞動物由来で、寄生の結果形態を著しく退化させた」、といった程度の主張なら正しいかもしれない。
https://dl.ndl.go.jp/info:ndljp/pid/10940560?tocOpened=1 最尤法による生物の系統関係推定について(数学者のための分子生物学入門,研究会報告) - 国立国会図書館デジタルコレクション https://repository.kulib.kyoto-u.ac.jp/dspace/bitstream/2433/97613/1/KJ00004705532.pdf Title 最尤法による生物の系統関係推定について(数学者のため の分子生物学入門,研究会報告) Author(s) 加藤, 和貴; 桑田, 和正 Citation 物性研究 (2003), 81(1): 69-80 | 近隣結合法 | 図 5:LongBranchAttractionの例 | この方法の問題点として、長い枝 (種が分岐してか らの置換が沢山発生している枝)に 対応する種同士が近隣の関係にあると推定されやすいことが挙げられる。置換が全て異 なる箇所で発生している場合は、配列の異なる箇所が即ち総置換数であるが、同じ箇所が 幾度か置換 している場合は、配列の異なる箇所は総置換数より小さくなる。後者の現象は 置換 している箇所が何 らかの理由で偏っている場合や、総置換数が多い場合に発生する。 このとき、距離は配列の 「近さ」で定めるため、実際の置換数よ り距離を小さく見積 もる ことがある。図 5において、正しくは左の系統樹であったものが誤って右の系統樹のよう に推定されて しまうのである。これをlongbranchattraction(LBA)と呼ぶ。 この間題に対 し、配列の相違から総置換数を適切に推定するため、修正を加えた方法が 必要になる。一案 として、配列の各箇所の置換の発生頻度 (相対進化速度)が F分布 に従 うと仮定 して総置換数を割 り出す方法が提案されている。これは ML法とNJ法のどち ら でも利用できる。
https://www.ism.ac.jp/editsec/toukei/pdf/50-1-045.pdf 統計数理(2002) 分子系統樹法の応用と現状の問題点 真核生物の初期進化の解析を例として * 橋本 哲男1,2 ・有末 伸子2 ・長谷川 政美
分子系統樹の推論を誤らせる最も大きな要因と して最近注目を集めている Long Branch Attraction アーテファクトについて実例に則して解説 した.さらに,それを克服するための手法として,座位間の進化速度の不均質性を Γ 分布の導 入により考慮した解析を実例に対して試み,この方法の有効性を示した.
図 5. Long Branch Attraction(LBA)を示す模式図.
2017年12月22日 http://jams.med.or.jp/dic/h29material_s5.pdf 平成29度日本医学会分科会用語委員会 遺伝学用語改訂に関するワーキンググループについて
現行の用語 日本人類遺伝学会(2009) 日本遺伝学会(2017)
Variant 変異体 多様体(バリアント)
https://www.jstage.jst.go.jp/article/mammalianscience/57/2/57_387/_article/-char/ja 「Variation」の訳語として「変異」が使えなくなるかもしれない問題について:日本遺伝学会の新用語集における問題点 浅原 正和 https://www.jstage.jst.go.jp/article/mammalianscience/57/2/57_387/_pdf/-char/ja 哺乳類科学 57(2):387-390,2017 ©日本哺乳類学会 今後も variation の訳語として,伝統的に用いられ,現在も 広く使われている「変異」という訳語を残すことが望まし いと考えられる.
https://gsj3.org/wordpress_v2/wp-content/themes/gsj3/assets/docs/pdf/revisionterm_20170911.pdf 遺伝学用語改訂について 2017.9.11 日本遺伝学会 2017年9月に、「遺伝単 ~遺伝学用語集 対訳集つき~」(生命の科学遺伝別 冊:http://www.nts-book.co.jp/item/detail/summary/bio/20170929_182.html )が発刊されました。この 書籍を通じて遺伝学用語の改訂を提案しています。改訂された主な用語は以下の通りです。
説明番号 英語 旧来の訳語 新たに改訂された訳語

4 mutation 突然変異 [突然]変異**
5 variation 変異、彷徨変異 (1)多様性(2)変動 ***
6 diversity 多様性 (1)多様性(2)分岐 ***
https://jshg.jp/about/notice-reference/ 日本人類遺伝学会 遺伝学用語の改訂 (2009年(平成21年)9月改訂) https://jshg.jp/wp-content/uploads/2017/08/d5fdc84ae83d3a9a6627b7ac249e4db0.pdf No 英語 日本語 これまで
- variant 多様体(バリアント) 変異体
- mutant 変異体(突然変異体) 突然変異体
mutant は「変異体(突然変異体も可)」、 variant は「多様体(バリアントも可)」の訳を当てる。
収斂進化
https://ja.wikipedia.org/wiki/収斂進化 convergent evolution
https://ja.wikipedia.org/wiki/平行進化 parallel evolution 平行進化の結果が収斂である場合もある。
5:17 AM · Feb 19, 2021 https://twitter.com/kwasiscientific/status/1362496383618600961 Kwasi Wrensford on Twitter: "Aight, I don’t want to just complain about it, so here’s a simple explainer! Convergent evolution describes when unrelated populations of living things independently evolve similar traits in response to similar pressures in their respective environments. (1/9)" / Twitter
5:32 AM · Feb 15, 2021 https://twitter.com/vscooper/status/1361050785187049475 Vaughn Cooper on Twitter: "Chance, parallelism or convergence? A inspired by today's preprint. https://t.co/13FVi6PSJJ" / Twitter
https://www.natureasia.com/ja-jp/nature/highlights/100765 進化遺伝学:平行進化の経路 2019年10月17日 Nature 574, 7778 例えば、強心配糖体という毒素は、通常はNa+/K+-ATPアーゼを標的とするが、昆虫綱の6つの目では、この酵素のアミノ酸置換を平行進化させることにより、このような毒素に対する耐性を獲得している。 収斂形質
https://www.ncbi.nlm.nih.gov/pubmed/29650391 Trends Microbiol. 2018 Apr 10. pii: S0966-842X(18)30067-2. doi: 10.1016/j.tim.2018.03.004. [Epub ahead of print] Convergent Evolution in Intracellular Elements: Plasmids as Model Endosymbionts. Dietel AK1, Kaltenpoth M2, Kost C3. REVIEW
6:21 AM · Apr 1, 2018 https://twitter.com/9w9w9w92/status/980193458995437569 「収斂進化: 異なる系統で、異なる発生経路を使って、類似した表現型が進化すること。分子レベルの場合は、異なる系統で、類似した形質が進化すること 平行進化: 異なる系統で、同じ発生経路を使って、類似した表現型が進化すること」③232頁
http://kagakubar.com/evolution/07.html 第7話 なぜ多様な種が進化したか? 文と写真 長谷川政美 ◎自然選択
◎地球上の生物種数 ダーウィン以来、生物学者は1つひとつの種を“生命の樹”のなかに位置づける作業をコツコツと進めてきたが、その際の手掛かりはそれぞれの種がもつ形態的な特徴や生理的な特徴であった。互いに似たような特徴をもっている種は、生命の樹のなかで近い位置を占めると考えられるのだ。しかし、問題は簡単ではない。同じような特徴が、別々の系統で収斂的に進化することがあるからだ。ダーウィンもそのことには気がついていた。
◎収斂進化 これまで取り上げたほかの収斂もすべて、詳しく調べれば近縁だからではなくて、収斂の結果であることが分かる。 しかし、もっと近縁な真獣類のなかの2つの系統で収斂進化が起った場合には、そのような共通の特徴が祖先を共有するためなのか、収斂進化によるものなのかを判定することが難しくなる。
◎分子進化の中立説 このように収斂進化が起るので、2つの生物種で似たような特徴が見られても、それが共通祖先の特徴を受け継いだからなのか、あるいは別々の系統で同じような特徴が収斂的に進化したためなのかを判別しなければならない。 ところが、ハリネズミとハリテンレックの例で見られるように、形態形質だけに頼る方法で収斂進化であると判定するのは難しいことが多い。形態的な特徴には、生きていく上で有利になるように適応したものが多いので、似た環境で似たような生活をしている生物の間には似た特徴が収斂的に進化しやすいのである。
2002 https://www.ism.ac.jp/editsec/toukei/pdf/50-1-069.pdf 分子系統樹推定におけるモデルのミススペシフィケーション 系統樹を推定することは,生物進化に関わるほとんどの問題を解くための出発点である.従来この分野の研究は,比較形態学による系統樹推定が主流であったが,近年は DNA の塩基配列や蛋白質のアミノ酸配列のデータを統計的に解析する分子系統学による方法が盛んになってきた.比較形態学では研究者の主観的な判断が入り込む余地が多く,サンプルできる形態的形質の数が限られているのに対して,分子系統学ではバクテリアからヒトに至るまでのあらゆる生物を共通の客観的な尺度で比較でき,しかも研究者がその気になりさえすれば(研究費が十分にあるという条件は必要であるが),ほとんどいくらでも多くの形質(実際にはゲノム全体という制限はあるが)をサンプルすることが可能であり,これによって地球上で実際に起った進化の系統樹を再構築することができると考えられている.
形質
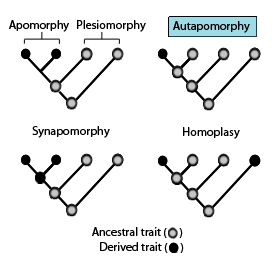
https://ja.wikipedia.org/wiki/共有原始形質 原始形質/祖先形質 plesiomorphy 共有原始形質/共有祖先形質 symplesiomorphy or symplesiomorphic character 原始形質の概念は派生的な形質状態と祖先的な形質状態を区別せずに、単に形態学的あるいは遺伝学的類似に基づいて、種をグルーピングする危険性を示している。共通祖先から受け継がれた祖先形質は系統樹のいかなる部分にも存在しうるもので、その存在をもって近縁関係を表すことはできない[3]。
https://ja.wikipedia.org/wiki/固有派生形質 autapomorphy
https://ja.wikipedia.org/wiki/共有派生形質 synapomorphy
https://sci-tech.ksc.kwansei.ac.jp/~tohhiro/systematics19/systematics3-19.pdf
- homology 相同:ある形質や遺伝子が共通の祖先に由来すること.
- homoplasy 同形形質:共通祖先に由来しない類似形質. 平行進化 (parallelism)、進化的逆転(evolutionary reversal)、. 収斂 (convergence)がある
1:28 PM - 6 Feb 2018 https://twitter.com/kfuku0502/status/960943421211815936 Kenji Fukushima on Twitter: "クマムシ比較ゲノム論文を見返してて気づいたけど、遺伝子ファミリーを共有派生形質に見立てて系統進化を議論してるところ面白いな。 Comparative genomics of the tardigrades Hypsibius dujardini and Ramazzottius varieornatus https://t.co/IOeYd4tmm6"
https://en.wikipedia.org/wiki/Sequence_homology Sequence homology is the biological homology between DNA, RNA, or protein sequences, defined in terms of shared ancestry in the evolutionary history of life. Two segments of DNA can have shared ancestry because of three phenomena: either a speciation event (orthologs), or a duplication event (paralogs), or else a horizontal (or lateral) gene transfer event (xenologs).[1]
https://github.com/davidemms/OrthoFinder OrthoFinder: phylogenetic orthology inference for comparative genomics
10:51 AM · Jun 16, 2022 https://twitter.com/xprinceps/status/1537251538585931777 Matthew Herron on Twitter: "Sequence similarity is not homology. Sequence similarity is an observation. Homology is a hypothesis. There is no such thing as 89% homology." / Twitter
https://pubmed.ncbi.nlm.nih.gov/32657391/ Bioinformatics. 2020 Jul 1;36(Suppl_1):i219-i226. doi: 10.1093/bioinformatics/btaa468. The ortholog conjecture revisited: the value of orthologs and paralogs in function prediction Moses Stamboulian 1, Rafael F Guerrero 1 2, Matthew W Hahn 1 3, Predrag Radivojac 4 https://academic.oup.com/bioinformatics/article/36/Supplement_1/i219/5870499 https://www.ncbi.nlm.nih.gov/pmc/articles/PMC7355290/
10:01 PM · May 20, 2019 https://twitter.com/marc_rr/status/1130458465300828160 Marc RobinsonRechavi on Twitter: "10 years ago @RomainStuder and I published "How confident can we be that orthologs are similar, but paralogs differ?". We were proposing that an assumption which was taken for granted should in fact be an hypothesis to test. https://t.co/qDkBKRzs3N A thread on what happened since https://t.co/2uZ39HRh4f" / Twitter https://pubmed.ncbi.nlm.nih.gov/19368988/ Trends Genet . 2009 May;25(5):210-6. doi: 10.1016/j.tig.2009.03.004. Epub 2009 Apr 14. How confident can we be that orthologs are similar, but paralogs differ? Romain A Studer 1, Marc Robinson-Rechavi
https://pubmed.ncbi.nlm.nih.gov/26966373/ Review Genomics Insights . 2016 Feb 25;9:17-28. doi: 10.4137/GEI.S37925. eCollection 2016. Inferring Orthologs: Open Questions and Perspectives Fredj Tekaia 1 https://journals.sagepub.com/doi/10.4137/GEI.S37925 https://www.ncbi.nlm.nih.gov/pmc/articles/PMC4778853/ Abstract With the increasing number of sequenced genomes and their comparisons, the detection of orthologs is crucial for reliable functional annotation and evolutionary analyses of genes and species. Yet, the dynamic remodeling of genome content through gain, loss, transfer of genes, and segmental and whole-genome duplication hinders reliable orthology detection. Moreover, the lack of direct functional evidence and the questionable quality of some available genome sequences and annotations present additional difficulties to assess orthology.
Xenologous genes are genes that appear falsely as orthologs because at least one of the pair is acquired via HGT from another species. Usually it is difficult to identify xenologs in pairwise genome comparisons. Xenologs and true orthologs might be distinguished in multiple genome comparisons if the origin of each gene can be identified.16
https://pubmed.ncbi.nlm.nih.gov/23552219/ Review Nat Rev Genet. 2013 May;14(5):360-6. doi: 10.1038/nrg3456. Epub 2013 Apr 4. Functional and evolutionary implications of gene orthology Toni Gabaldón 1, Eugene V Koonin https://www.nature.com/articles/nrg3456 https://www.ncbi.nlm.nih.gov/pmc/articles/PMC5877793/ Abstract Orthologues and paralogues are types of homologous genes that are related by speciation or duplication, respectively. Orthologous genes are generally assumed to retain equivalent functions in different organisms and to share other key properties.
Glossary
Paralogues Homologous genes related by duplication. Xenologues Homologous genes that originate from horizontal gene transfer.
https://pubmed.ncbi.nlm.nih.gov/25646426/ Proc Natl Acad Sci U S A . 2015 Feb 17;112(7):2058-63. doi: 10.1073/pnas.1412770112. Epub 2015 Feb 2. Phylogenomics with paralogs Marc Hellmuth 1, Nicolas Wieseke 2, Marcus Lechner 3, Hans-Peter Lenhof 4, Martin Middendorf 2, Peter F Stadler 5 https://www.pnas.org/doi/10.1073/pnas.1412770112 https://www.ncbi.nlm.nih.gov/pmc/articles/PMC4343152/ SIGNIFICANCE We demonstrate that the distribution of paralogs in large gene families contains in itself sufficient phylogenetic signal to infer fully resolved species phylogenies. This source of phylogenetic information is independent of information contained in orthologous sequences and is resilient against horizontal gene transfer. An important consequence is that phylogenomics data sets need not be restricted to 1:1 orthologs.
To evaluate the robustness of the species trees in response to noise in the input data, we used simulated gene families with different noise models and levels: (i) insertion and deletion of edges in the orthology graph (homologous noise), (ii) insertion of edges (orthologous noise), (iii) deletion of edges (paralogous noise), and (iv) modification of gene/species assignments (xenologous noise).
https://pubmed.ncbi.nlm.nih.gov/16285863/ Review Annu Rev Genet . 2005;39:309-38. doi: 10.1146/annurev.genet.39.073003.114725. Orthologs, paralogs, and evolutionary genomics Eugene V Koonin 1 https://www.annualreviews.org/doi/10.1146/annurev.genet.39.073003.114725 Keywords homolog, ortholog, paralog, pseudoortholog, pseudoparalog, xenolog
https://ja.wikipedia.org/wiki/相同#遺伝子の相同性 相同性はあるかないかのどちらかであって、「相同性が高い」「ホモロジーが低い」といった表現は誤りである。これはたいていの場合「配列類似性が高い」「シミラリティーが低い」と言い換えることで適切な表現になる[2]。DNAやタンパク質の配列の類似性を高速に調べるためのツールとして、BLAST、FASTAなどがある。
2022/07/26 https://ultrabem-branch3.com/informatics/bioinformatics/homolog.html ホモログ,オーソログ,パラログの定義と違い
https://github.com/haruosuz/ksbn/blob/master/2018/README.2018.4.md#5-7 進化系統樹によるホモログ・パラログ・オーソログの解析
https://www.fifthdimension.jp/documents/molphytextbook/datapreparation_lecture.pdf 分子系統樹推定に適した配列データセットの作成 田辺晶史
- 相同 = 同一の祖先形質に由来する
- 多重配列整列 = 相同形質の同定
2013-06-25 17:29:07 https://ameblo.jp/sakaguchikengo/entry-11560351406.html 酵素やタンパク質因子の多様性分類 | ぐうたら能無し教授の日記(坂口謙吾) 更にこの多様化をつぶさに観察すると、もう一つの特徴が浮き出る。普通に考えるとメカが同じなら、そのメカを司る酵素や因子も進化の過程で同じ遺伝子が進化発展したと考えがちである。こういう同じ遺伝子から発展した類縁関係のある遺伝子群(類縁遺伝子)のことを“ホモログ”(homolog)と呼んでいる。しかし、必ずしも“ホモログ”ではない。SSB/RPAを見ると、確かに原核生物のSSBと真核生物のRPAには遺伝子の発展として断絶がある。このように機能活性は同じだが、遺伝子の起源が異なる遺伝子同士は“アナログ”(analog)と呼んでいる。このような観点から酵素やタンパク質因子を見ると、かなり細かくいろいろなタイプに分かれる。これを正確に分類するために5つに分けた専門用語が作られた。
*“ホモログ”(homolog);これは“パラログ”(paralog)や“オルソログ”(ortholog)を含む総称で、共通の祖先(起源)を持つ類縁遺伝子である。相同性の高い遺伝子配列を持つ。
*“アナログ”(analog);違う起源を持つ遺伝子だが、機能や活性が同じになった遺伝子同士。
2011-03-24 https://togetter.com/li/307635 相同性検索じゃなくて、配列類似性検索 - Togetter
2009 https://www.jst.go.jp/nbdc/bird/jinzai/literacy/streaming/ 平成21年度ゲノムリテラシー講座 分子系統解析(講義3) 講義資料3 (PDF;1569 KB) https://www.jst.go.jp/nbdc/bird/jinzai/literacy/streaming/h21_4_3b.pdf ホモログは、オーソログとパラログの2種類に分けられる
2007年07月25日(水) http://seesaawiki.jp/w/psyberformula/d/%B0%E4%C5%C1%BB%D2%A5%DB%A5%E2%A5%ED%A5%B0 遺伝子ホモログ - PsyberStyle - Seesaa Wiki(ウィキ)
http://nesseiken.info/Chiba_lab/index.php?cmd=read&page=授業%2FH24%2F進化生物学I%2F系統樹に関する基本用語 ホモプラシー(同形形質)homoplasy :共有祖先からの由来に基づかない類似性。平行現象、逆転がある
http://www5b.biglobe.ne.jp/~hilihili/keitou/cnvergence.html 矛盾:祖先から受け継がれたのではない特徴が混じっている場合
それは収斂
わらし:同形形質(homoplasy :ホモプラシー)ってやつだな。
https://www.keisoshobo.co.jp/book/b61590.html 1.4 形質不整合とホモプラシーの問題
http://seikilo.s1008.xrea.com/sober.html 『過去を復元する : 最節約原理,進化論,推論』用語集(更新5.12)
1.3対象と属性
祖先的(ancestral)あるいは原始的(plesiomorphic)な形質状態を0、 子孫的(derived)派生的(apomorphic)な形質形態を1と置く。
1.4形質不整合とホモプラシーの問題
ホモロジー(相同:homology):2種の共有するある特性が、一方の種から他方に受け継がれたものかまたはその特性をもつ共通祖先から変化することなく遺伝されたものならば、その種の特性は他種の特性とホモロジーの関係にあると呼ばれる。
ホモプラシー(非相同:homoplasy):類似特性が別々の起源に由来するものならば、その共通特性はホモプラシーとされる。
http://www.kochi-u.ac.jp/w3museum/Fish_Labo/Member/Endoh/animal_taxonomy/2013animaltaxonomyPDF/2013animaltaxonomy03.pdf ホモプラジーが生じる原因は,収れん進化,平行進化,形質の逆転である.
https://neurobiotaxis.livejournal.com/886.html Homology, homoplasy, analogy: The concept of “sameness” in evolutionary biology - The Principles of Neurobiotaxis
Homology and homoplasy
The opposite of historical homology is homoplasy, defined as the structural similarity between two traits in two species without phyletic continuity – which is equivalent to saying that, even though the traits are similar, the common ancestor of species A and B did not present the trait. There are three different types of homoplasy: convergence, parallelism, and reversal.
Analogy
The wing of a bird and the wing of a bat are homoplastic as wings, but share the same function – flying.
https://wikidiff.com/analogy/homoplasy Homoplasy vs Analogy - What's the difference? | WikiDiff
全体的類似度
http://www.columbia.edu/itc/envsci/hahn/w4601/class_notes/week_2.html Overall similarity may or may not be best estimate of relationship.
http://leeswijzer.org/files/SystematicThinking.html 〔3〕全体的類似度とクラスタリング — いくつかの計算例 122
http://cse.naro.affrc.go.jp/minaka/R/R-cluster2.html 距離尺度 数量表形学では,OTU間の類似性を表形的(phenetic)な全体的類似度(overall similarity)によって数値化するという基本的な姿勢がある.その哲学的な動機づけは別として,OTUごとに数値化された形質データがあるとき,OTU間の類似度をどのような尺度によって数値化すればいいのかという問題は,クラスター分析だけではなく,距離法に基づく系統樹推定法の論議にも関わってくる. (8 September 2003)
http://cse.naro.affrc.go.jp/minaka/R/R-cluster.html クラスター分析の光と闇 数量表形学は,数値化された多変量データに基づいて分類対象(OTU: operational taxonomic unit)の間の近さを距離(全体的類似度overall similarity)として計算し,距離の近いものを群(クラスター)にまとめていくというクラスター分析の手法を生物分類体系の構築に適用する.数量表形学者は,系統という実証不可能な概念を含む分類体系だめだと批判し,系統に代わる生物間の関係を表現する尺度として,多数の形質に基づく全体的類似度を用いようとした.自然分類とはできるだけ多くの形質を共有する分類群から成るべきであり,そういう分類体系はより多くの予測を可能にする一般的な分類体系(general purpose classification)であるという信念に鼓舞された数量表形学者たちは,伝統的な進化分類学への攻勢を強めた. (3 September 2003)
http://seikilo.s1008.xrea.com/sober.html 『過去を復元する : 最節約原理,進化論,推論』用語集(更新5.12)
全体的類似度法に基づいて系統推計をするならばA(BC)という仮説が最も強く支持される。
全体的類似度法は共有派生形質と共有原始形質に同等の重みづけをする。 分岐学的最節約法は共有派生形質だけを系統関係の証拠とみなす。
全体的類似度法は、共有派生形質と共有原始形質のどちらにも同じ重みを与えるので、ある形質のどの状態が原始的であり、どれが派生的であるかを決める必要がない。一方、分岐学的最節約法は、この2種類の共有制についての証拠としての価値は根本的に異なるという見解に立っている。したがって、分岐学的最節約法を用いるときには、各形質についてどの形質状態が原始的であるのかを確認しなければならない。種ゼロの形質状態は、直接観察すればわかるわけではなく、推定されるものである。この推定、すなわち形質の「方向性」の決定をどのようにして行うかについては、第六章で・・・。
[第三章:共通原因の原理]
3.1 表形学の2つの陥穽
全体的類似度(overall similarity)から真の系統関係が推定できない理由 1.ホモプラシー 2.固有派生形質(autapomorphy) 全体的類似度は派生的類似性だけでなく原始的類似性をも含んでいる。 そのためにこの二つの陥穽におちいる危険性がある。
Shimodaira-Hasegawa検定(SH test)
http://www.microbesonline.org/fasttree To quickly estimate the reliability of each split in the tree, FastTree computes local support values with the Shimodaira-Hasegawa test (these are the same as PhyML 3's "SH-like local supports"). http://www.microbesonline.org/fasttree/#Support Local support values To quickly estimate the reliability of each split in the tree, FastTree uses the Shimodaira-Hasegawa test on the three alternate topologies (NNIs) around that split.
2015/10/20 https://www.fifthdimension.jp/documents/molphytextbook/molphytextbook.ja.html 分子系統学演習 データセットの作成から仮説検定まで 田辺晶史 7.2.1 KH・SH・AU検定 ブートストラップリサンプリングによって、複数の系統樹間で尤度の差が有意と言えるのか否かを調べる方法がKishino-Hasegawa検定(KH test)です(Kishino and Hasegawa, 1989)。しかし、この方法では3つ以上の系統樹を比較する場合に多重検定となってしまい第1種の過誤(有意な差は無いのに誤検出する)が増大してしまうため、その抑制を行う補正を加えたのがShimodaira-Hasegawa検定(SH test)です(Shimodaira and Hasegawa, 1999)。ただし、この方法では逆に第2種の過誤(有意な差があるのに検出できない)が増大してしまいます。そこで、近似的に不偏な検定(approximately unbiased (AU) test)は、マルチスケールブートストラップ法を用いてさらに高度な補正を行うことでこれをある程度解決しています(Shimodaira, 2002)。
Dec 12, 2014 https://www.slideshare.net/astanabe/hypothesistesting-lecture 系統樹と系統仮説の関係と系統仮説間の統計的比較方法に関する説明。 https://www.fifthdimension.jp/documents/molphytextbook/2011/hypothesistesting.pdf https://www.fifthdimension.jp/documents/molphytextbook/hypothesistesting_lecture.pdf 系統樹・系統仮説の可視化と系統仮説間の統計的比較 RELL 法を応用した検定 ● Kishino-Hasegawa 検定 ● 2 つの樹形の対数尤度比のバラツキを RELL 法により推定し, 0 よりも有意に大きいなら帰無仮説 ( 尤度が等しい ) を棄却する ● Shimodaira-Hasegawa 検定 ● 3 つ以上の樹形を比較するときに FWER を統制して第 1 種の過 誤を抑制する ( そのかわり,第 2 種の過誤が増大 ) ● 近似的に不偏な (Approximately Unbiased) 検定 ● マルチスケールブートストラップにより第 1 種の過誤と第 2 種の 過誤の両方を抑制する
2015年10月30日(金) https://twilog.org/leeswijzer/date-151030 #196ws Approximately Unbiased 検定:マルチスケールブーツストラップを用いて Type-I と Type-II 過誤をともに抑える検定法. #196ws Shimodaira-Hasegawa 検定:KH検定の多重補正. #196ws Kishino-Hasegawa 検定:RELL 法を用いて各サイトの尤度のリサンプリングを用いれば,樹形ごとの尤度の差を検定することができる.
2012-11-02 https://twilog.org/leeswijzer/date-121102 #166ws 下平英寿のマルチスケールブーツストラップを用いた Approximately Unbiased test は Type-I, II の過誤を同時に最小化する. #166ws (承前)多重比較の補正をしたものが,Shimodaira-Hasegawa 検定. #166ws 元データのリサンプリングよりも,サイトごとの尤度をリサンプリングすれば尤度の分散がラクに調べられる(Kishino-Hasegawa のRELL検定).
March 2013 http://sesj.kenkyuukai.jp/images/sys%5Cinformation%5C20130321180221-8212BF2A71DFD6F3C0771B1CD38A4B573F10E1A1DFB4257C3EA694B142996870.pdf Shimodaira-Hasegawa検定を開発した。これは、Kishino-Hasegawa検定で欠けていた 多重比較を系統樹選択の問題に持ち込んだものである(H. Shimodaira and M. Hasegawa(1999)Mol. Biol. Evol., 16: 1114-1116)。
2004年7月 http://stat.sys.i.kyoto-u.ac.jp/titech/multiboot-j.html マルチスケール・ブートストラップ法 図2.ブートストラップ確率. まず通常のブートストラップ法を適用してブートストラップ確率を計算した結果が図2の各系統樹の下に書いてあります.これがある閾値以上の系統樹は真実である可能性があると判断し,逆にそれより小さい系統樹は真実ではないと判断します.閾値として一般に良く用いられる0.05を使うと,赤線で囲んだ2個の系統樹が選ばれます.残りの13個は真実でないと判断されます. 図3.下平・長谷川検定による確率値. 一般にブートストラップ確率は精度が低く,系統樹推定に応用すると,あやまった発見に結びつく可能性が高いことが分かっています (false positiveの確率が大きい).そこで,この誤り確率を小さくする手法を開発して(下平 1993, Shimodaira 1998),系統樹推定に応用しました (Shimodaira and Hasegawa 1999,被引用回数).この方法は統計学で古くから知られている多重比較法という考え方をモデル選択に応用したものであり,現在では下平・長谷川検定(Shimodaira-Hasegawa test)と呼ばれ,分子進化学の標準手法の一つとして広く利用されています. 計算した確率値を図3に示します.確率値が閾値0.05以上になる系統樹は緑線で囲んだ8個あり,ウサギとマウスが近縁であるという古典的な仮説も真実の可能性があると判断されます.つまり生物学的な発見をしたとはみなされないことになります. 下平・長谷川検定は安全であり,あやまった発見をする確率は小さいのですが,一方で本当の発見を見逃してしまう可能性が高いことが分かっています (false negativeの確率が大きい).つまりブートストラップ法と下平・長谷川検定はどちらも検定のバイアスがあり,その方向が異なっているのです.
ブートストラップ法によるクラスタ分析のバラツキ評価 (特集 DNA配列の統計解析) 下平 英寿 統計数理 50(1), 33-44, 2002 https://www.ism.ac.jp/editsec/toukei/pdf/50-1-033.pdf 分子系統樹の解析では対数尤度を最大にする樹状図を選択しているので,これは統計的モデ ル選択の一例になる.下平(1993, 1999),Shimodaira(1998)はリサンプリングを利用して対 数尤度の多重比較を行いモデル選択の信頼性を確率値として評価する方法を提案した.これは Shimodaira-Hasegawa(SH)test(Shimodaira and Hasegawa(1999), Goldman et al.(2000))と して分子系統樹の分野で利用されはじめている.この分野では Kishino-Hasegawa(KH)test (Kishino and Hasegawa(1989))がブートストラップ確率に並ぶ標準手法として広く利用され ているが,SH test は KH test で見落とされていた「選択バイアス」を多重比較法で補正したも のである.
https://twitter.com/search?q=Selective%20inference%20lang%3Aja
2018 https://www.jst.go.jp/kisoken/crest/evaluation/nenpou/h29/JST_1111081_15656320_2017_PYR.pdf Selective Inference とは,データに基づいて選択された仮説を同一のデータで評 価する際に,選択バイアスを除去するため,仮説を選択するイベントの条件付分布により統計的仮 説検定を行うものである.
2016-02-28 http://ryamada22.hatenablog.jp/entry/20160228/1456616097 ぱらぱらめくるselective inference論文 - ryamadaの遺伝学・遺伝統計学メモ Selective inferenceは「データを眺めることで、説明変数を絞りこみ(selectionし)、そのうえで絞り込んだ変数について推定(inference)することにするが、そのときselectionがinferenceに影響するので、どうするのがよいのかを考えよう」と言ってよいでしょう。
2018/10/25 https://ultrabem.com/other_topics/genetics/synonymous_substitutions.html 同義置換と非同義置換: 計算方法、意味、論文での示し方
http://mikuhatsune.hatenadiary.com/entry/20130621/1371803603 Ka/Ks (dN/dS) の計算 - 驚異のアニヲタ社会復帰の予備
http://www.fish-evol.org/dNdS_ji.html dN/dS 検定 2018 年 4 月 12 日 井上 潤,米澤 隆弘 このサイトでは dN/dS 値を推定することで,タンパク質コーディング遺伝子 (DNA 配列) に働いた正の自然選択を検出する解析 (dN/dS 検定) を紹介します.PAML に含まれるプログラム codeml を使います.バージョンは paml4.7a を使っています.
https://ja.wikipedia.org/wiki/進化的軍拡競走 進化的軍拡競走(または、-争、evolutionary arms race)とは生物の進化において、ある適応とそれに対する対抗適応が競うように発達する(かのようにみえる)共進化プロセスの一種。
共進化は必ずしも進化的軍拡を促すわけではない。例えば相利共生は協調的な適応を二つの種の間に引き起こすかも知れない。ある種の花は紫外線色の模様でミツバチを花の中心に誘導し、受粉を促す。また共進化は一般的な定義では異種間に起きるものを指す。雌雄間の対立のような同一種内の軍拡競走は除外される。身近な進化的軍拡は人間と微生物の間で行われる。抗生物質は微生物に選択圧を加え、微生物は薬剤耐性を進化させる。
適応主義 批判的な意味では、十分な証拠無しに生物の特徴を適応であると結論する研究や研究者のことを指すことが多い。
適応と目的論 通常、生物学者は適応的な形質を「○○のための形質」と呼ぶ。このために、しばしば進化には意図や方向性がある、または目的論を含意していると誤解される。このような表現は「自然選択によってその形質に影響を与える一連の遺伝的変異が蓄積され、その形質が形成された」と言う表現の短縮形である。 現在では適応は自然選択の結果で、受動的なものであり、生物が主体的に適応しようとして起きるものではないと考えられている。
https://ja.wikipedia.org/wiki/前適応 preadaptation
2:15 PM · Oct 9, 2022 https://twitter.com/KawataMasakado/status/1578977453623545856 Masakado Kawata on Twitter: "進化学における「適応」ついて改めて解説しました。定義を明確にするというよりも、「適応」を定義することの難しさについて考察しました。 進化における「適応」という言葉をめぐって|河田 雅圭 @KawataMasakado #note #最近の学び https://t.co/decOO7lLRS" / Twitter https://note.com/masakadokawata/n/n2dfc4217831e
8:06 AM · May 11, 2020 https://twitter.com/mutselbalance/status/1259620836740263937 らむ on X: "中学生から始める適応進化理論 - Life is Beautiful @academist_cf との共催 #数理で読み解く科学の世界 のフォローアップ第一弾です。 https://t.co/rELMhF4T2c" / X
https://lambtani.hatenablog.jp/entry/2020/05/10/200459 中学生から始める適応進化理論 - Life is Beautiful
- 生物の適応進化の考え方 1.1 遺伝する性質が進化する原理 遺伝形質 自然淘汰による進化 (適応進化 1.2 遺伝子はどこからくるのか:突然変異 1.3 適応という考え方が「生物を理解する営み」を学問たらしめた 1.4 いろいろな「なぜ」があっていい Nothing in Biology Makes Sense Except in the Light of Evolution -- 直訳すると、「生物学においては、進化を考慮してこそ、その意義がある」
https://lambtani.hatenablog.jp/entry/2020/05/19/233210 中学生から始める適応進化理論2:よくある誤解 - Life is Beautiful 2. 自然淘汰による適応進化にまつわる よくある質問・誤解 2.1「順応」は人生の一部。だが言葉は変化(進化)する 2.2 種のための進化は起こりません。 2.3 集団レベルで自然淘汰が作用することはあります。 2.4 適応進化以外にも、進化は起こりうる より一般に、進化を起こす要因には 自然淘汰 突然変異 遺伝的な浮動(個体数が小さいことで、確率的な変化の効果が、相対的に大きくなる) 移動分散 (集団間で、個体の行き来があることで、集団の平均的な性質の観測値が変化する) があり、どれも適応進化と中立進化にとって重要な要素です。 2.6 退化も進化の一部 2.7 大事なこと:「良い」、「優れている」、は自然には存在しない。
https://ja.wikipedia.org/wiki/インテリジェント・デザイン 『宇宙・自然界に起こっていることは機械的・非人称的な自然的要因だけではすべての説明はできず、そこには「デザイン」すなわち構想、意図、意志、目的といったものが働いていることを科学として認めよう』という理論・運動である。近年のアメリカ合衆国で始まったものであり、1990年代にアメリカの反進化論団体、一部の科学者などが提唱し始めたものである。
生物の合目的性
10月 24, 2014 https://junotkja.wordpress.com/2014/10/ 10月 | 2014 | 大塚淳のサイト跡地 現代の我々は、そうした合目的性が、自然選択を通じて実際の進化の原因になりうる、ということを知っています。しかしそれは一つの可能性・仮説に過ぎません。実のところそうした合目的性はたまたま生じた副産物であって、実際の進化の原因ではなかったかもしれない。
2013年09月25日 22:30 https://mixi.jp/view_bbs.pl?comm_id=82248&id=74922095 [mixi]合目的性への挑戦 - 進化生物学 | mixiコミュニティ
https://kagakubar.com/evolution/05.html 進化の歴史|科学バー 第5話 偶然性の重視 文と写真 長谷川政美 ◎ダーウィンの「自然選択説」 ダーウィンの「自然選択説」は、このようなデザイン論や目的論を否定する。彼は、集団中に偶然に生ずるたくさんの変異のなかからさまざまな環境によりよく適応した個体が生き残ることによって、進化が起るとした。多様な生物が進化する仕組みとして自然選択説を考えたのであった。目的論に頼らなくても、ランダムに起きる変異のなかからより適応した個体が選択されることによって、結果的に進化に方向性を与えられるのだ。無目的な偶然的な現象によって、生物の合目的性がもたらされるというこの考えは、画期的なものであった。
http://fs1.law.keio.ac.jp/~popper/v3n1yamane.html 進化論的認識論と行動的無意味 - リードルの人間理解 - 山根 正気 そのようにふるまう生物のシステムを、擬合理的装置とよび、その生物が過去に選別された条件がこんにちも続いているとすれば、それはまさに合目的的とみられるわけである。生物のもつ合目的性をこのようにとらえる立場にたいして、著者は科学的目的論(テレオノミー)という表現をもちいている。さて、問題はこの先である。 生物個体がそなえている合目的性を疑う者はいまい。 ところが、この本の著者は、合目的性の論理をいとも無批判に社会や種にまで拡張する。 合目的性の原因を種の維持にもとめることが、いかに誤った結論を導くかをみてみよう。
Neutral theory of molecular evolution
https://www.brh.co.jp/research/formerlab/miyata/2005/post_000003.html
パラダイムシフト:分子進化の中立説- 宮田 隆の進化の話 - JT生命誌研究館
2003 https://www.nig.ac.jp/museum/evolution/01_c.html 分子進化の中立説 ~木村資生と中立説
Mar 11, 2016 https://www.slideshare.net/takahironishimu/ss-59418690 ポケモン系統樹かいてみた
2010-02-24 https://www3.atwiki.jp/cloud9science/pages/175.html 進化の系統樹 - cloud9science @Wiki - アットウィキ
アブダクション 真実
https://www.yodosha.co.jp/smart-lab-life/statics_pitfalls/statics_pitfalls03.html 統計の落とし穴と蜘蛛の糸 著/三中信宏 第3回 データのふるまいをモデル化する (2017/11/24公開) アブダクションの要点は,選び出された“ベスト”の仮説が必ずしも最終的な“真実”である必要はないことです. モデルと本質:既知から未知へのアブダクション しかし,データ解析の現場では変量間の関係を支配する“真”の式はいつまでも未知のまま現象の背後に隠れています. アブダクションは「真実」を言い当てる予言を行なうのではなく,観察データを説明するには選択肢中のどのモデルが「よりよい」かを比較検討する推論作業です.ここでいう「よりよいモデル」とは「より真実に近いモデル」とはかぎりません.
https://twitter.com/leeswijzer/status/536990181241671680 #TodaiStat 【回答】しかし,統計学でのアブダクションは,データに基づく帰無仮説と対立仮説の絶対的ランキング(真偽)ではなく,対立仮説間の相対的ランキング(支持されるかしないか)に過ぎません. 4:10 PM - 24 Nov 2014
https://sakstyle.hatenadiary.jp/entry/20140419/p1 2014-04-19 エリオット・ソーバー『過去を復元する』三中信宏訳 そこで、全体的類似性からすると、A(BC)が真の系統仮説ということになる(BとCがより近い分類群)。
http://www.jppa.or.jp/shiryokan/pdf/63_03_66.pdf 分子系統学:最近の進歩と今後の展望 しかし,系統推定とはそもそも「真実」の系統樹を発見することを目的とはしていない。我々は,データから結論にいたる論証様式といえば,演繹(deduction)かあるいは帰納(induction)しか思い浮かばないことが多い。いずれも,特定の仮説の真偽の証明を目指す論証様式である。しかし,系統推定における論証は演繹でも帰納でもない。 アブダクションによる推論では,選ばれた仮説の真偽は問題ではない。
http://cse.naro.affrc.go.jp/minaka/files/seibutsu-keitou.html 生物系統学 三中信宏 4-6-2:最節約法は真実を導くか?-一般化最節約法を目指して 284
https://ja.wikipedia.org/wiki/Wikipedia:検証可能性#「真実かどうか」ではなく「検証可能かどうか」
改善 同化
https://www.ncbi.nlm.nih.gov/pubmed/28887484 Sci Rep. 2017 Sep 8;7(1):10985. doi: 10.1038/s41598-017-11226-9. Differential degeneration of the ACTAGT sequence among Salmonella: a reflection of distinct nucleotide amelioration patterns during bacterial divergence. https://www.ncbi.nlm.nih.gov/pmc/articles/PMC5591236/ Discussion To gain a snapshot on the general patterns of genomic nucleotide composition optimization or amelioration in the process in which bacteria diverge into different niches such as distinct hosts (e.g., humans vs livestock or wild animals) or different tissues (causing systemic vs local infections), we analyzed a subset of the highly conserved short sequence CTAG among representative Salmonella pathogens by profiling the SpeI cleavage sequence ACTAGT in comparison with E. coli and other enteric bacteria.
https://pubmed.ncbi.nlm.nih.gov/18356951/ Genome . 2008 Feb;51(2):164-8. doi: 10.1139/g07-105. Gene amelioration demonstrated: the journey of nascent genes in bacteria Pradeep Reddy Marri 1, G Brian Golding
水平伝播の成功には、外来遺伝子と受容ゲノム間のコドン使用互換性が必要 https://www.ncbi.nlm.nih.gov/pubmed/15240837 Mol Biol Evol. 2004 Oct;21(10):1884-94. Epub 2004 Jul 7. Successful lateral transfer requires codon usage compatibility between foreign genes and recipient genomes. Medrano-Soto A1, Moreno-Hagelsieb G, Vinuesa P, Christen JA, Collado-Vides J. https://academic.oup.com/mbe/article/21/10/1884/1025177 Codon Usage Amelioration Is Unnecessary We need to re-evaluate the notion that a foreign gene or fragment of DNA (assumed as atypical in sequence characteristics) becomes compositionally more similar to the host genome with increasing residence time. This process has been called “amelioration,” after reasoning that it makes a gene “better” (Lawrence and Ochman 1997), implying better translatability. This concept is a natural consequence of methods assuming that most foreign genes display mainly a poor-CU profile. However, as our results indicate, most foreign genes with poor CU are counter-selected for successful integration, suggesting that CU amelioration might occur in a small fraction of genes.
https://pubmed.ncbi.nlm.nih.gov/15728743/ Nucleic Acids Res . 2005 Feb 23;33(4):1141-53. doi: 10.1093/nar/gki242. Print 2005. Variation in the strength of selected codon usage bias among bacteria Paul M Sharp 1, Elizabeth Bailes, Russell J Grocock, John F Peden, R Elizabeth Sockett https://www.ncbi.nlm.nih.gov/pmc/articles/PMC549432/ But even this may have little relevance: in the same way that it is thought that the codon usage of horizontally transferred genes may take many millions of years to ameliorate to that of a new host genome (58), strongly selectively biased codon usage may take a very long time to decay after a reduction in effective population size, i.e. the codon usage bias currently observed may still be due in some part to evolutionary processes that occurred millions of years ago.
https://pubmed.ncbi.nlm.nih.gov/10430917/ Comparative Study Proc Natl Acad Sci U S A . 1999 Aug 3;96(16):9184-9. doi: 10.1073/pnas.96.16.9184. Genome signature comparisons among prokaryote, plasmid, and mitochondrial DNA A Campbell 1, J Mrázek, S Karlin https://www.ncbi.nlm.nih.gov/pmc/articles/PMC17754/
- This similarity might mean either that relatively close genome signatures promote plasmid establishment or that the plasmids have acquired their hosts’ signatures during long-term residence. Experiments on conjugation can address issues such as specificity vs. wide host range and relevance of size and signature for plasmid compatibility. We interpret the similarities in signature between plasmids and their bacterial hosts as implying that they share much replication and repair machinery, perhaps because the prokaryotic cell is not compartmentalized to the degree that the eukaryotic cell is.
- (ii) During the plasmid’s residence in its current host, the same pressures that homogenize the signature throughout the chromosome will also drive the plasmid’s signature towards that of the host. Such amelioration has been postulated for the G+C content of laterally transferred DNA (22). We suspect that the signature should ameliorate even more rapidly, for both plasmids and laterally transferred chromosomal segments.
https://www.ncbi.nlm.nih.gov/pubmed/9689094 Proc Natl Acad Sci U S A. 1998 Aug 4;95(16):9413-7. Molecular archaeology of the Escherichia coli genome. Lawrence JG1, Ochman H. https://www.ncbi.nlm.nih.gov/pmc/articles/PMC21352/ Amelioration of Horizontally Transferred Genes.
https://www.ncbi.nlm.nih.gov/pubmed/9089078 J Mol Evol. 1997 Apr;44(4):383-97. Amelioration of bacterial genomes: rates of change and exchange. Lawrence JG1, Ochman H. https://link.springer.com/article/10.1007/PL00006158
At the time of introgression, horizontally transferred genes reflect the base composition of the donor genome; but, over time, these sequences will ameliorate to reflect the DNA composition of the new genome because the introgressed genes are subject to the same mutational processes affecting all genes in the recipient genome. This process of amelioration is evident in a large group of genes involved in host-cell invasion by enteric bacteria and can be modeled to predict the amount of time required after transfer for foreign DNA to resemble native DNA.
- Base composition varies widely among bacterial species. Base compositions range from 25% GC in Mycoplasma to 75% GC in Micrococcus, which is much larger than the range in overall GC contents observed among animals or plants. The differences in base composition among bacterial species are largely due to biases in the mutation rates at each of the four bases—termed ‘‘directional mutation pressure’’ by Sueoka (1961, 1962, 1988, 1992, 1993, Sueoka et al. 1959)—which vary between species.
Because the process of amelioration is caused principally by mutational biases, the effects of this process are most obvious at sites having little or no selective constraints.
https://www.caister.com/cimb/v/v3/91.pdf Synonymous Codon Usage in Bacteria
At the time of transfer the introduced genes have codon usage that is typical for the donor genome. With time, however, the codon usage evolves to match the codon usage of the host genome. This process of codon usage adjustment is called “amelioration” (Lawrence and Ochman, 1997; Lawrence and Ochman, 1998) and it is sometimes possible to estimate its rate and predict the age of lateral gene transfer events.
https://ja.wikipedia.org/wiki/対立遺伝子
dominant recessive
https://ja.wikipedia.org/wiki/優性
https://www.m3.com/open/clinical/news/article/559530/ 「優性」「劣性」言い換え報道、学会が一部否定 日本人類遺伝学会、「日本遺伝学会と協議の事実ない」とコメント 2017年9月27日
2017/9/15 https://www.nikkei.com/article/DGXLASDG15H7R_V10C17A9CR8000/ 「優性」「劣性」用語使わず 日本遺伝学会が言い換え :日本経済新聞
https://mainichi.jp/articles/20170913/k00/00m/040/036000c 遺伝学会:優性・劣性の用語見直し 文科省にも改訂要請へ - 毎日新聞 2017年9月12日
http://gsj3.jp/revisionterm.html 遺伝学用語改訂について 2017.9.11 日本遺伝学会
祖先推定
https://github.com/haruosuz/r4bioinfo/tree/master/R_tree#ancestral-reconstruction
https://en.wikipedia.org/wiki/Ancestral_reconstruction
https://www.waseda.jp/top/news/70339 新酵素創出 環境負荷の低減に期待 – 早稲田大学 最も古い祖先よりも現代に近い年代の酵素を復元したところ、高い耐熱性と常温での高い酵素活性を併せ持つ、現存の天然酵素にはあまり見られない特性を示した 早稲田大学人間科学学術院の赤沼哲史(あかぬま さとし)教授、古川龍太郎(ふるかわ りゅうたろう)助教らの研究チームは、現在の自然界には存在しないが過去には存在したと推定される酵素の祖先アミノ酸配列を予測し、実際に復元しました。得られた祖先復元型酵素の耐熱性と酵素活性を調べた結果、常温での高い酵素活性と耐熱性を併せ持つ、現存の天然酵素にはあまり見られない特性を持つ酵素であることが分かりました。 ・掲載誌:Scientific Reports ・論文名:Ancestral sequence reconstruction produces thermally stable enzymes with mesophilic enzyme‑like catalytic properties https://www.nature.com/articles/s41598-020-72418-4 Ryutaro Furukawa, Wakako Toma, Koji Yamazaki & Satoshi Akanuma
2016 https://www.jstage.jst.go.jp/article/chikyukagaku/50/3/50_199/_article/-char/ja/ ゲノム配列の比較から明らかになった初期生命の好熱性 赤沼 哲史 4.1 コンピュータ解析による祖先配列の推定
2013? http://www.f.waseda.jp/akanuma/research/currenttopics/ancestor.html Ancestral design 祖先型設計法による耐熱性タンパク質の創出 産業利用に有利なタンパク質を開発するうえで、タンパク質の耐熱化設計は重要な課題である。 今後は、この祖先型設計法を用いて、産業に利用可能な多くのタンパク質の耐熱化設計に取り組む予定であり、すでに、リグ ニン分解酵素等を標的として選んでいる。 赤沼哲史、山岸明彦
https://pastml.pasteur.fr/ http://iwasakilab.k.u-tokyo.ac.jp/iwasaki/publications.html 進化情報学において「祖先状態復元」は生物進化のプロセスを知るための重要な手段です。その具体的な手法としては周辺事後確率を推定するものと同時確率を推定するものがありますが、いずれも、結果をそのまま可視化して解釈を行うことは困難でした。本研究では意思決定理論で用いられるBrier scoreと可視化上の工夫により、解釈が容易な祖先状態復元ソフトウェアPastMLとして実装し、ウェブサーバーを公開しました。論文ではさらに実際にデングウイルスやHIVウイルスの祖先状態復元を行い、その有効性を検証しています。
2019-06-17 https://pubmed.ncbi.nlm.nih.gov/31127303/ Mol Biol Evol . 2019 Sep 1;36(9):2069-2085. doi: 10.1093/molbev/msz131. A Fast Likelihood Method to Reconstruct and Visualize Ancestral Scenarios Sohta A Ishikawa 1 2 3, Anna Zhukova 1, Wataru Iwasaki 2, Olivier Gascuel 1 https://academic.oup.com/mbe/article/36/9/2069/5498561 https://www.ncbi.nlm.nih.gov/pmc/articles/PMC6735705/
https://www.ccs.tsukuba.ac.jp/wp-content/uploads/sites/14/2018/05/17a52.pdf 筑波大学計算科学研究センター 平成29年度学際共同利用 報告書 図 2:PASTML による HIV-1C 3,036 株の進化疫学解析 ブラジルおよびインドへの HIV-1C 株の流入後、特定の薬剤耐性変異 (RT:D67N, RT:K70R, RT:M184V)の獲得と拡散が起こったことが示された。
https://www.ncbi.nlm.nih.gov/pubmed/30371900
Nucleic Acids Res. 2019 Jan 8;47(D1):D271-D279. doi: 10.1093/nar/gky1009.
Ancestral Genomes: a resource for reconstructed ancestral genes and genomes across the tree of life.
Huang X1,2, Albou LP2, Mushayahama T2, Muruganujan A2, Tang H2, Thomas PD2.
https://www.ncbi.nlm.nih.gov/pmc/articles/PMC6323951/
Ancestral Genomes (http://ancestralgenomes.org) is a resource for comprehensive reconstructions of these ‘fossil genomes’.

http://grasp.scmb.uq.edu.au/ GRASP Ancestral Sequence Reconstruction Version beta 2019.12.08
https://www.ncbi.nlm.nih.gov/pubmed/30458842 BMC Syst Biol. 2018 Nov 20;12(Suppl 5):100. doi: 10.1186/s12918-018-0618-2. On the reconstruction of the ancestral bacterial genomes in genus Mycobacterium and Brucella. Guyeux C1, Al-Nuaimi B2,3, AlKindy B4, Couchot JF2, Salomon M2. https://www.ncbi.nlm.nih.gov/pmc/articles/PMC6245693/ It was not the case of AlignSeqs, available in the R module called decipher [30].
https://www.ncbi.nlm.nih.gov/pubmed/28993971 Bull Math Biol. 2017 Dec;79(12):2865-2886. doi: 10.1007/s11538-017-0354-6. Epub 2017 Oct 5. Ancestral Sequence Reconstruction with Maximum Parsimony. Herbst L1, Fischer M2.
https://www.ncbi.nlm.nih.gov/pubmed/27404731 PLoS Comput Biol. 2016 Jul 12;12(7):e1004763. doi: 10.1371/journal.pcbi.1004763. eCollection 2016 Jul. Ancestral Reconstruction. Joy JB1,2, Liang RH1, McCloskey RM1, Nguyen T1, Poon AF1,2.
https://www.ncbi.nlm.nih.gov/pubmed/26351909 Biol Chem. 2016 Jan;397(1):1-21. doi: 10.1515/hsz-2015-0158. Ancestral protein reconstruction: techniques and applications. Merkl R, Sterner R.
http://kmooog.hatenablog.com/entry/2015/07/31/133246 祖先配列再構築-marginal reconstruction と joint reconstruction

2015-05-13 http://nesseiken.info/Chiba_lab/index.php?授業%2FH19%2F系統解析論%2FMesquite 講義メモ:MESQUITEのごく簡単な使い方 祖先形質状態の推定
http://d.hatena.ne.jp/leeswijzer/20071128/1196279645 Ancestral Sequence Reconstruction 祖先塩基配列や祖先アミノ酸配列の推定と復元に関する論文集.祖先復元問題と樹形推定問題よりも“解きやすい”問題ではあるが,応用的にも実用的にも重要な分野だと思う.系統樹を踏まえた推論や考察をする場合,樹形だけでなく,仮想祖先の形質状態が決まっていないと先に進めない論議は少なくない.むしろ,樹形と祖先状態はつねにペアで推定しておく方がのちのちのためには便利だと思う.
1997-05-15 https://researchmap.jp/leeswijzer/ https://ci.nii.ac.jp/naid/110002936265 分岐学における祖先推定: 組合せ最適化問題としての系統推定 三中 信宏
1995 http://www.naro.affrc.go.jp/archive/niaes/sinfo/result/result11/result11_27.html 系統樹における祖先形質状態の最節約的復元法 [要約] 種の形質データと系統樹の樹形を与えたとき、系統樹上の仮想的共通祖先の形質状態を最節約的に復元するための基礎理論を離散数学を用いて展開し、動的計画法に基づく計算アルゴリズムを開発した。 [その他] 研究課題名:生物系統分類のための数量的方法の開発
Published on Mar 3, 2012 https://www.slideshare.net/tmr_kohei/kashiwar-2 言語系統樹と雑煮の祖先形質復元(Kashiwa.R #2) tmr_kohei 田村光平
https://www.weblio.jp/content/協調進化 concerted evolution 遺伝子変換などにより、重複遺伝子が同じ構造を保つように進化すること。
https://en.wikipedia.org/wiki/Concerted_evolution Concerted evolution is a process that may explain the observation that paralogous genes within one species are more closely related to each other than to members of the same gene family in another species, even though the gene duplication event preceded the speciation event. The high sequence similarity between paralogs is maintained by homologous recombination events that lead to gene conversion, effectively copying some sequence from one and overwriting the homologous region in the other.
https://ja.wikipedia.org/wiki/遺伝子ファミリー 協調進化への寄与 多重遺伝子族の多くでは遺伝子が完全に同じかほぼ同じ配列を有し、非常に同一性が高い。この同一性の維持の過程は協調進化である。協調進化は、不等交差が繰り返されたり遺伝子の転移や保存が繰り返されたりして起こる。
https://www.primate.or.jp/forum/第42回集団遺伝学講座/ この現象を協調進化concerted evolutionとよぶが、重複した遺伝子群によくみられる。
では協調進化はどのようにして生じたのであろうか。代表的な機構として考えられるのは染色体の不等交叉unequal crossing-overと遺伝子変換gene conversionの二つである。
一致
incongruence 不調和
Last update: May 8, 2020, Contributors: M Bui http://www.iqtree.org/doc/Concordance-Factor Concordance Factor
https://www.fifthdimension.jp/documents/molphytextbook/ 分子系統学演習 - データセットの作成から仮説検定まで
系統樹・系統仮説の可視化と系統仮説間の統計的比較:講義編 https://www.fifthdimension.jp/documents/molphytextbook/hypothesistesting_lecture.pdf RELL 法を応用した検定 ● Kishino-Hasegawa 検定 – 2 つの樹形の対数尤度比のバラツキを RELL 法により推定し, 0 よりも有意に大きいなら帰無仮説 ( 尤度が等しい ) を棄却する ● Shimodaira-Hasegawa 検定 – 3 つ以上の樹形を比較するときに FWER を統制して第 1 種の過誤 を抑制する ( そのかわり,第 2 種の過誤の危険が増大 ) ● 近似的に不偏な (Approximately Unbiased) 検定 – マルチスケールブートストラップにより第 1 種の過誤と第 2 種の 過誤の両方を抑制する
いつやるか ● 最尤系統樹の中で特に重要な系統仮説を検証する ● 既知の対立する系統仮説を比較する
分子系統解析における様々な問題について https://www.fifthdimension.jp/documents/molphytextbook/answers.pdf 多遺伝子座連結解析の問題 ● パラログ混入や浸透交雑、水平伝播、incomplete lineage sortingで、遺伝子座間で支持する系統樹が異なる(不調和) – 連結解析のブートストラップ値悪化やアーティファクトの原因 ● Internode Certainty, ICAll, TreeC, TCA値で不調和を評価 – IC, ICAは系統仮説ごとに出るがTC, TCAは系統樹全体で1つ – ICの範囲は1~0で、ICAは1~マイナス?、小さいほど不調和 – TC, TCAはIC, ICAの総和.OTU数-3で割ってデータ間比較 ● 使用する遺伝子座を選別する – Clusterflock, Concaterpiller, Conclustador ● species tree methodを使う – STEM, BUCKy, ASTRAL, *BEAST, BEST(MrBayes)
2015-04-15 http://hashiyuki.hatenablog.com/entry/2015/04/15/195458 RNA-Seqデータを用いた系統解析 (1): 解析の方針 - NGSデータ解析まとめ (7) Bayesian concordance analysisによるconcordance treeの作成、種系統樹と異なる分岐を示す遺伝子の同定(BUCKyなどを使用)
2015年9月18日 http://www.nibb.ac.jp/plantdic/blog/?p=778 Phylogeny of land plants 陸上植物の系統
連結遺伝子を用いた解析では、ツノゴケ類が陸上植物の最基部、次いで、タイ類とセン類からなる単系統群が分岐した。コアレッセンス解析では、コケ植物の3群が単系統群となった。コケ植物が単系統という推定は、葉緑体ゲノム上の遺伝子をアミノ酸配列を用いて解析した結果と一致している(Nishiyama et al. 2004)。
連結遺伝子を用いた解析とコアレッセンス解析とではどちらが妥当なのだろうか。まず、コアレッセンス解析について簡単に説明しよう。祖先集団で遺伝子多型があった場合、その遺伝子は種が分岐するよりも前に分岐していたり、種分化の途中で多型アリルのどちらかが失われたりする。これは、不完全遺伝子系統仕分け(incomplete lineage sorting)と呼ばれ、遺伝子系統樹と種系統樹が一致しない理由の一つである。そのため、より多くの遺伝子系統樹を比較して、そのうちでもっとも確率の高いものを種系統樹として推定するコアレッセンス解析が考案された (Mirarab et al. 2014)。
一方、連結遺伝子を用いた系統解析は、コアレッセンス解析よりも解析が楽であるが、異なった進化モデル(進化速度など)と歴史を持つ遺伝子をまとめて一つにしているため、間違った系統樹が高い統計的支持を受ける場合があることがわかっている(Mirarab et al. 2014)。
http://www.fish-evol.org/phyMarker.html 系統推定 19 Sep. 2019. Jun Inoue 酵母 23 種から得られた 1070 遺伝子 (シンテニーからオーソログと確認されている) を系統解析した研究では,どの遺伝子から得られた樹形も concatenate して得られた樹形とは異なっていた. concatenate は本当に良いか疑問を投げかける.全配列を使うことよりも解析に有用な遺伝子配列だけを使うこと,および極端な不一致が見られた分岐を見極めること ブートストラップ解析は単一遺伝子など少数のデータ解析でサンプリングエラーを検出するために開発されたとする.このため,genome wide なデータを concatenate した解析には不向きと指摘.たとえ極端に異なる対立仮説があっても 100% の支持確率を出しやすいとする (Perspective 最初の段落).
https://www.ncbi.nlm.nih.gov/pubmed/23657258 Nature. 2013 May 16;497(7449):327-31. doi: 10.1038/nature12130. Epub 2013 May 8. Inferring ancient divergences requires genes with strong phylogenetic signals. Salichos L1, Rokas A. https://www.nature.com/articles/nature12130 http://vu-wp0.s3.amazonaws.com/wp-content/uploads/sites/191/pdfs/2013_Salichos_Rokas_Nature.pdf Phylogenomic analysis of 1,070 orthologues from 23 yeast genomes identified 1,070 distinct gene trees, which were all incongruent with the phylogeny inferred from concatenation.
Figure 1: The yeast species phylogeny recovered from the concatenation analysis of 1,070 genes disagrees with every gene tree, despite absolute bootstrap support. a, The yeast species phylogeny recovered from concatenation analysis of 1,070 genes using maximum likelihood. Asterisks denote internodes that received 100% bootstrap support by the concatenation analysis. Values near internodes correspond to gene-support frequency and internode certainty, respectively. The scale bar is in units of amino-acid substitutions per site. b, The distribution of the agreement between the bipartitions present in the 1,070 individual gene trees and the concatenation phylogeny, as well as the distribution of the agreement between the bipartitions present in 1,000 randomly generated trees of equal taxon number and the concatenation phylogeny, measured using the normalized Robinson–Foulds tree distance.

First, we should abandon using bootstrap support on concatenation analyses of large data sets. Bootstrapping was developed long before the discovery of high-throughput sequencing, and it is an extremely useful measure of sampling error—that is, the robustness of inference when data are limited39—such as when a single gene is analysed. Given the availability and ease of generating genome-scale data40, relying on bootstrap to analyse phylogenomic data sets is misleading, not only because sampling error is minimal but also because its application will, even in the presence of notable conflict9 or systematic error6,16, almost always result in 100% values9,19,41.
https://tandy.cs.illinois.edu/yang-zhang.pdf Presented by Yang Zhang 4/16/2015 Bootstrap in concatenation is misleading
https://www.ncbi.nlm.nih.gov/pubmed/22666370 PLoS One. 2012;7(5):e37607. doi: 10.1371/journal.pone.0037607. Epub 2012 May 30. Gene repertoire evolution of Streptococcus pyogenes inferred from phylogenomic analysis with Streptococcus canis and Streptococcus dysgalactiae. Lefébure T1, Richards VP, Lang P, Pavinski-Bitar P, Stanhope MJ. https://www.ncbi.nlm.nih.gov/pmc/articles/PMC3364286/ Level of concordance between core gene trees was also assessed using Bucky [39] Figure 2 The seven topologies and the number of genes mapped to them, found by the Bayesian gene tree concordance analysis. https://www.ncbi.nlm.nih.gov/pmc/articles/PMC3364286/figure/pone-0037607-g002/

http://www.stat.wisc.edu/~ane/bucky/ BUCKy: A program for Bayesian Concordance Analysis

https://www.ncbi.nlm.nih.gov/pubmed/22272658 BMC Genomics. 2012 Jan 24;13:38. doi: 10.1186/1471-2164-13-38. Comparative genomic analysis of the genus Staphylococcus including Staphylococcus aureus and its newly described sister species Staphylococcus simiae. Suzuki H1, Lefébure T, Bitar PP, Stanhope MJ. https://www.ncbi.nlm.nih.gov/pmc/articles/PMC3317825/
統計数理(2008) https://www.ism.ac.jp/editsec/toukei/abstract/56-1j.html 複数遺伝子の結合データに基づく分子系統樹の推測 —真核生物の大系統の解析を例として— http://www.ism.ac.jp/editsec/toukei/pdf/56-1-145.pdf 一方,分子系統学研究の現場では,系統マーカーとして複数の遺伝子を用いると,遺伝子間 で矛盾した解析結果が得られるという状況の多いことが明らかとなった.その矛盾が統計的誤 差の範囲を超えているという場合も少なからず存在することも判明した.しかしこのような状 況が生ずるのは当然の帰結とも考えられた.個々の遺伝子にはそれぞれの歴史があり,固有の 進化パターンがあるのにもかかわらず,それらを同一の,しかも極めて不十分な進化モデルの もとで比較しているという状況を鑑みれば,誤差自体が過少推定であることは疑う余地はない. また,遺伝子間で統計的誤差の範囲内の矛盾が生ずることは頻繁であるため,一般に 1 つの遺 伝子に含まれている,系統に関する情報のうち真の系統を反映するシグナルの総和がそれほど 大きくないことも明らかである.こうした状況下,シグナルの増強のために複数の遺伝子の情 報を結合して系統の推測を行うという試みがなされるようになってきた.そして現在,大規模 データの蓄積や計算環境の飛躍的改善と相俟って,複数遺伝子の結合データ解析は日常的なア プローチとして頻繁に行われている.
2005 http://jppa.or.jp/archive/pdf/59_03_01.pdf 三つ以上の遺伝子で独立に系統樹を作成し,次にそれを重ね合わせる。 そして樹形が concordance から conflict に転換する点を 種の境界と認識する。
https://www.ncbi.nlm.nih.gov/pubmed/14663083 Microbiology. 2003 Dec;149(Pt 12):3507-17. Extracting phylogenetic information from whole-genome sequencing projects: the lactic acid bacteria as a test case. Coenye T1, Vandamme P. http://mic.microbiologyresearch.org/content/journal/micro/10.1099/mic.0.26515-0#tab2 Analysis of concordance between techniques
https://github.com/haruosuz/r4bioinfo/blob/master/R_tree/README.md#tree-distance
https://en.wikipedia.org/wiki/Robinson–Foulds_metric Robinson–Foulds metric
http://evolution.genetics.washington.edu/phylip/doc/treedist.html Treedist -- distances between trees
http://www.fish-evol.org/TREEDIST_JGI.html 井上 潤:TREEDIST 2009 年 11 月 14 日 改訂 TREEDIST は系統樹間の違いを距離として表すプログラムです.PHYLIP パッケージに含まれるプログラムなので,PHYLIP のページから他のプログラムと一緒にダウンロードしてください.
https://sites.google.com/site/kfuku52/mp/disttopol 樹形間距離 - Kenji Fukushima's website
Unweighted Robinson-Foulds distance
Weighted Robinson-Foulds distance
Nearest-neighbor interchange distance (NNI distance)
Subtree pruning and regrafting distance (SPR distance)
Tree bisection and reconnection distance (TBR distance)
Quartet metric
Triples metric
Nodal distance
Split nodal distance
Branch score
Transposition distance
TreeKO
Average standard deviation of split frequency (ASDSF)
その他の方法
分岐時間
http://evolgen.biol.se.tmu.ac.jp/labo/tamura/161026.pdf 実習1: MEGA7のダウンロードとインストール 4.RelTime による分岐時間推定 (1)ここでは細胞骨格型のアクチン遺伝子のみを用い、種間の分岐年代推定を行ってみる。脊椎動物には paralog が複数あるので、以下のように Sequence Data Explorer を使って beta actin のみをチェックする。
(6)左側のフレームで Min および Max Divergence Time に 1216(Time Tree of Life より)を入力し、[Finished]をクリッ クする。
分岐年代は 678.5(287-1070)MYA と推定される(Timetree of life によれば平均 692 MYA)。
https://ja.wikipedia.org/wiki/年代測定 分子時計 遺伝子やたんぱく質の種による違いから、種が分岐した年代を計算する。
2017 年 9 月 25 日 改訂 http://www.fish-evol.com/mcmctreeExampleVert6/text1.html 井上 潤:MCMCTREE・簡単な例題 MCMCTREE はベイズ法に基づいて分岐年代推定を行うソフトウェアです.
2012 年 7 月 16 日 http://www.geocities.jp/ancientfishtree/DatabaseEnglish.html 井上 潤: 系統解析の英語例文 分岐年代推定
http://www.geocities.jp/ancientfishtree/Cauchy.html 井上潤:化石制約がベイズ年代推定に及ぼす影響
http://www.geocities.jp/ancientfishtree/AncientDivTime2.html 井上潤:古代魚の分岐年代推定
https://kimuraseminar.wordpress.com/2017年8月3日-系統学実習/ 分岐年代推定 ここではPAMLパッケージのMCMCTREEプログラムを用います。
https://www.ncbi.nlm.nih.gov/pubmed/28673048 Syst Biol. 2017 Jun 29. doi: 10.1093/sysbio/syx060. [Epub ahead of print] Taming the BEAST - A community teaching material resource for BEAST 2.
https://www.ncbi.nlm.nih.gov/pubmed/17996036 BMC Evol Biol. 2007 Nov 8;7:214. BEAST: Bayesian evolutionary analysis by sampling trees.
https://sites.google.com/site/kaysakuma/japanese/ima-migrate-beast/beastno-shii-fang BEASTの使い方 - Kay's website (20170204追記)
2014 https://www.jstage.jst.go.jp/article/sjst/54/3/54_13037/_article/-char/ja/ オンラインツール“TimeTree: the timescale of life”を用いた生物多様性科学の授業開発とその評価
http://yagays.github.io/blog/2013/07/10/timetree/ TimeTreeで生物種間の分岐年代を調べる - Wolfeyes Bioinformatics beta
https://www.fifthdimension.jp/wiki.cgi 田辺晶史, 2010, "データセットの作成と仮説検定、分岐年代推定法概論", 日本進化学会第12回東京大会進化学夏の学校『新しい分子系統解析論:データ作成から祖先形質復元まで』. 進化学夏の学校2010:新しい分子系統解析論:データ作成から祖先形質復元まで参照.
http://www.ism.ac.jp/editsec/toukei/abstract/56-1j.html 第56巻第1号37-54(2008) 特集「分子進化と統計科学」 [研究詳解] コドンモデルを用いた分岐年代のベイズ推定 ftp://statgen.ncsu.edu/pub/thorne/mypapers/seokishinothorne2008.pdf
https://en.wikipedia.org/wiki/Effective_population_size
https://ja.wikipedia.org/wiki/最小存続可能個体数 Minimum Viable Population、MVP) 類似した用語に有効個体数(Effective population size)がある。
https://www.primate.or.jp/old/PF/yasuda/10.html 集団の有効な大きさeffective size https://www.primate.or.jp/old/PF/yasuda/26.html 10.集団の有効な大きさ 集団の有効な大きさeffective size (number) of populationを求める工夫がWrigt(1931)により最初に導入された。
水産育種48(2018) https://researchmap.jp/?action=cv_download_main&upload_id=224033 最 低必要個体数を算出するための値、例えば集団の有効 な大きさ(effective population size, Ne)と
1991 https://www.jstage.jst.go.jp/article/psj1985/7/1/7_1_23/_pdf 集 団の有効 な大 きさ (effective population size :N) とは各親個体 が次世代 に残す子の数で ウエ イ トをつけた繁殖 個体数 と定義 され
https://en.wikipedia.org/wiki/Phylogenetic_diversity
https://methodsblog.wordpress.com/tag/faiths-phylogenetic-diversity/ Faith’s Phylogenetic Diversity | methods.blog
https://sites.google.com/site/noteofpaediatricsurgery/in-silico/meta16s/figtree/keitouteki 系統的多様性 - Draft of Pediatric Surgery
2007.3 http://www.naro.affrc.go.jp/archive/niaes/magazine/083/mgzn08304.html 論文の紹介: 生物多様性を進化系統学的な尺度で測る (情報:農業と環境 No.83 2007.3) 生物多様度の尺度として、系統樹(phylogenetic tree)に基づく「系統学的多様性(PD: phylogenetic diversity)」を提案 提唱者である Daniel P. Faith の定義では (1)、ある生物群の系統学的多様度とは、その生物群を系統樹上で結ぶ枝の長さの総和として求められる。
https://www.ncbi.nlm.nih.gov/pubmed/16535456 Appl Environ Microbiol. 1996 Nov;62(11):4299-301. Problems in measuring bacterial diversity and a possible solution. Watve MG, Gangal RM.
http://www.ism.ac.jp/editsec/toukei/abstract/60-2j.html#263 「統計数理」60巻第2号要旨 第60巻第2号263-278(2012) 特集「多様性と進化の統計解析」 [研究詳解] α多様性の測定と確率文字列の理論
Shannon 指数や Simpson 指数では,種が明確に定義されていることや各個体をあいまい さなく同定できることが前提になっており,これらの指標の微生物群集への適用には問題があ ることが当初から指摘されていた(Staley, 1980; Torsvik et al., 1990). また,図 1 と 2 において 示されているように,微生物群集からの 16S リボソーム RNA 遺伝子配列のデータの 1 つの特 徴として強いクラスター性があるが,種数に対応する異なる配列数を数える指標や,塩基多様 度のような異なるサイト数に基づく指標では,このようなクラスター構造を反映できないとい う問題がある.代替的な方法の研究として,Watve and Gangal(1996), Hughes et al.(2001), Hong et al.(2006)などがあるが,理論的な基礎を持つ体系的な方法とは言えなかった.
組換え
http://hp.brs.nihon-u.ac.jp/~inasweb/narai/narai/xiang_tong_zu_huanetoha.html 相同組換えとは 遺伝的組換えは,さらに以下の5種類に分けられます。
https://pubmed.ncbi.nlm.nih.gov/33238876/ BMC Genomics . 2020 Nov 25;21(1):829. doi: 10.1186/s12864-020-07262-x. Impact of homologous recombination on core genome phylogenies Caroline M Stott 1, Louis-Marie Bobay 2 https://www.ncbi.nlm.nih.gov/pmc/articles/PMC7691112/
https://pubmed.ncbi.nlm.nih.gov/30670614/ mBio . 2019 Jan 22;10(1):e02494-18. doi: 10.1128/mBio.02494-18. Impact of Homologous Recombination on the Evolution of Prokaryotic Core Genomes Pedro González-Torres 1 2 3, Francisco Rodríguez-Mateos 4, Josefa Antón 1 5, Toni Gabaldón 6 3 7 https://www.ncbi.nlm.nih.gov/pmc/articles/PMC6343036/
https://ja.wikipedia.org/wiki/遺伝子重複
https://www.jstage.jst.go.jp/article/nl2008jsce/45/166/45_26/_article/-char/ja ゲノム情報全盛のいま使える分子系統解析のエッセンス 山口 和晃, 工樂 樹洋 2019 年 45 巻 166 号 p. 26-31 https://www.jstage.jst.go.jp/article/nl2008jsce/45/166/45_26/_pdf/-char/ja MBD4 と MeCP2 はともにメチル化 CpG 結合ドメインを持っており、無脊椎動物を外群として含めた分子系統樹によって、これらが脊椎動物の進化の初期に遺伝子重複によって分かれたことが示された(図4D)。
https://www.brh.co.jp/research/formerlab/miyata/2005/post_000008.html 生物最古の枝分かれ:問題点と重複遺伝子による解決- 宮田 隆の進化の話 - JT生命誌研究館
生物最初の分岐に関する論争:何が問題だったのか
問題の解決:古細菌は真核生物に近縁
すべての生物は一対の重複遺伝子EF-1a/Tuと EF-2/Gを持っている。すべての生物がこの一対の酵素を持っているということは、この一対の遺伝子を作った遺伝子重複は3つの超生物界が枝分かれする前に起きたことになる。たしかにGTP結合タンパク質族の系統樹はそのことを再現している。このことを利用すると超生物界の有根系統樹が作れる。3つの超生物界それぞれからEF-1a/Tuと EFー2/Gを取り出し、これらのアミノ酸配列の比較から無根系統樹をまず作る。そしてEFー1α/TuとEFー2/Gが遺伝子重複によって枝分かれした時期が、3つの超生物界が枝分かれする以前になるように系統樹の根を決める。
この複合系統樹は、EFー1α/TuとEFー2/Gのいずれにおいても、古細菌は真核生物に近縁な関係にあり、真正細菌とは遠縁になることを示している(図3)。こうして生物の最も初期の進化で起きた分岐の順序が決定できた。
生物最古の時代に頻繁に起きた遺伝子水平移動
https://www.jstage.jst.go.jp/article/jjb/19/Special_Issue/19_Special_Issue_S5/_article/-char/ja/ 遺伝子系統樹から我々はなにを絞りだせるか 斎藤 成也 1998 年 19 巻 Special_Issue 号 p. S5-S13
遺伝子重複の時点を種分化の時点と誤って推定することがありえる(図3 a)。この場合,種分岐の年代を過大に見積もることになる。もちろん,種分化のあとに,そ. れぞれの種で独立に遺伝子重複が生じることもある(図3b)。
https://www.hobochuritsu.com/entry/2019/02/12/215303 Newick形式で系統樹の樹形が同じか確かめる - ほぼ中立ブログ apeのread.tree関数でNewick形式を読み込んで、all.equal.phylo関数で樹形が同じかを判定します。
https://sci-tech.ksc.kwansei.ac.jp/~tohhiro/bioinfo18/bioinfo2018-5.pdf
2017.12.29 https://stats.biopapyrus.jp/r/graph/phylogenetic-tree.html 系統樹 ape ade4 | R を利用した系統樹の描き方 系統樹のデータは、newick フォーマットあるいは nexus フォーマットによって記載される。R では、ape や ade4 などのパッケージを利用することで、これらのフォーマットのファイルを扱うことができる。
http://kiliwave.hatenablog.com/entry/2016/11/16/205345 Newick形式のファイルを修正して多分岐の系統樹を作成する
http://cse.naro.affrc.go.jp/minaka/cladist/tamagawa2011-1.html 2011年度・玉川大学「分子系統進化学」・実習1 今回の実習では,系統樹に含まれる「単系統群(monophyletic group)」の情報がどのように図式表現されているのかを理解するために,生物系統学で広く用いられている「Newick形式」(→解説記事:「系統推定の基本用語」/「The Newick tree format」)のコード化の方法を学び,「ことば」としての系統樹に関する基本概念を学習する.
http://ryamada22.hatenablog.jp/entry/20050513/1115948852 Newick書式から系統樹を描く - ryamadaの遺伝学・遺伝統計学メモ
https://www1.doshisha.ac.jp/~mjin/R/Chap_43/43.html Rと系統樹(2) 系統樹をテキスト形式で記録したデータとして Newick フォーマットがある。Newick は 系統樹を次のように、階層的に丸括弧で区切ったテキスト形式のデータである。枝の長さはコロンの右に数値で示す。
https://sites.google.com/site/kawashima38/home/writingtable/xi-tong-shu-ji-shunofomatto 系統樹記述のフォーマット - kawashima38
http://nesseiken.info/Chiba_lab/index.php?cmd=read&page=授業%2FH24%2F進化生物学I%2F系統樹に関する基本用語 ニューイックフォーマット(Newick format) 系統樹の分岐関係を()を使って表現する方法。枝長やブーツストラップ確率も含めることができる。
https://www.jst.go.jp/nbdc/bird/jinzai/literacy/streaming/h21_4_3b.pdf Newick format: テキスト形式での系統樹表現 同じ系統樹を表すNewick formatは複数
2018-08-02 http://gendai.ismedia.jp/articles/-/56608 『種の起源』から約160年……まだ「種」が定義できないってマジ?(山田 俊弘) | ブルーバックス | 講談社(1/3)
January 16, 2017 http://schaechter.asmblog.org/schaechter/2017/01/do-bacterial-species-really-exist-and-why-should-we-care.html Small Things Considered: Do bacterial species really exist and why should we care?
2016年8月 http://www.keisoshobo.co.jp/book/b239975.html 生物学の哲学入門 - 株式会社 勁草書房
[第6章] 種 6.4 微生物と本質主義
http://d.hatena.ne.jp/shorebird/20161222 書評 「生物学の哲学入門」 - shorebird 進化心理学中心の書評など
最後に著者たちは話を微生物に広げて検討を行い,恒常的性質クラスター説は所詮巨生物(本書では非微生物をこう呼ぶ)中心主義であると断罪し,種カテゴリー反実在,種概念の排除などの議論を好意的に紹介している.
http://d.hatena.ne.jp/shorebird/20100920 書評 「進化論はなぜ哲学の問題になるのか」 - shorebird 進化心理学中心の書評など
http://leeswijzer.hatenablog.com/entry/2016/09/10/102132 「種問題」ははてしなく続く - archief voor stambomen http://www.nikkei-science.com/page/magazine/0809/200809_060.html 生物の種とは何か | 日経サイエンス 「系統学的種概念」 しかし,系統学的種概念の採用により,種の細分化が今後どんどん進んでしまうのではないかと警戒する意見もある。ロンドン大学インペリアルカレッジのメイス(Georgina Mace)は,「系統学的種概念の問題点は,どこまで分ければいいのかがわからないという点にある」という。少なくとも原理的には,突然変異が1つでもあれば,それを共有する小さな動物群に対して種名を与える根拠となるだろう。「しかし,そこまで細かく分けるのは少々ばかげている」と彼女は言う。メイスは,ある個体群を新種として独立させるためには,それが,地理的分布や気候条件あるいは捕食者被食者の関係の点で生態的に異なっていることを示すべきだと言う。 しかし,種を分けすぎることを心配するのではなく,あくまでデータに基づいて判断すべきだという研究者もいる。ニューヨーク州立大学ストーニーブルック校のウィーンズ(John Wiens)は,「種の細分化を懸念するのは本末転倒だろう」と反論する。「最初から『種数の上限はここまで』と制限するのはとても科学的とはいえない」と彼は主張する。 種の定義をめぐる問題をさらに厄介にしているのが微生物だ。生物多様性の90%以上を占める微生物の種は,どう定義すればよいのだろう? 動植物にも,微生物にも適用できる種の定義は可能なのだろうか?
http://nesseiken.info/Chiba_lab/index.php?cmd=read&page=授業%2FH24%2F進化生物学I%2F系統樹に関する基本用語
- 「節」は、「種」(あるいはより上位の分類群)、「集団」、「個体」など、ある生物のまとまりや、「遺伝子」を代表して示している。
- 分類群 (taxon, 複数形はtaxa) 名称の与えられた、生物群。
https://ja.wikipedia.org/wiki/タクソン (taxon、複:タクサ、taxa)とは、生物の分類において、ある分類階級に位置づけられる生物の集合のこと。訳語としては分類群(ぶんるいぐん)という用語が一般的である。
https://ja.wikipedia.org/wiki/階級_(生物学) rank は、門・綱・目・科・属・種などの、分類の階層のこと。
https://ja.wiktionary.org/wiki/分類群 界(kingdom)→門(phylum)→網(class)→目(order)→科(family)→属(genus)→種(species)と分類された集団。