High latency and steady CPU increase since migration from 3.12.x to 4.x [HZ-871] #20055
Comments
|
Maybe some helpful additional configs we specify in various places: And |
|
Interestingly, also the network graphs differ since the upgrade to 4.1.x... |

|
@ramizdundar Any insights already by any chance? This is getting to a point where our application becomes unresponsive now...Is this maybe related to #19630? |
|
Unfortunately, no. Because BETA release is close, I believe I won't have much time to look into this. I will try to dive deeper next week. |
|
I've tried the latest 4.2.x with the same result, so I changed the title accordingly. |
|
@dreis2211 can you post the exact 4.x versions you tested with? (I am particularly interested if your issue Is reproducible with the initial 4.0 release?) Buildup of |
|
@vbekiaris As it's essentially a Spring-Boot application that was upgraded to (at that point) 2.5.5 from 2.3.x the initial broken version is using 4.1.5 - see https://github.com/spring-projects/spring-boot/blob/34677508a76d0decad4ba2ced46ccfcf6804fb4a/spring-boot-project/spring-boot-dependencies/build.gradle#L390. We are now on 4.2.4 without any noticeable impact. The application keeps getting unresponsive after the CPU has grown too much. So we were never on 4.0. We're using a relative vanilla setup with everything autoconfigured by SB, so diagnostics are likely disabled. We're also not using any client as we are building up instances via I'm still wondering if this is somehow connected to #19630 which never got backported to 4.x (and its connected PRs). Especially because |
|
Internal Jira issue: HZ-871 |
|
There are several thousand topics. If there is a single ReadManyOperations per topic, there should be several thousand ReadManyOperations within the OperationParker. But since there are nearly 100K ReadManyOperations, there must be many concurrent invocations per topic! I'm not sure what the cause is of this isue. If it is just a problematic usage of the API, we can't do much about it. If there is a memory leak that causes ReadManyOperations the be retained, it must be addressed by us. Can you provide some information how many concurrent requests you have per topic? |
|
@pveentjer How would I get that information? If it would be problematic usage of the API why would this work with 3.x then? I would expect that there is no major regression if the changelog and migration guides don't really mention anything particular in that regards. |
|
Do you know the maximum number of concurrent read requests you have over all topics? Is that a few thousand or close to 100K? |
|
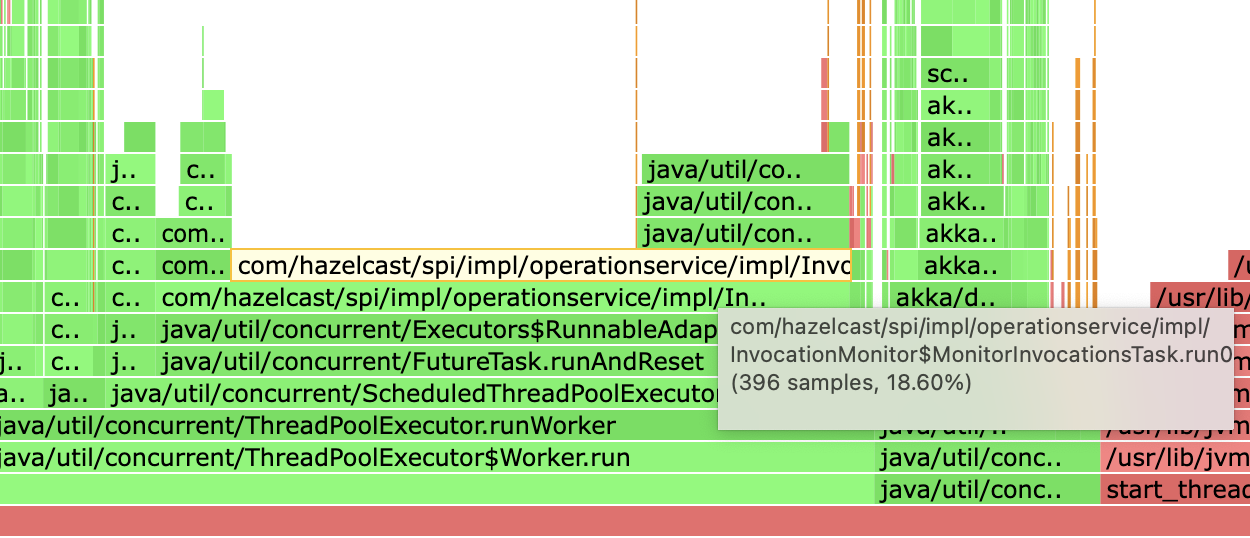
What kind of profiler are you using? Could you run with async profiler and see what is going on? It will give a good impression of where time is spent. The ratio between GC and non GC activities is also very useful. I can help you set it up. |
|
@pveentjer Please look at the screenshots above. They are from async-profiler. |
|
@pveentjer I'd like to ask again - how would I get the information about topics and concurrent requests per topic? |
|
Keep in mind that this is still very early on in terms of rising CPU levels. More data will follow tomorrow, but I thought I do one today as well. |
Yes, we will prepare backports for 4.2.z and 4.1.z |
|
Not really new stuff, but here is a profiling from this morning with Regarding the big libjvm block we're trying to get debug symbols up and running to get further insights, but I assume the operation and invocation handling is also pressuring the GC a bit |
|
As we're not having debug symbols yet, I used I can't see too much GC activity here. Yes, eden space is filling up in let's say 10% on average in every second and we have a young GC every ~6-8 seconds, but that doesn't seem too bad. Especially if one can trust the timings at the end there's not much added in the 10 seconds interval (60ms) |
|
Although not a very big block, I just saw that This seems to have been introduced with #17734, but has also been backported already to 3.12.13. We were on Hazelcast 3.12.11 before the upgrade, so we were never impacted by this change. I wonder if this could be optimized again - especially since Shouldn't it be safe then to have a |

|
I might miss something, but I wrote the following test on our end to imitate the behaviour of As background: We're using EDIT: I see weird things in the heap dump that forced me to investigate this in the first place. I see |

Based on the async profiler HTML file, it seems that in 38% of the collected CPU samples, GC is the cause. It would be good to have the debug symbols, but pretty sure this is GC. |
|
Well, this is just libjvm stuff - not necessarily GC. It could be method compilation etc (also unlikely since jstat is not showing this either)... It is likely GC, but since |
|
The problem described above is btw similar to #17061 . We end up with invocations that never really vanish under certain circumstances even though the MessageRunner might be cancelled already. |
|
Method compilation should be be out of the way pretty quickly. So I would be surprised if that would be the cause. I typically see the GC activities as red blocks next to the application; hence I'm pretty sure it is GC related. But.. best to get the the debug symbols so we know for sure. Let me check the ReliableTopicProxy.(add|remove)MessageListener path. I had a look. So what happens is that listener is unregistered. Once the result of its pending invocation is returned, no new invocation is submitted. So if you would create/destroy listeners, and they have a pending invocation to get data from the ringbuffer, you could end up with an accumulation of pending calls. |
The runnersMap is not internal to the ReliableMessageRunner, the runnersMap is internal to the ReliableTopicProxy. As soon as the ReliableMessageRunner is cancelled (when the topic listener is removed), it is removed from the runnersMap. Although one could be able to shortly see a cancelled ReliableMessageRunner in the runnersMap since the cancelledFlag is set to true before it is removed from the RunnersMap. The cancelledFlag is volatile and therefore excluded from any visibility problems. |
|
@pveentjer Is there maybe a way to cancel these invocations when the message listener is cancelled? Or - as #17061 suggests to have a timeout mechanism there that eventually will expire the invocation on its own? |
|
Perhaps the following could happen: You create a message listener on some topic. It causes an invocation on the remote system waiting for data. You remove the listener. But the invocation of the listener isn't canceled; since it is just waiting for data that doesn't arrive. And as a consequence, the canceled flag isn't seen. If data would be found, the invocation would complete and the canceled flag would prevent a new invocation to be sent. And over time you get an accumulation of useless invocation waiting for data that never arrives. |
|
@pveentjer I'd like to repeat my question. Do you see any way forward for those invocations? E.g. cancelling them when the message listener is removed and/or the runner is cancelled? Or passing timeouts to them, so they eventually get cleaned up? |
|
AFAIK there currently is no way for them to be canceled. Cancellation of the future (which could be obtained internally) won't solve the problem. we could remove the invocation from the invocation service, but that only solves the 'local' side of the problem and not the remote side. The end result would be the same. I think the most sensible approach would be to add a new method to the readManyAsync method of the Ringbuffer with an explicit timeout (which defaults to Long.MAX_VALUE). This way the call is going to return to the MessageRunner when there is data or when there is a timeout. And in the latter case, the canceled status could be checked before resubmitting. This won't cause any wire-level changes. Ideally, there would be cancellation logic; so that operation can explicitly be canceled on the remote side. But this is going to lead to wire-level changes. How often do you register and unregister listeners? Because if you have so many, then this must happen very frequently. |
|
This happens indeed fairly frequently. For every topic there will be at least one register and unregister. And we create many topics during the lifecycle of the app (it's essentially a chat with many channels and users that come and go that drives the amount of topics). Which brings me to the question if there's an easy way to get the amount of topics in a Hazelcast cluster? In fact there is a pooling mechanism to don't create too many topics where I would likely put our own metrics if there are none from Hazelcast itself. In fact there was a bug in there that we didn't cleanup the topic (names) anymore and return them to the pool as we only used
|
|
It is a sensible default for blocking calls without a timeout since there is no timeout and Long.MAX_VALUE is a good approximation of infinite. In case of ITopic that is another question. So I guess a few seconds timout by default should be good enough for most cases without causing excessive load on the system unless there are a huge number of topic listeners. And I agree that having a configurable timeout makes sense. |
|
I checked a couple of things because I was still surprised what the difference between Hazelcast 3 and 4 was. In fact, the stuck invocations can happen both on 3 & 4. After more digging I found another behaviour change that broke the On Hazelcast 4.2.4 this code will output: On Hazelcast 3.12.11 however this is shown: As you can see on Hazelcast 4.2.4 the time-to-live is basically reset to a value that never really expires. (Not speaking of the last update time being weird.) My workaround for Hazelcast 4.2.4 would be to add a The effect of this bug is that the above mentioned I didn't find anything in the migration guides nor in the release notes that would describe that behaviour change - if it was intended after all. With the The workaround of adding a Cheers, |
|
The fix to configure a I've also applied an additional |
|
I should note that during this investigations two PRs were created: |
|
@dreis2211 Thanks for your continous work on this. Are you still hitting this issue? |
|
@Holmistr No, after I applied the mentioned workarounds we don't hit this anymore. But especially the special The changes to the map expiry are somewhat surprising and you have to tell me if they are a bug or not. |
Hi,
since the upgrade from Hazelcast 3 to Hazelcast 4 one of our applications is showing a steady increase in CPU over time.
The drops in CPU are caused by restarts (mostly because of deployments) but also to not let the CPU grow indefinitely. The seemingly lower values on the end are just caused by us restarting the thing after several unsuccessful tries to get to the bottom of the problem. The CPU is already rising again.
After some investigation I found out that several collections are not drained and seem to constantly grow and thus more and more time is spent on them.
1. OperationParkerImpl


2. InvocationMonitor / InvocationRegistry

Furthermore, the latency on all operations seems to be fairly high, but for ReadManyOperations it's 16 years(!) - for a server that was only running for a couple of hours at the time of checking the heap dump. And the maxMicros seems to be at
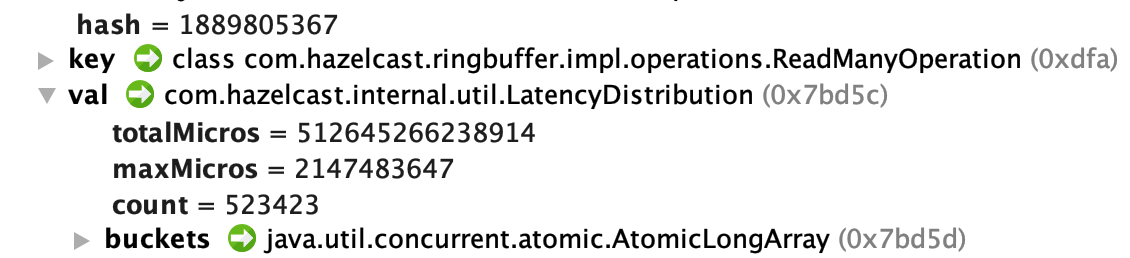
Integer.MAX- I'm not sure what happens here (int-max is half an hour i think).I can explain that ReadManyOperations has likely the biggest numbers here, because we use quite some

ReliableTopics(multiple thousands) and thus eventually(Reliable)MessageRunneris doingringbuffer.readManyAsyncat some point. (Also likely the reason why RingBufferService is the biggest entry in our dump)Our setup consists of just two nodes with 8 cores and 10GB RAM each. As you can see in the first graph on the left that was plenty enough for our application.
Unfortunately, I'm not able to share the application nor reproduction steps, but I hope I could show some neuralgic points in the dumps and flamegraphs. Please help out, because I'm out of ideas at the moment.
Cheers,
Christoph
The text was updated successfully, but these errors were encountered: