Spams Debug Console of extension host while developing other extension #59
Comments
|
Yes, thanks for the report! It should be this line. I'm very curious how you use this debug visualizer for factorio! |
|
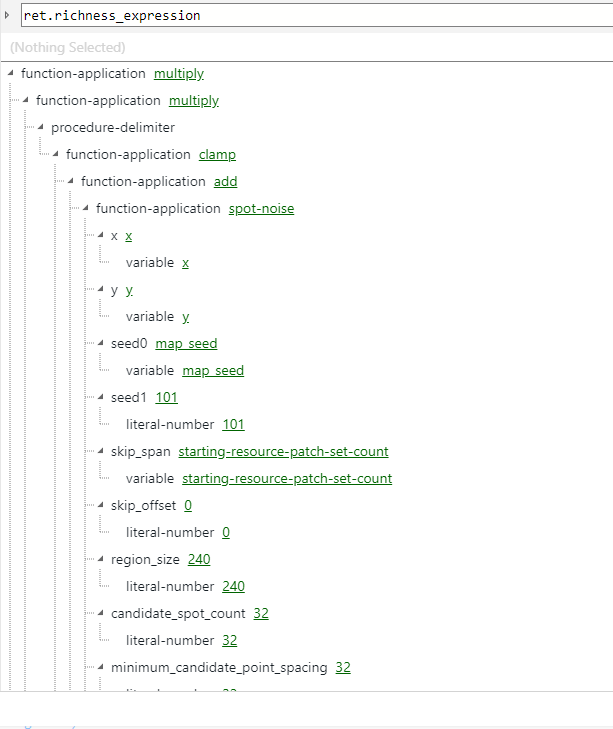
The mapgen noise system has some huge tables representing the noise functions to run (which the game later compiles to a more runnable form which it uses to actually generate the world), and some other mod makers asked for better display of them, so I'm formatting it as a nice readable tree! |
|
That's nice ;) Can you post a screenshot? Besides this issue, did you experience other issues with this extension? |
|
There's a screenshot in #58 ;) But here's one with the blinding lights on: The biggest problem I had was the very minimal diagnostic when my trees weren't the right shape, since I don't have enough type data (yet) in Lua to attempt to validate them there. In particular, I had omitted children instead of using the empty array and got a pretty opaque error about something failing on |
|
Console Spamming is fixed in v2.0.0. Sorry for the delay.
the new playground helps you to get the data right - the editor has autocompletion & json schema validation.
I don't fully understand you there. Which source is going to be duplicated? You mean like it is, but opening the source in VS Code rather the inline view? What is your usecase? |
The trees i'm rendering are Factorio's mapgen Noise Expressions, which have "source" links back to the .lua file in which they were defined, which is probably already open in a normal editor, so showing it again under the tree isn't particularly helpful. What would probably be more useful is to move the selection in the editor in the other panel to that location in the file. I did a similar thing in my profiler to jump to source from a my profiler charts: vscode.window.showTextDocument(fileuri,{
selection: new vscode.Range(line,0,line,0),
viewColumn: vscode.ViewColumn.One
}); |
I'm working on my own extension (a debug adapter) and any time i open a Visualizer pane, i get this spamed in the debug console:

This makes is pretty hard to find my entries in the debug console. Any chance you could clean this up?
The text was updated successfully, but these errors were encountered: