Skip to content
New issue

Have a question about this project? Sign up for a free GitHub account to open an issue and contact its maintainers and the community.

By clicking “Sign up for GitHub”, you agree to our terms of service and privacy statement. We’ll occasionally send you account related emails.

Already on GitHub? Sign in to your account

Boost Module-bad performance while using series type #12602

Closed
BatelAyala opened this issue Dec 10, 2019 · 10 comments
Closed

Boost Module-bad performance while using series type #12602

BatelAyala opened this issue Dec 10, 2019 · 10 comments

Comments

@BatelAyala
Copy link

I made a highchart with graph of type "spline" with a lot of data (500000 points).
In order to fix the performance issue I used boost module but it seem that it have no affect.
here it a demo:
https://jsfiddle.net/4dmxf2zv/

In fact the scenario I need is more complicate-I need a highchart with 5-10 graphs with different types and different scales
I have a lot of data on every graph-it made my chrome crash, so I changed the data to 1000 points -but still it make my chrome slower and on mobile the performance of it is terrible and crash often.

@pawelfus
Copy link
Contributor

pawelfus commented Dec 11, 2019

Hi @BatelAyala

Spline series is not supported in boost mode:
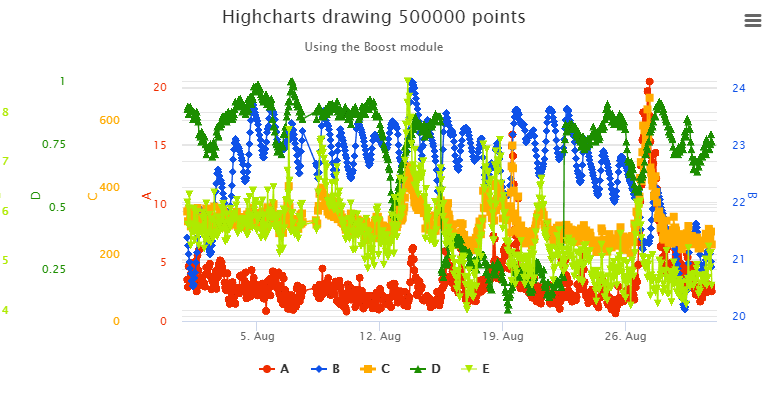
The boost module is a “renderer-in-a-module”. Including modules/boost.js will, by default, activate boost for all series that support it (line series, column, bar, treemap, heatmap, scatter, bubble, area).

Please change series type (e.g. to line) and compare results.

Regarding 5-10 graphs, where each has ~500k points - that's huge amount of points. I believe there's no point of rendering all charts at the same time. There's a perception limit: how many points your user can observe at the same time? 5M points is quite a lot (reminder: 4K displays render 2M pixels). Not to mention RAM requirements to store that data in browser.

PS: If you want spline support in boost mode, please create an idea on our UserVoice.

@BatelAyala
Copy link
Author

Thank you for your comment.
I change the series type of "spline" to "line" and it fixed the first scenario.
About the real scenario that I want it is not working-I have 5 graph and each graph have 700-800 points (the sum of the points is about 4500-amount that seem ok), in addition I have 5 scales-one for each graph.
It working fine on chrome in my computer but while I try to make it work on mobile with lastest chrome update -it make my chrome crash, Moreover in mobile I tried to load the same chart without the scales on mobile it working slow and stuck my phone for a few seconds often.
I using the highchart chart in page with scroll so the performance issues make my all page stuck while scrolling -and the user experience is really bad.
here it a sample:
https://jsfiddle.net/mguhabq9/

@pawelfus
Copy link
Contributor

Your demo (https://jsfiddle.net/mguhabq9/) does not use the boost module. Thresholds, to turn boost mode on, are:

@BatelAyala
Copy link
Author

Thanks for your comment.
I fixed the things you were telling me to-it seem that it working good with the performance but I have another problem, the graph design seem strange...
I will be glad if you can take a look on it and tell me what wrong.
https://jsfiddle.net/78yur0sn/
Thank you very much.

@sebastianbochan
Copy link
Contributor

@BatelAyala could you elaborate what is incorrect and should be changed? Do you mean visible markers or something different?

@pawelfus
Copy link
Contributor

If you refer to markers, @BatelAyala, then you can simply disable them: https://api.highcharts.com/highcharts/plotOptions.line.marker.enabled

Short explanation: When rendering chart in SVG (without boost module), thousands of markers flood DOM making the whole page to be slower. When rendering chart on a canvas (in boost mode) it's not a problem so all markers are rendered.

@BatelAyala
Copy link
Author

I attached picture of the excepted result and the actual result.
it was changed from the excepted to actual when I added override of number of points threshold default property-in order to use boost module
Excepted result:
image
Actual result:
image

@pawelfus
Copy link
Contributor

See my comment above @BatelAyala

@BatelAyala
Copy link
Author

Thanks for your comment,
I tried it and it really fixed the look of the highchart chart.
I saw that there is some disadvantage for this, comparing to highchart without boost:

  • I cannot see the point on hover-I can only see the tooltip.
  • When hovering on a graph I do not see the regular affect-it seem like the others graphs on the chart.

If there is a way to fix it -I will be glad.
Moreover I know that when using boost -I inactivated the animation automatically,
Are there is more disadvantage for boost module?

In addition I would like to ask another question that related to this example-I using 5 graphs every graph has 700-800 points (total:about 4000 points), there is a large difference between 4000 points to 1 million points,+5 scales. so why it is working so slowly? Do I really have to use boost module?
you can see the slowly loading on this sample-on mobile (it make chrome crash on mobile-while having lastest chrome update):
https://jsfiddle.net/mguhabq9/
(there is a boost configuration on that sample but the number of points threshold is not set-so the boost is not active)

@pawelfus
Copy link
Contributor

You can read more about boost in our documentation: https://www.highcharts.com/docs/advanced-chart-features/boost-module

Regarding your issues (hover etc.) please contact our support team. We use github tickets as bug reports, not support tickets. Thanks!

Sign up for free to join this conversation on GitHub. Already have an account? Sign in to comment
Projects
None yet
Development

No branches or pull requests

3 participants