Issue with plotOptions #114
Comments
|
+1 |
|
Hi, have you installed phantom manually, or have you let the export server install it as a dependency? If you've done the former, there may be a versioning conflict, as it will install it automatically when running Does it work if you pass an empty object to As a side note, we're running export.highcharts.com on AWS, without any issues like this (Amazon Linux v3.1.0). |
|
Oh, and are you using the export server as a node module, or running it out-of-the-box with a global npm install? And lastly - are you using the HTTP server, or are you using the CLI or |
|
Yes. I am using the export server as a node module. I did a global npm install and using the http server for generating images. It works when I pass an empty object to plotOptions.column but fails when I enable the stacking (without data labels). |
|
Just to clarify - are you installing the export server via. npm and starting it via. e.g. |
|
Sorry for the confusion. Using it as the later one. eg: const exportServer = require('highcharts-export-server') |
|
I'm sorry to say that we have still not been able to reproduce this on any configuration. If you have any additional information, that would be most helpful. |
|
After further testing it looks like Have you tried with the stack labels enabled @cvasseng ? Here's a demo with chart's config that's showing the error while not using the plotOptions: http://jsfiddle.net/BlackLabel/pu095v9n/9/ As a workaround - use another series instead of axis stack labels: http://jsfiddle.net/BlackLabel/pu095v9n/10/ |
|
@KacperMadej: yes - I'm unable to reproduce it at all both locally and on the live export server. Pasting the code from http://jsfiddle.net/BlackLabel/pu095v9n/9/ into export.highcharts.com gives me this:
..which looks fine to me unless I'm missing something? |
|
@cvasseng As you said, it works for me in my local system as well as in export.highcharts.com but not in the instance (node v8.0.0, phantomjs 2.1.1) that I am using. Does a phantomJs crash report or any specific log file could be of any use? |
|
Any information or logs would be useful, as we're not able to reproduce it on any system or configuration. It's such a specific thing that it makes me think it's either Phantom or Highcharts itself, or a combination of the Phantom version and Highcharts. But unless you've installed phantom yourself, that shouldn't be the case. |
|
i am also facing same issue this app works perfectly fine when we create demo but as soon as we call the function for graph generation in respond to http call then it stops working |
|
Thank you for contacting us and reporting this issue. Please, provide us with more information about the error that you encounter, the way how exporting is triggered (through CLI, as a HTTP request, as a node module, etc.) and how the export server is installed (globally or as a dependency) and configured. Thanks. |
|
hello @PaulDalek i think the function which exports the graph i.e chartExporter.export is asynchronous in nature so my document is returning before the completion of execution of that function |
|
It is hard to say much based on the information that you provided and without knowing what is happening in the app.js generate-graph.js |
|
Closing issue due to inactivity. |
Expected behaviour
Should create a stacked column chart
Actual behaviour
PhantomJs crashes with the below error message
error when performing chart generation: please check your input data
uncaughtException: TypeError: Cannot read property 'data' of undefined
at doDone (/home/ec2-user/downloads/node_modules/highcharts-export-server/lib/phantompool.js:119:20)
at ChildProcess. (/home/ec2-user/downloads/node_modules/highcharts-export-server/lib/phantompool.js:152:9)
at emitTwo (events.js:125:13)
at ChildProcess.emit (events.js:213:7)
at maybeClose (internal/child_process.js:887:16)
at Socket.stream.socket.on (internal/child_process.js:340:11)
at emitOne (events.js:115:13)
at Socket.emit (events.js:210:7)
at Pipe._handle.close [as _onclose] (net.js:546:12)
Reproduction steps
I am using node v8.0.0 and phantomjs 2.1.1 in linux ami
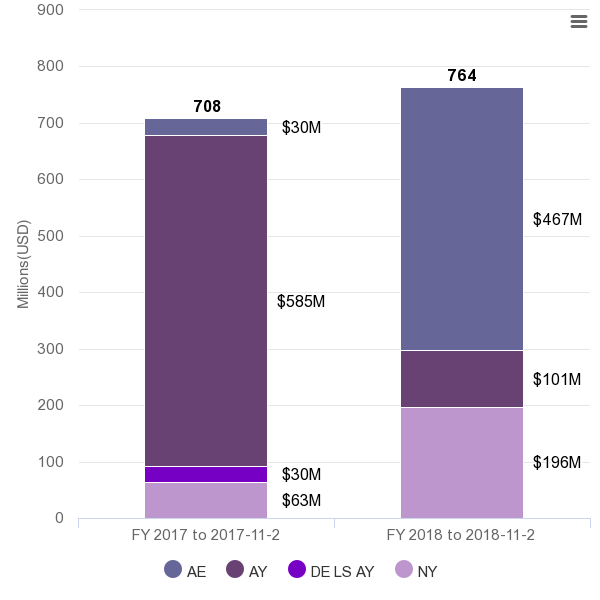
The below export settings works well in http://export.highcharts.com/ and in my local setup without any changes but behaves differently in AWS linux environment. I traced the problem to plotOptions. When the plotOptions is either {} or disabled, it works.
{ type: 'png',
options:
{ chart: { type: 'column', height: 600, width: 600 },
title: { text: '' },
credits: { enabled: false },
colors: [ '#666699', '#674273', '#7600c4' ],
xAxis:
{ categories: [ 'FY 2017 to 2017-11-2', 'FY 2018 to 2018-11-2' ],
labels: { style: { fontSize: '15px' } } },
yAxis:
{ min: 0,
title: { text: 'Millions(USD)', style: { fontSize: '15px' } },
stackLabels: { enabled: true, style: { fontSize: '16px' } },
labels: { style: { fontSize: '15px' } } },
legend:
{ align: 'center',
verticalAlign: 'bottom',
symbolHeight: 18,
symbolWidth: 18,
symbolRadius: 18,
itemStyle: { fontSize: '15px', fontWeight: '' } },
tooltip:
{ headerFormat: '${point.x}B
',
pointFormat: '{series.name}: ${point.y}B
Total: {point.stackTotal}' },
plotOptions:
{ column:
{ stacking: 'normal',
dataLabels:
{ enabled: true,
format: '${y}M',
color: 'black',
style: { fontSize: 16, fontWeight: '' },
x: 95 } } },
series:
[ { name: 'AE', data: [ 30, 467 ] },
{ name: 'AY', data: [ 585, 101 ]},
{ name: 'DE LS AY', data: [ 30, null ] },
{ name: 'NY', data: [ 63, 196 ] } ] } }
The text was updated successfully, but these errors were encountered: