Skip to content
New issue

Have a question about this project? Sign up for a free GitHub account to open an issue and contact its maintainers and the community.

By clicking “Sign up for GitHub”, you agree to our terms of service and privacy statement. We’ll occasionally send you account related emails.

Already on GitHub? Sign in to your account

xAxis DateTime in Scatter Plot should convert Tooltip #3552

Closed
klexas opened this issue Oct 30, 2014 · 18 comments
Closed

xAxis DateTime in Scatter Plot should convert Tooltip #3552

klexas opened this issue Oct 30, 2014 · 18 comments
Labels
Status: Stale This issue hasn't had any activity for a while, and will be auto-closed if no further updates occur. Type: Undecided

Comments

@klexas
Copy link

klexas commented Oct 30, 2014

When you have defined the xAxis as a 'dateTime' type the tooltip should be aware of this as the 'point.x' value and convert it to the DateTime format.

http://jsfiddle.net/egf4vbfL/6/

As you can see the X-Axis is correct in that it uses the Time rage however when you view the default tooltip you get the epoch time.

I know you can format this using 'point.key' etc but it is not expected behavior.

@klexas klexas changed the title xAxis DateTime in Scatter Chat should convert Tooltip xAxis DateTime in Scatter Plot should convert Tooltip Oct 30, 2014
@TorsteinHonsi
Copy link
Collaborator

I know you can format this using 'point.key' etc...

For the records, here's how to add date formatting to the pointFormat option: http://jsfiddle.net/highcharts/egf4vbfL/7/.

I do agree that I would expect the tooltip to print dates in this case, however it would also require an additional setting for what tooltip format to use, so maybe we would be just as far...

@klexas
Copy link
Author

klexas commented Oct 31, 2014

I don't see any reason to deviate from the standard linechart label when representing dateTime, I can take a look over the weekend and you can see what you think i guess, I have my concerns more-so about when you have multiple X-Axis's for example.

@TorsteinHonsi
Copy link
Collaborator

I don't see any reason to deviate from the standard linechart label

Yes, that might work...

@chevalierc
Copy link

I second klexas's comment about the tooltip.

@WhiteBearSpirit
Copy link

And still no change. Do developers have any particular reason to leave formatting like that?

@jsBiztech
Copy link

It has been a while is there any update or workaround?

@pawelfus
Copy link
Contributor

pawelfus commented Oct 5, 2018

Solution is simple, see: #3552 (comment) - set pointFormat with required formatting for x-value. Alternatively, you can use tooltip.pointFormatter or tooltip.formatter.

@jsBiztech
Copy link

i think i was not clear with what i want to actually achieve when i said change the tooltip format.
here is the link
steps to reproduce :
->select chart type as scatter from scatterbubble chart
and also attaching an image where the highlighted area is what i want to modify actually
highcharts cloud

@pawelfus
Copy link
Contributor

pawelfus commented Oct 8, 2018

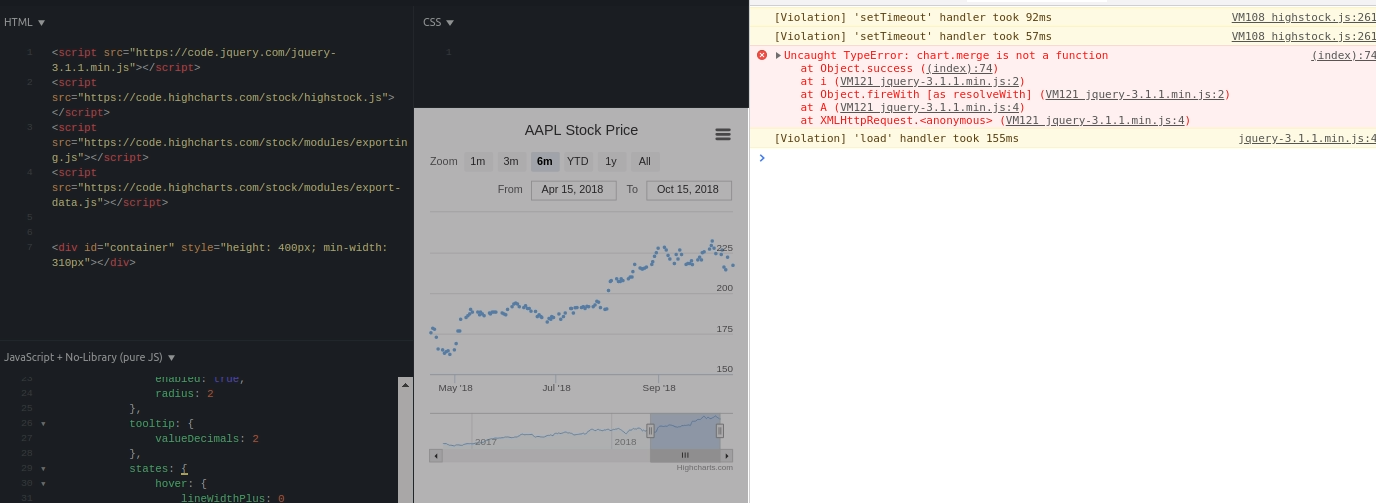
In Advanced -> Custom code tab you can set format:

Highcharts.merge(true, options, {
    tooltip: {
    	headerFormat: '{point.key}'
    }
});

@jsBiztech
Copy link

Thanks @pawelfus it worked.

@jsBiztech
Copy link

Hi @pawelfus
Tried to implement the code and it returned an error 'chart object.merge' is not a function
any suggestions what's wrong in it?

@sebastianbochan
Copy link
Contributor

Hi @bharatnagdev
Did you place the code in the section:
zrzut ekranu 2018-10-16 o 10 00 03

When I run the console I do not see the error. Could you confirm that it still appears? If yes, which browser do you use?

@jsBiztech
Copy link

jsBiztech commented Oct 16, 2018

Hi @sebastianbochan

Thanks @pawelfus it worked.

i already confirmed it.
but the issue occured when i tried to implement it in the actual code, where it is needed.
Another error was Property 'merge' does not exist on type 'Static'.

@pawelfus
Copy link
Contributor

pawelfus commented Oct 16, 2018

@bharatnagdev

So you are not looking for a Highcharts Cloud solution? In that case please provide full description of the issue. At this moment we can only guess what is wrong, for example maybe you use outdated typescript/flow definitions. Additionally, please provide a live demo. Note that solutions for Highcharts Cloud are different from simply using Highcharts library...

@jsBiztech
Copy link

Hi @pawelfus
i shared the Highcharts cloud link for the explanation of issue i am facing.
here is the link
desktop screenshot

@pawelfus
Copy link
Contributor

In your case @bharatnagdev simply set headerFormat in options for series or for tooltip, like any other option. Demo: https://jsfiddle.net/BlackLabel/4uwf8bcq/4/

@jsBiztech
Copy link

Thanks @pawelfus finally it worked.

@stale
Copy link

stale bot commented Jul 11, 2020

This issue has been automatically marked as stale because it has not had recent activity. It will be closed if no further activity occurs. Thank you for your contributions!
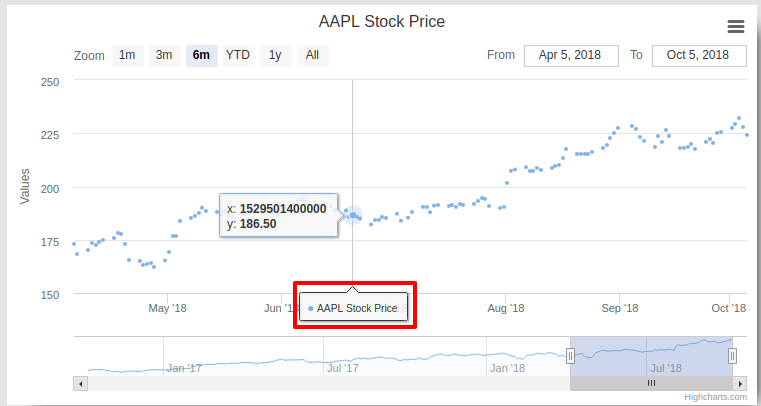
@stale stale bot added the Status: Stale This issue hasn't had any activity for a while, and will be auto-closed if no further updates occur. label Jul 11, 2020
@highsoft-bot highsoft-bot added this to To do in Development-Flow via automation Jul 11, 2020
@stale stale bot closed this as completed Jul 18, 2020
Development-Flow automation moved this from To do to Done Jul 18, 2020
@Izothep Izothep removed this from Done in Development-Flow Jul 15, 2021
Sign up for free to join this conversation on GitHub. Already have an account? Sign in to comment
Labels
Status: Stale This issue hasn't had any activity for a while, and will be auto-closed if no further updates occur. Type: Undecided
Projects
None yet
Development

No branches or pull requests

9 participants