Skip to content
New issue

Have a question about this project? Sign up for a free GitHub account to open an issue and contact its maintainers and the community.

By clicking “Sign up for GitHub”, you agree to our terms of service and privacy statement. We’ll occasionally send you account related emails.

Already on GitHub? Sign in to your account

History bar-graphs not showing correctly #9495

Closed
3 tasks done
Plevuus opened this issue Jul 3, 2021 · 4 comments
Closed
3 tasks done

History bar-graphs not showing correctly #9495

Plevuus opened this issue Jul 3, 2021 · 4 comments
Labels
Bug Current Bug in UI - Extra Attention

Comments

@Plevuus
Copy link

Plevuus commented Jul 3, 2021

Checklist

  • I have updated to the latest available Home Assistant version.
  • I have cleared the cache of my browser.
  • I have tried a different browser to see if it is related to my browser.

Describe the issue you are experiencing

The history bar graphs are showing incorrect. In stead of multiple colors for the states, it only shows a white/transparent/non-existing bar or a partially black bar that disappears when the mouse is hovered over it.
image
image
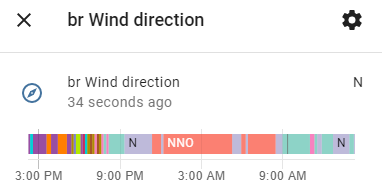
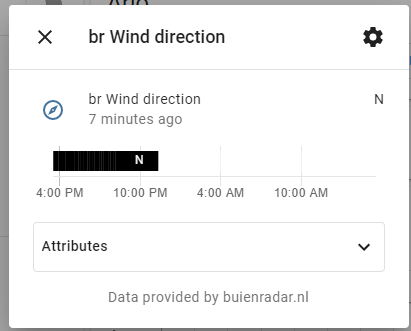
Refreshing the browser (ctrl-F5) temporarily solves the issue on the 'main' page, but the issue persists in entity pop-up windows.
I tried several OS/browers combinations, but all have the issue (Windows/Chrome (on 2 different computers), Windows/Edge, Android/Companion-app, IOS/Companion-app).
I tried different versions of Home-assistant core. Everything works well u to version 2021.5.5, but doesn't work anymore from version 2021.6.0 upwards.
According to this thread, there is at least one other user experiencing the issue.
I cannot find any useful lines in the log. I've tried several logger setting that seemed relevant to me.
Other things I've tried myself (without success):

  • clear browser cache
  • Removing frontend.user_data_xxxxxxxxxxxxxx files from \config.storage
  • Removing the complete database and let Home-assistant build a new (empty) one
    Create a snapshot, do a complete new home assistant installation on a new SD card and install the snapshot
  • Use different themes

Describe the behavior you expected

Correctly displayed history bar-graphs.
image

Steps to reproduce the issue

  1. Open Home-assistant in the browser
  2. Click on the badge of sensor with unit of measure

What version of Home Assistant Core has the issue?

Anything from 2021.6.0 upwards

What was the last working version of Home Assistant Core?

2021.5.5

In which browser are you experiencing the issue with?

Chrome 91.0.4472.124

Which operating system are you using to run this browser?

Windows 10

State of relevant entities

No response

Problem-relevant frontend configuration

title: Home
views:
  - badges:
      - entity: sensor.br_wind_direction
      - entity: sensor.br_precipitation_forecast_total
      - entity: sensor.br_detailed_condition
      - entity: sensor.br_stationname
      - entity: binary_sensor.sun_side
      - entity: binary_sensor.sun_front
      - entity: binary_sensor.indoor_hotter

Javascript errors shown in your browser console/inspector

I do know how to open the console window, but I do not know how to spot errors in there.

Additional information

No response

@Plevuus Plevuus added the Bug Current Bug in UI - Extra Attention label Jul 3, 2021
@Plevuus
Copy link
Author

Plevuus commented Jul 3, 2021

The issue is now solved for me by removing a (faulty) custom front-end integration (neerslag-card). I guess it's best not to close issue since other users are experiencing similar issues.

@tylerpieper
Copy link

I'm having a similar issue now that I just updated to 2021.7. I have a template sensor that is gathering the current state of each thermostat (idle, heating, cooling). Up until now, each state would show a different color on the history graph card, but now each state shows the same color, making it very hard to read.

The card in question:
image

The YAML for the card:

type: history-graph
entities:
  - entity: sensor.downstairs_temperature
    name: Downstairs
  - entity: sensor.upstairs_temperature
    name: Upstairs
  - entity: sensor.openweathermap_temperature
    name: Outside
  - entity: sensor.upstairs_hvac_status
    name: ⬆️
  - entity: sensor.downstairs_hvac_status
    name: ⬇️
  - entity: sensor.aeotec_limited_zwa005_trisensor_temperature_2
    name: Air Intake
hours_to_show: 24
refresh_interval: 0

The two sensors in question (within Sensors.yaml) (I know I should be using state_attr):

- platform: template
  sensors: 
    downstairs_hvac_status:
      friendly_name: "Downstairs HVAC Status"
      value_template: '{{ states.climate.downstairs.attributes.hvac_action }}'
- platform: template
  sensors: 
    upstairs_hvac_status:
      friendly_name: "Upstairs HVAC Status"
      value_template: '{{ states.climate.Upstairs.attributes.hvac_action }}'

And the state attributes of one of the thermostats (climate.downstairs) (they are both identical):

hvac_modes:
  - 'off'
  - heat
  - cool
  - heat_cool
min_temp: 50
max_temp: 90
current_temperature: 77
temperature: 77
hvac_action: idle
friendly_name: Downstairs Thermostat
supported_features: 1

@bramkragten
Copy link
Member

@tylerpieper please create a new issue for your issue, and please also include the historic data for that entity that is not displayed correctly (check the network tab, in your browser dev tools)

Make sure to load as little data as possible to show the issue. (I can't tell from that screenshot what states are being shown in the graph)

@tylerpieper
Copy link

@bramkragten Restarting HA a second time fixed it. I will open an issue if I see it again, though.

Sign up for free to subscribe to this conversation on GitHub. Already have an account? Sign in.
Labels
Bug Current Bug in UI - Extra Attention
Projects
None yet
Development

No branches or pull requests

3 participants