- MOPED is the acronym for “Multimodal Occupational Posture Dataset”. '25' stems from 25 different tasks were included in our experiment.
- We collected posture data from 12 subjects, and 11 of them were published. Each subject was asked to perform 25 different tasks, most of which are commonly seen in a workplace, including bending, squating, lifting, etc.. We collected both the kinematics data as well as the synchronized videos. The kinematics data includes 37 markers (most of which follow the ISB recommendation).
- Motivation: I found most of public human pose dataset have vague definition of the key points, like shoulder, hip or wrist, which have limited value for the application of pose detector from a biomechanics perspective. Hopefully, this 'novel' dataset could contribute to the futher application of computer vision in ergo community.
- For a more detailed description of the experiment and the dataset, please refer to our paper (Li, Li, Ziyang Xie, and Xu Xu. “MOPED25: A multimodal dataset of full-body pose and motion in occupational tasks.” Journal of Biomechanics).
- I provided very basic loading and visualizing MATLAB (2019a) code. I haven't tested it in other machines (later), but it should work. No extra packages are needed to run the code. I will keep updating, and add python version later.
- GITHUB use:
- For windows user, click 'Code' in green button and select 'Download Zip'. Where you download it doesn't matter.
- Open the zip file and unzip it.
- The files in the zip file are exactly the same with the files shown in the Github page. Follow the following instructions for the use of code.
- Usage:
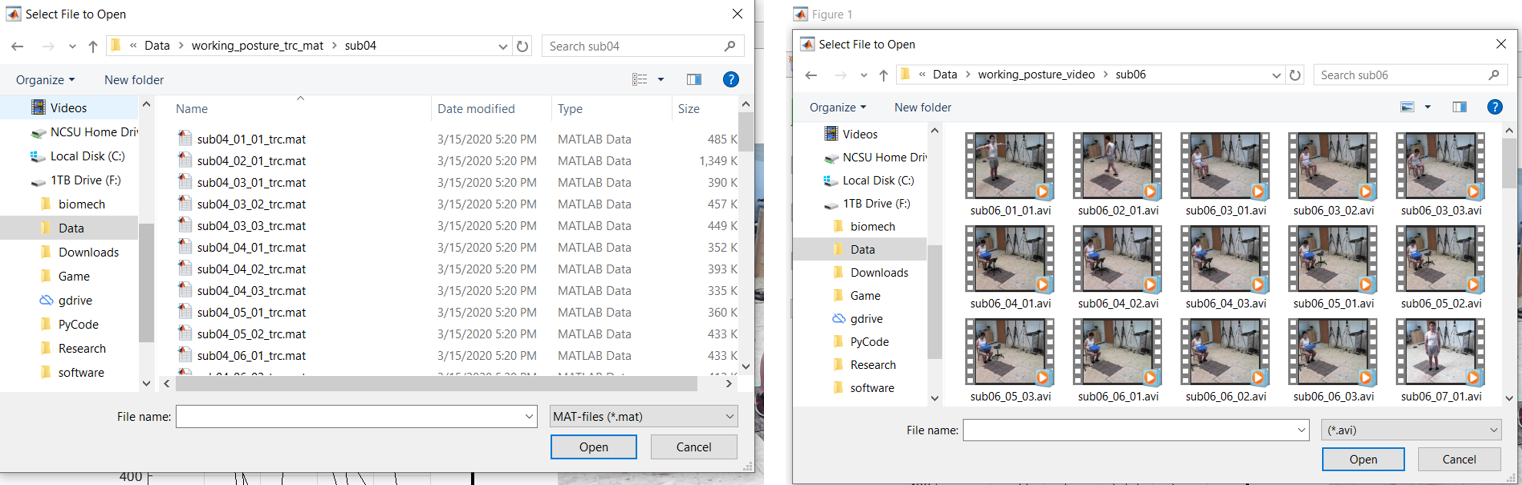
- Download the data. (Marker data/Videos were stored as .mat/.avi)
- Extract the data under folder '\data'. Note that the code used one sample from Sub07 for demo purpose.
- The following graph shows the data structure of a single trial of marker data (.mat file). You can also run though the file 'basic_functions.m' block by block for the details. For the data structure of txt file, please refer to the 'readme.txt' attached with the txt data.
 \
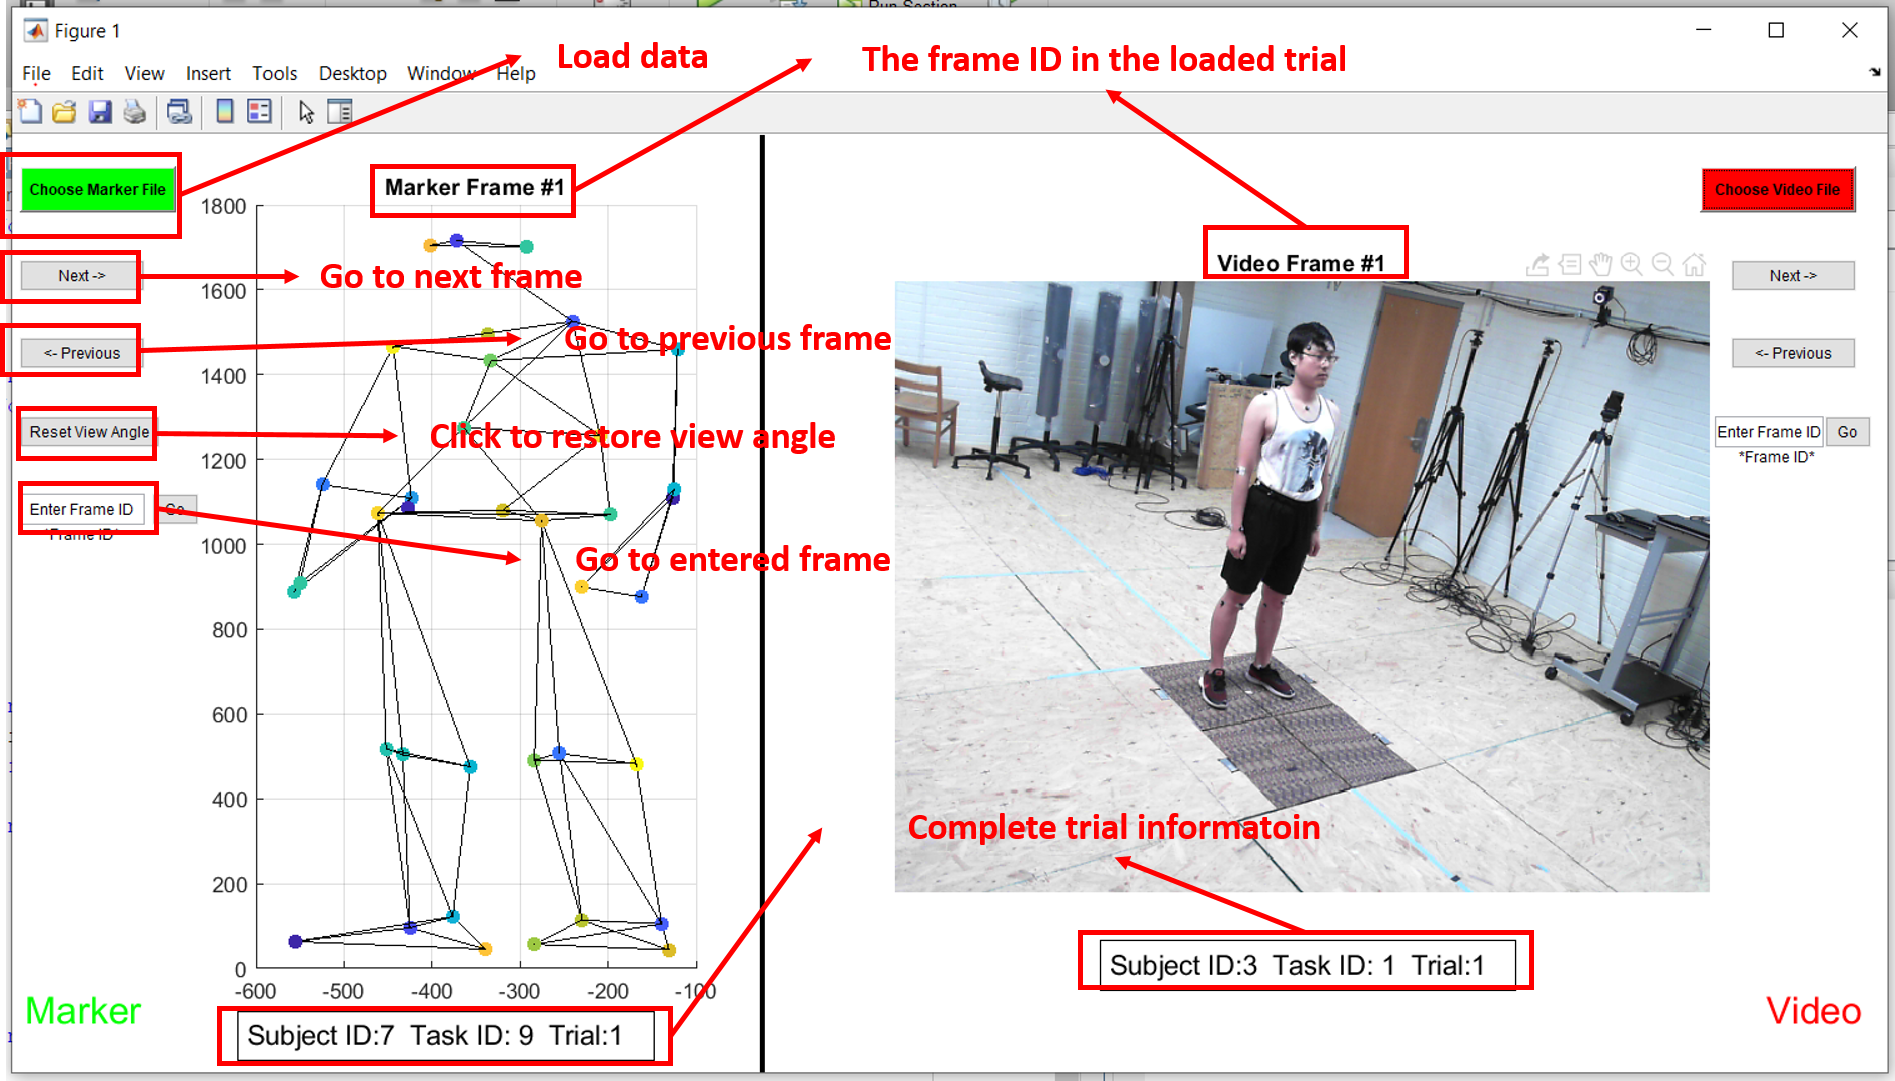
\ - Important: The video file is 30 Hz and the motion data is 60 Hz. Therefore, each video frame has two corresponding motion frames.
- The GUI provides easy visualization of both marker data and video data. All code is intergrated in one script, so it has zero path and package independencies. (I can run it with MATLAB 2018b and 2019a. )
- Usage:
- Download data. Open script 'interactive_plot.m' and run.
- Click to load the marker file or video file first. Note that you can either load marker data or video data.
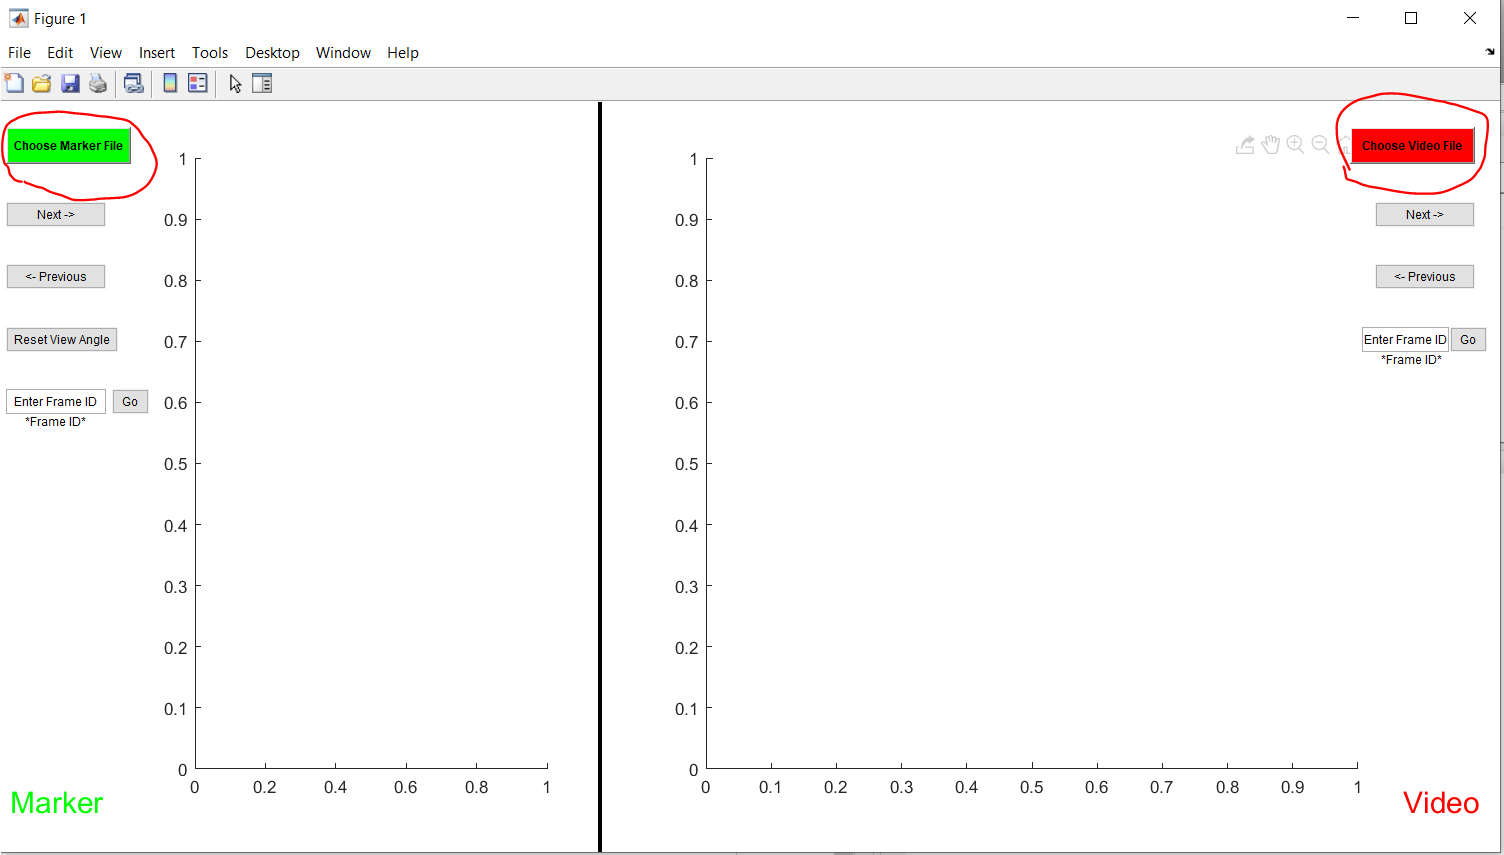
- Do not change the name of the files. The naming has to be strictly the same with the default.
- The following image shows some functions. Note that the marker data frequency is twice the video freqency (e.g., marker frame #4 matches to video frame #2).
- The link is provided on our MOPED25 webpage.