- Create a new folder
helloworld, create a file namedApp.javain this folder and filling the following codes:
public class App
{
    public static void main( String[] args )
    {
        System.out.println( "Hello World!" );
    }
}
- Set BP on println
- Press F5, verify for launch.json generated with right
mainClass - Press F5, verify for BP to be hit, verify variable args shows like
String[0] (id=%d) - Add watch
args.toString() + " test", verify the result like[Ljava.lang.String;@726f3b58 test - Input
args.toString() + " test"in debug console, verify the same result in debug console and it is expandable. - Verify stack with thread list and on paused thread and one stack:
App.main(String[]) (App.java:5) - Press F10, verify
Hello World!in debug console. - Press F5, verify program terminates.
-
Open test project
2.callstack -
Open
Bar.java, set BP on line 3 -
Press F5, verify for launch.json generated with right
projectNameandmainClass -
Press F5, verify for BP to be hit, verify variable args shows
i: 20andthis: Bar (id=^d) -
Verify the stackframe shows:
 Bar.testBar(int) (Bar.java:3)
 Foo.testFoo(int) (Foo.java:6)
 CallStack.main(String[]) (CallStack.java:4)
-
Click the testFoo line in the call stack view, verify vscode views verify variable args shows
j: 10andthis: Foo (id=^d)andthisis expandable with only memberbar: Bar (id=^d), the bar should not be expandable. -
Change
jto32and switch to stackframeBar.testBar(int) (Bar.java:3)and switch back toFoo.testFoo(int) (Foo.java:6), inputj + 1in debug console and verify33is diplayed. -
Add watch
this.bar.toString()and verify the result"Bar@^d" (id=^d) -
Add watch
"test" + new Bar().hashCode()and verify the result"test^d" (id=^d) -
Add watch
bar.testBar(j + 10)and verify there is a messageThis is test method in bar.printed in debug console. -
Press F5, verify program terminates.
-
Open test project
4.variable -
Set BP on the last statement of
VariableTest#test -
Press F5 to generate
launch.jsonand press F5 again to start debug and wait for BP to be hit -
Verify
ishould be111nullstrshould benullstrshould be full displayed with 1000aobjectshould beObject (id=^d)and not expandabletestshould beVariableTest (id=^d)and expandable withx (VariableTest): 100,i:19099andx (Foo): 0ais not expandablebis displayed asClass (A) (id=^d)and expandb->classLoader, there should be no errors on logsintarrayshould have 3 integers1, 2, 3strListshould have childrensize: 2and expandableelementData, expandelementData, a long stringstring test aaaaaaa...should be displayedmapshould havesize: 1and expandabletablewith aHashMap$Nodechild.tshould have one elementhellogenericArrayshould be displayedString[10][] (id=^d)with first non-empty elementmultishould be displayedString[5][][] (id=^d)and two levels expandable tree nodes.dshould not be expandableddshould be displayed asGenericsFoo (id=^d)and should have one childx: Foo (id=^d)with only one childx: 0listshould have only one element ofint[1] (id=^d)at index0thisvariable should be displayed
-
set value on
test->x (VariableTest), input value1, verifythis->x (VariableTest)has also been changed to1 -
Open user settings and set
"java.debug.settings.showHex": true,
 "java.debug.settings.maxStringLength": 10,
 "java.debug.settings.showQualifiedNames": true,
 "java.debug.settings.showStaticVariables": false,
-
verify
- numbers are displayed in hex, and static variable is hiden and class names have been changed to fully qualified,
strshould be changed to"string ..." (id=0x^d)
- numbers are displayed in hex, and static variable is hiden and class names have been changed to fully qualified,
-
add watch
this.hashCode()verify the result should be hex format. -
add watch
str + str.length()in debug console, verify the result"string ..." (id=0x^d) -
Press F5, verify program terminates.
- Open test project
6. recursivefunction - Open
RecursiveTest.java, and set BP on line 8: return 1 - Press F5 to generate
launch.jsonand press F5 again to start debug and wait for BP to be hit - Add watch
number + 100and verify the call stack list is a long list, and you can switch between them freely with changed arguments number and changed watch values - click on the Load More Stack Frames button, verify you can click on it continually. (The total stack frame count is 1000, and vscode will load 20 of them in one page, so you can click Load More Stack Frames button about 50 times), verify there is no PERFORMANCE issue (no delay more than 1 second during the test steps).
- Press F5, verify program terminates.
- Open test project
5.breakpoint - Change the code to:
class A {

    void m() {
        System.out.println("outer");
    }

    String n() {
        return "outer";
    }
}

public class BreakPointTest {
    public static void main(String[] args) {
        new BreakPointTest().go();
        int j = 0;
        new A() {
            @Override
            void m() {
                System.out.println("anonymous");
            }
        }.m();
        for (int i = 1; i <= 100; i++) {
            if (i <= 99) {
                j++;
            } else {
                System.out.println(j);
            }

        }
    }

    void go() {
        new A().m();
        class A {
            String n() {
                return "inner";
            }

            void m() {
                System.out.println("inner");
            }
        }
        new A().m();
    }

    static class A {
        String n() {
            return "middle";
        }

        void m() {
            System.out.println("middle");
        }
    }
}
- Set BP on each
printlnstatement - Add watch
new A().n() - Press F5 to start debug, verify the line
System.out.println("middle");is hit, verify the watch result ismiddle - Press F5 again, verify the line
System.out.println("inner");is hit, verify the watch result is displayed with red error message - press F5 again and verify the line
System.out.println("anonymous");is hit and the watch result ismiddle - press F5 again and verify the line
System.out.println(j);is hit and the watch result ismiddle - Press F5, verify the program stops, verify no error in logs.
- verify the following messages in debug console
middle
inner
anonymous
99
- Open test project
7.variableperformance - Open
TooManyVariables.java, and set BP onSystem.out.println("variable perf test.") - Press F5 to generate
launch.jsonand press F5 again to start debug - Open debug view and expand the ‘this’ variable in variable view.
- Verify the time for expanding are less than 5 seconds
- Press F5, verify program terminates.
- Open test project
8.nosource - Open
NoSourceTest.java, and set breakpoint on line 4:System.out.println(i+10); - Press F5 to generate
launch.jsonand press F5 again to start debug, verify the BP is hit - Verify the following stack frames:
 NoSourceTest.lambda$0(Integer) (NoSourceTest.java:4)
 ^d.accept(Object) (Unknown Source:-1)
 Foo.bar(int,int,Consumer) (Unknown Source:-1)
 NoSourceTest.main(String[]) (NoSourceTest.java:3)
- Select stack frame
Foo.bar(int,int,Consumer) (Unknown Source:-1), add watchthis.hashCode() - arg0and verify an integer as the result, verify watchnew Foo()results inFoo (id=^d) - Press F5, verify program terminates.
- Open cmd.exe and create an empty folder and run
mvn archetype:generate –DarchetypeArtifactId:maven-archetype-quickstart- On
Define value for property 'groupId'please inputcom.ms.samples - On
Define value for property 'artifactId'please inputsimple-app - For other options, press Enter
- On
- Open generated
simple-appfolder using vscode - Wait and verify
.projectand.classpathfiles andtargetfolder are generated. - Set BP on the
println - Press F5 to generate
launch.jsonand press F5 again to start debug, verify the BP is hit - Press F5, verify program terminates with output
Hello World!
- create a new folder and create file
build.gradlewith the following text:apply plugin: 'java' // Redefine where to look for app and test code // In this example, our code is structured as: // project // └── src // ├── main // │ ├── java // │ └── resources sourceSets { main.java.srcDirs = ['src/main/java'] } - copy the src/main folder from prevous test case
Maven Testto this folder. - Set BP on the
println - Press F5 to generate
launch.jsonand press F5 again to start debug, verify the BP is hit - Press F5, verify program terminates with output
Hello World!
- Clone code from
https://github.com/spring-projects/spring-petclinic.git - Open the cloned project and verify
.projectand.classpathfiles andtargetfolder are generated. - Set BP on
WelcomeController.javaon linereturn "welcome";andmainonPetClinicApplication.java - Press F5 to generate
launch.jsonand press F5 again to start debug, verify the BP onmainis hit. - Press F5 and verify the BP on
mainis hit again. - Wait for output
2017-11-23 20:23:25.230 INFO 9448 --- [ restartedMain] s.b.c.e.t.TomcatEmbeddedServletContainer : Tomcat started on port(s): 8080 (http) - Open IE and navigate to
http://localhost:8080, verify thewelcomemethod is hit - Press F5 and verify page like
spring-petclinic/target/classes/templates/welcome.htmlis displayed on IE withbadcss. - STOP debug and do the test again from step 4
- Clone code from
https://github.com/Microsoft/todo-app-java-on-azure.git - Open the cloned project and verify
.projectand.classpathfiles andtargetfolder are generated. - Open file
todo-app-java-on-azure\src\main\resources\application.propertiesand replaces it with a test configuration(see my email attachment) - Set BP on
TodoListController.javaonaddNewTodoItem(@RequestBody TodoItem item)andmainonTodoApplication.java - Press F5 to generate
launch.jsonand press F5 again to start debug, verify the BP onmainis hit. - Press F5 to continue, open IE and open
http://localhost:8080/#/TodoListand add a todo, press ButtonAddand verify the BP on addNewTodoItem is hit, wait a little time to load the stack frame. - Press F10 and then Press F5, verify the todo item is added.
- Open file in folder
21.single-file.(Open folderorOpen file) - Press F5, make sure it debugs well.
- update the src to introduce a compilation error. For example, change
String s = "1";toString s = 1;. Then hit F5, check whether vscode pop out an error message "Build fails, do you want to proceed", clickabort, make sure there is no more error message.
- Open project
23.console-appin vscode. - Press
F5choose java and make surelaunch.jsonis generated. - Press
F5again to start debug. - See VSCode
DEBUG CONSOLEview, verify the program is blocking at the linePlease input your name:. - Terminate debugger.
- Go to
launch.json, change the optionconsoletointegratedTerminal. - Press
F5again. - See VSCode
TERMINALview, and user can input his/her name there and the program continue to run. - Terminate debugger.
10.Go to
launch.json, change the optionconsoletoexternalTerminal. - Press
F5again, and the debugger will pop up an external terminal (e.g. cmd.exe). - User can input his/her name there and the program continue to run.
- In your PC, install latest java 9 JDK, configure
JAVA_HOME. - Open project
19.java9-appin vscode. - Press
F5choose java and verifylaunch.jsonis auto generated. - Press
F5to start debug. - Verify
breakpointandstepwork. - Click
Call Stack, it will open the associated source file in VSCode correctly.
- Clone code from https://github.com/spring-projects/spring-petclinic.git
- Clone code https://github.com/Microsoft/todo-app-java-on-azure.git
- Open both above projects in the same VSCode windows under workspace features
- Navigate to the Debug view
- Generate configuration for sprintclinic
- Generate configuration for TODO
- Check both launch.json to see the selected project's main are generated.
- Open project
19.java9-appin vscode. - Follow gif to verify step filters feature.


The new gif:

- Open project
24.hotCodeReplacein vscode. - Set breakpoints: NameProvider.java line 12; Person.java line 13
- Press
F5to start debug. - The program stopped at the Person.java line 13
- Change the value of the line "old" to "new"
- Save the document to trigger HCR. Check the breakpoint will stop at line 12
- Click F10 to step over, check the value of
reson the debug view of local variable which should benew
- Open project
simple-javain vscode, write the following code:
package com.ms.samples;

/**
 * Hello world!
 *
 */
public class App
{
    public static void main( String[] args )
    {
        int i = 0;
        for (; i <= 1000; i++) {
            if (i == 1000)  {
                System.out.println( "Hello World!" );
            }
        }
        System.out.println( "Hello World!" );
    }
}
- set conditional breakpoint on line 13 with condition
i ==1000, F5 and wait the breakpoint to be hit

- verify i equals 1000 in variable window.
- F5 and wait for program to exit.
- Open project
25.restartFramein vscode. - Set breakpoint: Person.java line 28
- Press
F5to start debug. - The program stopped at the Person.java line 28
- Open the debug view, find the call stack of current breakpoint
- Right click the
HelloWorld$1.run(), chooseRestart Frame. Result: It should fail with error message in the right corner. - Right click the
Persona.getInternalName(), chooseRestart Frame. Result: The program stop at the entry of getInternalName - Right click the
Persona.getName(), chooseRestart Frame. Result: The program stop at the entry of getName. The above call stacks are popped.
- Find some project under chinese characters directory.
- Open it in vscode.
- Press
F5to start debug. - Verify the program can be launched normally.
- Open a hello world project, and print
System.out.println("中文字符3323"). - Press F5 to start debug.
- Verify the output in DEBUG CONSOLE view is correctly displayed.
- Open project
simple-javain vscode, change code from line12 to line16 with following code:
for (; i <= 1000; i++) {
     if (i == 1)  {
         throw new IllegalStateException();
      }
 }
- Open debug view and tick both Uncaught exceptions and Caught exeptions
- Press F5, verify progress stop at line 14
- Press F5 again, verify following messages in debug console
Exception in thread "main" java.lang.IllegalStateException
	at com.ms.samples.App.main(App.java:14)
- Open project
25.restartFramein vscode. - Set breakpoint: Person.java line 28
- Press
F5to start debug. - The program stopped at the Person.java line 28
- Open the debug console, input
sorg, the auto complete window will pop up with intellisense support.
- Open a project in vscode, and add a logpoint. The log message is the simple text message. If you want to print the expression, you need wrap it with a curly bracket
{ javaExpression }. - Launch java debugger and continue your program.
- When the logpoint code branch is hit, it just log the message to the console and doesn't stop your program.

- Open a Hello world project in VS Code.
- Set a breakpoint.
- Press Ctrl+F5 to start without debugging.
- Verify that the program starts without hitting the breakpoint.
- Open a spring-boot project in VS Code.
- Press Ctrl+F5 to start without debugging.
- Verify that the program starts, and there is no information in "watch" and "callstack" view.
- Click the "pause" button in the toolbar, it should NOT pause the program.
- Click the "stop" button in the toolbar, it should stop the program.
- Open
26.environmentVariablesin vscode. - Press F5 to start.
- Verify the output in Debug Console should be as following:
CustomEnv: This env is for test plan.
SystemPath: <value of PATH >
- Open
27.runtimeClassEntryin vscode. - Press F5 to start.
- Verify the output in Debug Console should be as following:
Tomcat started on port(s): 8080 (http)
- Open
17.argstestin vscode. - Change the launch.json as following:
"mainClass": "test.${fileBasenameNoExtension}",
"args": [  "\"${execPath}\"",
           "${env:APPDATA}",
           "${fileExtname}",
           "${workspaceRootFolderName}"]
]
- Make a BP at line one of main method, Keep ArgsTest.java open and press F5 to start.
- Verify the
argshas the values:- "C:\Users\andxu\AppData\Local\Programs\Microsoft VS Code\Code.exe"
- "C:\Users\andxu\AppData\Roaming"
- ".json"
- "17.argstest"
- Open
17.argstestin vscode. - Change the launch.json as following:
 "mainClass": "test.ArgsTest",
 "args": ["a b", "foo \\\"bar"],
 "vmArgs": ["-Xms64M",  "-Xmx128M",  "-Dfoo= \\bar"]
- Add the following statement to get the properties:
String foo = (String) System.getProperties().get("foo");
-
Press F5 to verify the variables should be like this:


- Open
longclasspathproject in VS Code. - Append the following config to the launch.json:
"shortenCommandLine": "none"
- Click Run or Debug CodeLens.
- On Windows, it should pop up an error box saying "CreateProcess error"=206, The filename or extension is too long".
- On Linux and Macos, it may succeed.
- On Windows/Linux/Macos, modify the launch.json with the following combinations. Click Run/Debug both should succeed.
  "shortenCommandLine": ""/"auto"/"jarmanifest"/"argfile", // argfile requires your Java version is 9 and higher.
  "console": ""/"internalConsole"/"integratedTerminal"/"externalTerminal"
- Open
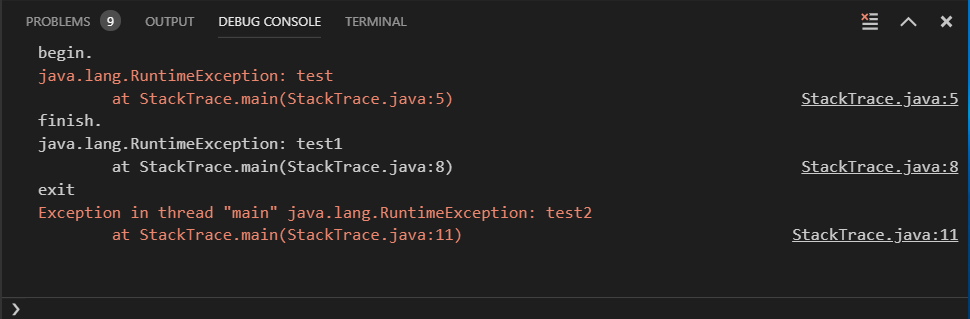
28.debugfeaturesproject in VS Code. - Open
StackTrace.javafile. - Click Run or Debug CodeLens, check the DEBUG CONSOLE. It's expected to render the source link for each stack trace line, and clicking the link should open the associated Java file in the editor.
- Open
28.debugfeaturesproject in VS Code. - Open
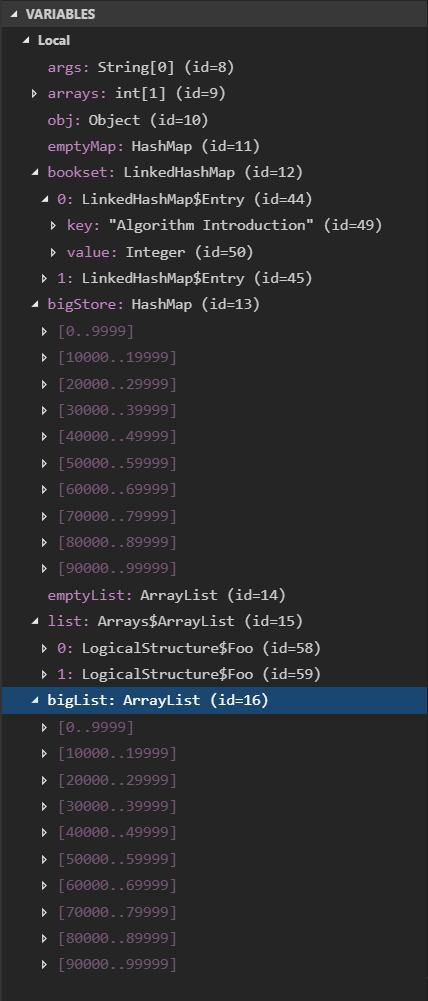
LogicalStructure.javafile, and add a breakpoint at line 30. - Click Debug CodeLens, check the Variable viewlet.
- emptyMap - non-expandable
- bookset - Show two children (0: LinkedHashMap$Entry, 1: LinkedHashMap$Entry)
- bigStore - Lazy loading the children and show the index range first
[0..9999]... - emptyList - non-expandable
- list - Show two children (0: LogicalStructure$Foo, 1: LogicalStructure$Foo).
- bigList - Lazy loading the children and show the index range first
[0..9999]...
- Install JDK-12.
- Open
28.debugfeaturesproject in VS Code, and openJava12Preview.javafile. - Uncomment
"java.home"in./vscode/settings.json. - Run VS Code commmand
Java: clean Java language server workspace, and clickRestart and deletebutton in the prompted message box to reload VS Code. - Add a breakpoint at line 7 of
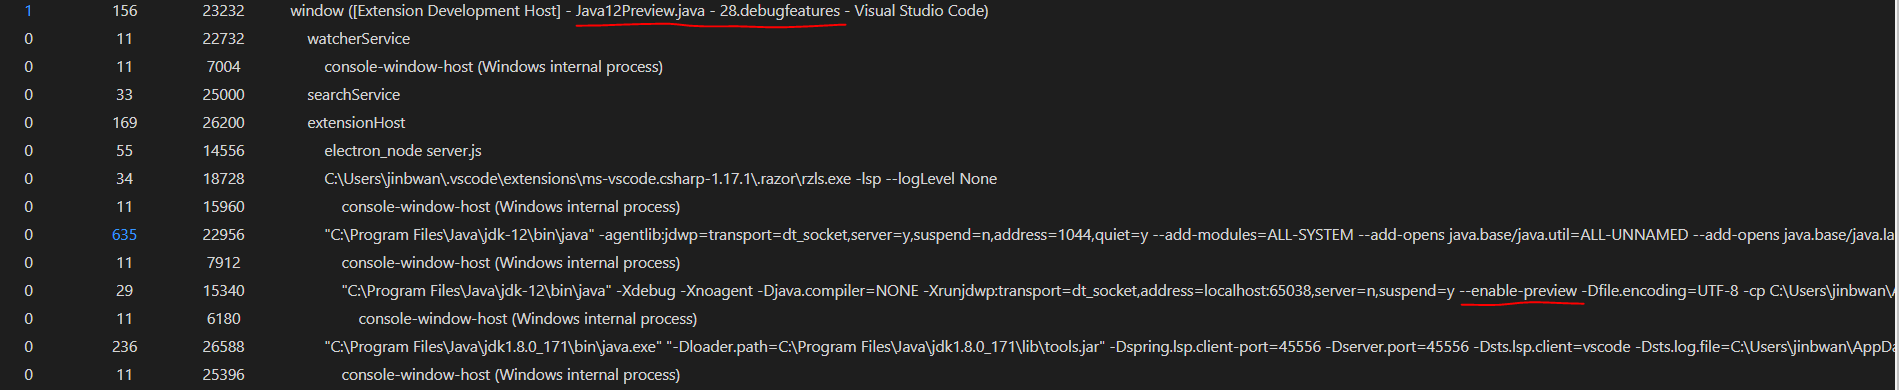
Java12Preview.java, and click Debug CodeLens. The debugger should run successfully. - Open VS Code menu
Help -> Open Process Explorer, find the Java Debuggger process in theProcess Explorer. And its command line string should contain--enable-previewflag.