Skip to content
New issue

Have a question about this project? Sign up for a free GitHub account to open an issue and contact its maintainers and the community.

By clicking “Sign up for GitHub”, you agree to our terms of service and privacy statement. We’ll occasionally send you account related emails.

Already on GitHub? Sign in to your account

[discussion] Considering relevant attributes from Graal for Visualization #6

Closed
inishchith opened this issue Jun 6, 2019 · 8 comments
Labels
coding-period-one task completed during coding period #1 high-priority urgency, due for a long time ready work completed, minor meta related work left

Comments

@inishchith
Copy link
Owner

WRT Integration Task: Graal with ELK

@valeriocos @jgbarah @aswanipranjal: This issue thread is for discussion related to what attributes from the results produced by Graal are relevant and should be considered for visualization and creation of dashboards.


Note:

  1. Currently, the integration task is conducted for CoCom backend only, so the attributes in consideration are -
analysis = [
...
 {
  "ccn": 19,
  "avg_ccn": 2.111111111111111,
  "avg_loc": 9.11111111111111,
  "avg_tokens": 64,
  "num_funs": 9,
  "loc": 129,
  "tokens": 786,
  "ext": "py",
  "blanks": 48,
  "comments": 63,
  "file_path": "graal/codecomplexity.py"
}
...
]
@inishchith
Copy link
Owner Author

@valeriocos @jgbarah @aswanipranjal As per our last meeting ( on Friday, 7th June ).
We had thought to visualize changes over some of the above attributes over a (configurable) amount of time. I'd be working on it this week ( as discussed ) and ask doubts/questions here ( if any)

Any thoughts or suggestions on it?

Thanks!

@inishchith inishchith added coding-period-one task completed during coding period #1 high-priority urgency, due for a long time in-progress currently being worked on labels Jun 9, 2019
@inishchith
Copy link
Owner Author

[ As we can see the above-referenced issues ]

[analyzer] Fix results for deleted files: chaoss/grimoirelab-graal#35

There were some issues/redundancy in the results retrieved from the (CoCom) Backend, which can be fixed via this issue.

[cocom] Evaluating results with repository level analysis: chaoss/grimoirelab-graal#36

We had discussed of visualizing some of the attributes for a given repository on a given point of time. There could be two approaches:

  • The current implementation of Graal's CoCom Backend produces results over the files affected for a given commit, Hence, in order to produce the visualization, we have to pick the last updated values of all the files and perform sum total of the particular attribute, which would be a bit complex to implement in Kibana. ( though we've been discussing how to implement this efficiently ).
  • Alter the current implementation of Graal's CoCom Backend to have an option to produce results at the repository level, which would make it easier to implement the visualization along with the evolution of the attribute (using serial diff). The above issue is for the evaluation of this idea ( which will also be discussed in this week's meeting. (Friday)

@valeriocos Please let me know in case I missed something out. Thanks :)

@inishchith
Copy link
Owner Author

@valeriocos @aswanipranjal @jgbarah

I've worked on the repository level analysis and could produce the following results ( which can be
further improved after some discussion )

Repository: chaoss/grimoirelab-perceval


[ Total Lines of Code at a given point of time ( here per month ) ]

Screenshot 2019-06-12 at 7 46 50 PM


[ Total Code Complexity at a given point of time ( here per month ) ]

Screenshot 2019-06-12 at 7 48 09 PM

@inishchith
Copy link
Owner Author

Using Kibana's TimeLion + Analysis data (Repository Level)

[ Code Complexity per week ]

Screenshot 2019-06-13 at 11 23 55 PM


[ Code Complexity v/s Lines of Code per week ]

Screenshot 2019-06-13 at 11 24 35 PM

@valeriocos
Copy link

Thank you @inishchith , did you try to use timelion with the non repository-level data?

@inishchith
Copy link
Owner Author

@valeriocos Sorry for the delayed response.
The idea was to sum the values of the latest data. Yes, I did try it, but couldn't get the configuration correctly. I'm still looking up for related examples

@inishchith
Copy link
Owner Author

inishchith commented Jun 18, 2019

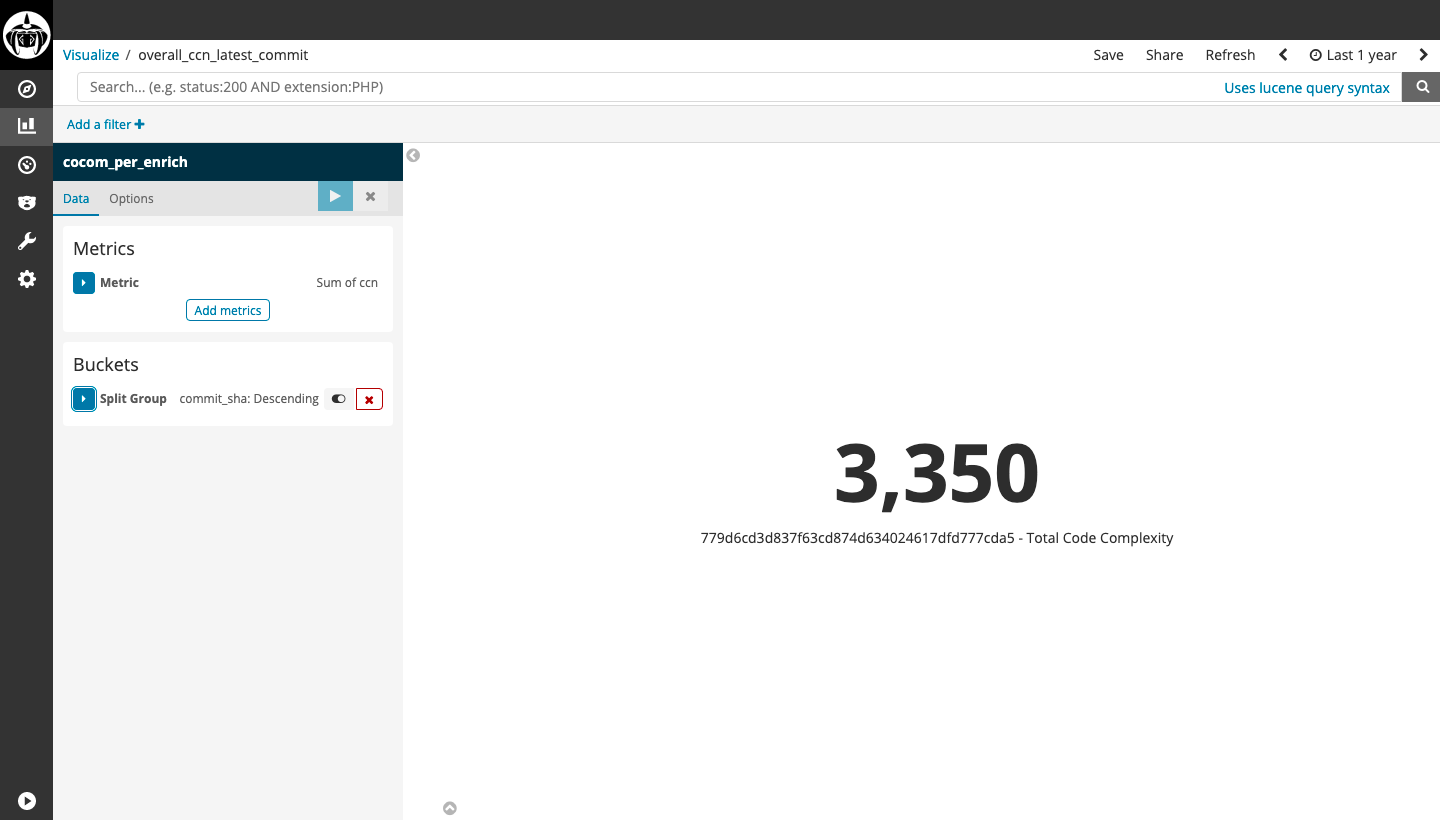
In reference to the repository-level analysis using lizard. ( REF. chaoss/grimoirelab-graal#38 (comment))

Repository: chaoss/grimoirelab-perceval

[ Total Lines of Code after latest commit]

Screenshot 2019-06-18 at 11 44 44 AM


[ Total Code Complexity after latest commit ]

Screenshot 2019-06-18 at 11 45 38 AM


[ Most Complex files after latest commit ]

Screenshot 2019-06-18 at 4 11 30 PM

(issue with the above is that the latest commit analysis contains results of all the files. hence the changes cannot be tracked down to which commit made it more complex ( evolution ) )

@inishchith inishchith added ready work completed, minor meta related work left and removed in-progress currently being worked on labels Jun 25, 2019
@inishchith
Copy link
Owner Author

closing in reference #11

Sign up for free to join this conversation on GitHub. Already have an account? Sign in to comment
Labels
coding-period-one task completed during coding period #1 high-priority urgency, due for a long time ready work completed, minor meta related work left
Projects
None yet
Development

No branches or pull requests

2 participants