Skip to content
New issue

Have a question about this project? Sign up for a free GitHub account to open an issue and contact its maintainers and the community.

By clicking “Sign up for GitHub”, you agree to our terms of service and privacy statement. We’ll occasionally send you account related emails.

Already on GitHub? Sign in to your account

CLion's debugger doesn't show stdlib source code when using LLDB #4924

Closed
artemmukhin opened this issue Feb 6, 2020 · 3 comments
Closed
Assignees
Labels
bug subsystem::debugger Issues related to debugger

Comments

@artemmukhin
Copy link
Member

artemmukhin commented Feb 6, 2020

Environment

  • IntelliJ Rust plugin version: 0.2.115.2157-193
  • Rust toolchain version: 1.41.0 (5e1a79984 2020-01-27) x86_64-apple-darwin
  • IDE name and version: CLion 2019.3.3 (CL-193.6015.37)
  • Operating system: macOS 10.15.2

Problem description

CLion shows disassembly code instead of showing stdlib source code while debugging Rust project with LLDB.

The corresponding issue in YT: https://youtrack.jetbrains.com/issue/CPP-18915

Hotfix

Put the following line in your ~/.lldbinit:

settings set target.source-map /rustc/<COMMIT_HASH>/ <RUSTUP_HOME>/toolchains/<TOOLCHAIN>/lib/rustlib/src/rust/

where:

  • RUSTUP_HOME = $ rustup show home
  • COMMIT_HASH = $ rustc -Vv | grep commit-hash | cut -d' ' -f 2
  • TOOLCHAIN = $ rustup toolchain list | grep '(default)' | cut -d' ' -f 1

Example:

settings set target.source-map /rustc/5e1a799842ba6ed4a57e91f7ab9435947482f7d8/ /Users/user/.rustup/toolchains/stable-x86_64-apple-darwin/lib/rustlib/src/rust

CLion will automatically apply .lldbinit before each debug session.

@artemmukhin artemmukhin added subsystem::debugger Issues related to debugger bug labels Feb 6, 2020
@artemmukhin artemmukhin self-assigned this Feb 6, 2020
@oleg-andreyev
Copy link

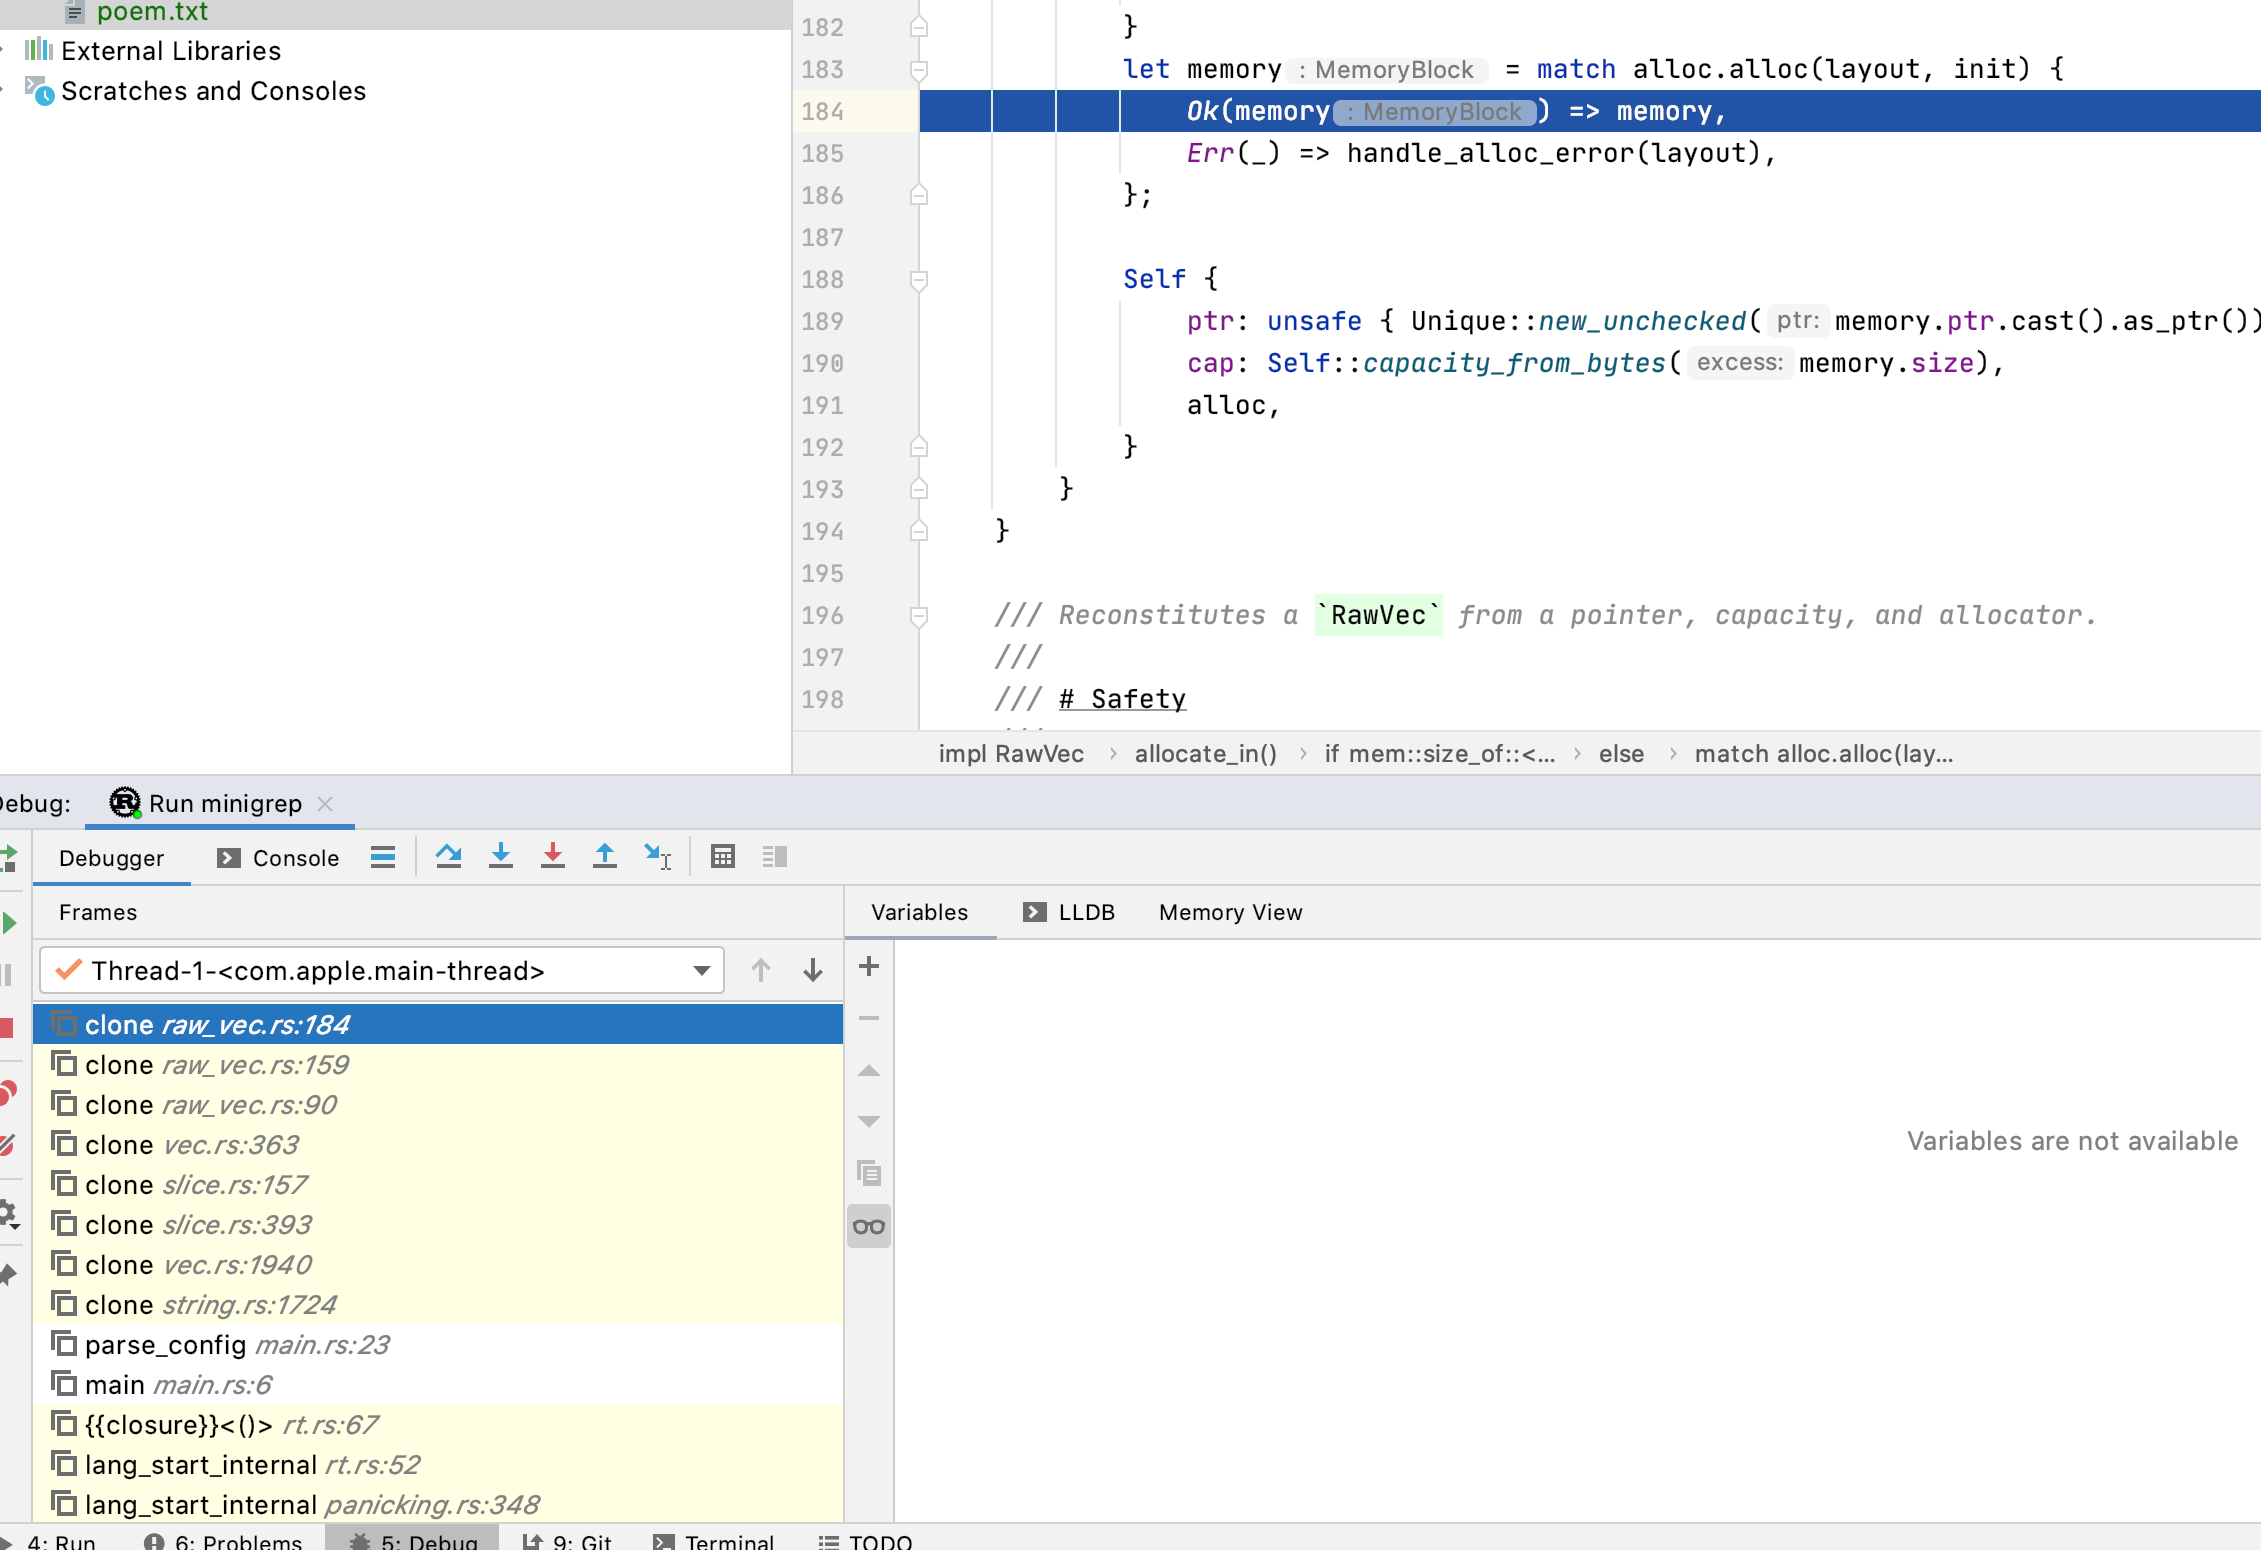
Not sure if it's related but I've noticed that CLion sometimes cannot collect variables
image

@RiseAndCry
Copy link

I've noticed that this only happens if i use the proposed "Fast compille times" from the bevy installation instructions (https://bevyengine.org/learn/book/getting-started/setup/)

the cargo run --features bevy/dynamic part to be more precise. I i don't use dynamic linking, debugging works fine.

@artemmukhin
Copy link
Member Author

I cannot reproduce this issue anymore on CLion 2021.1. Probably, it was fixed by some of the recent CLion's LLDB updates. So now stepping into stdlib code or setting breakpoints in stdlib sources should work fine with LLDB, on both macOS and Linux.

@RiseAndCry That's interesting. I've tried to debug a very simple dylib crate, and stepping into stdlib worked as expected. Could you please open a separate issue via Help | Create New Issue dialog right from the IDE to provide the information about your environment? Also, it would be helpful if you provide the output of (lldb) image list command executed via LLDB console on any breakpoint. I suppose it should contain a path to stdlib, like this:

[X] XXXXXXXX-XXXX-XXXX-XXXX-XXXXXXXXXXXX 0xXXXXXXXXXXXXXXXX ~/.rustup/toolchains/stable-x86_64-apple-darwin/lib/rustlib/x86_64-apple-darwin/lib/libstd-9225b8e469c32698.dylib 

Sign up for free to join this conversation on GitHub. Already have an account? Sign in to comment
Labels
bug subsystem::debugger Issues related to debugger
Projects
None yet
Development

No branches or pull requests

3 participants