Prediction and function values not aligning #269
Comments
|
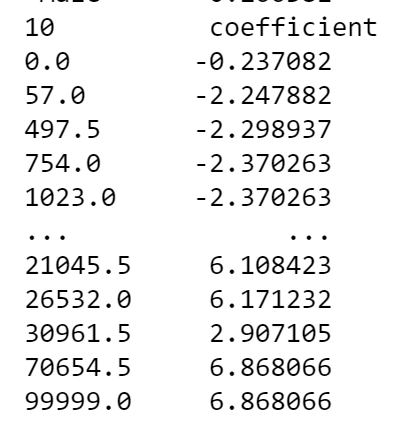
HI @lukedex, Great question, and cool idea about building a rating table. Internally, this is exactly what EBM does to make predictions, so I am a bit surprised there is a mismatch! At first glance, it could be that you're missing the Another question for you: How do your rating tables handle continuous attributes where each levels of a feature is defined in a range? Are they able to "binary search" for the true input value? This might be another potential source of error (and is typically prone to off-by-one errors). For continuous features, the EBM "lookup tables" are defined by edges of bins. When converted with your code, it would looks something like this:
Just want to make sure these types of attributes can easily be handled by your downstream software. Happy to continue looking into this with you and help you get to a solution! -InterpretML Team |
|
Thanks for such a swift reply. Glad to know I wasn't going crazy on how EBMs are working. One thing I forgot to mention is that I set interactions = 0 when building the model just to ensure that couldn't cause any issues. I am finding the intercept manually from the local explanation figure and adding that in separately. I've found my version of the predictions are anywhere from 2-10 times the actual prediction output by ebm.predict(). My solution for continuous features was to take the coefficient of the level immediately below my level (therefore the lower bound). So if my value was '2' it would search for the highest level which is less than or equal to 2 and take the coefficient for that level. Would there be an easy way that I could obtain the coefficients used in the ebm.predict() function for a single row so I can check where the differences are? |
|
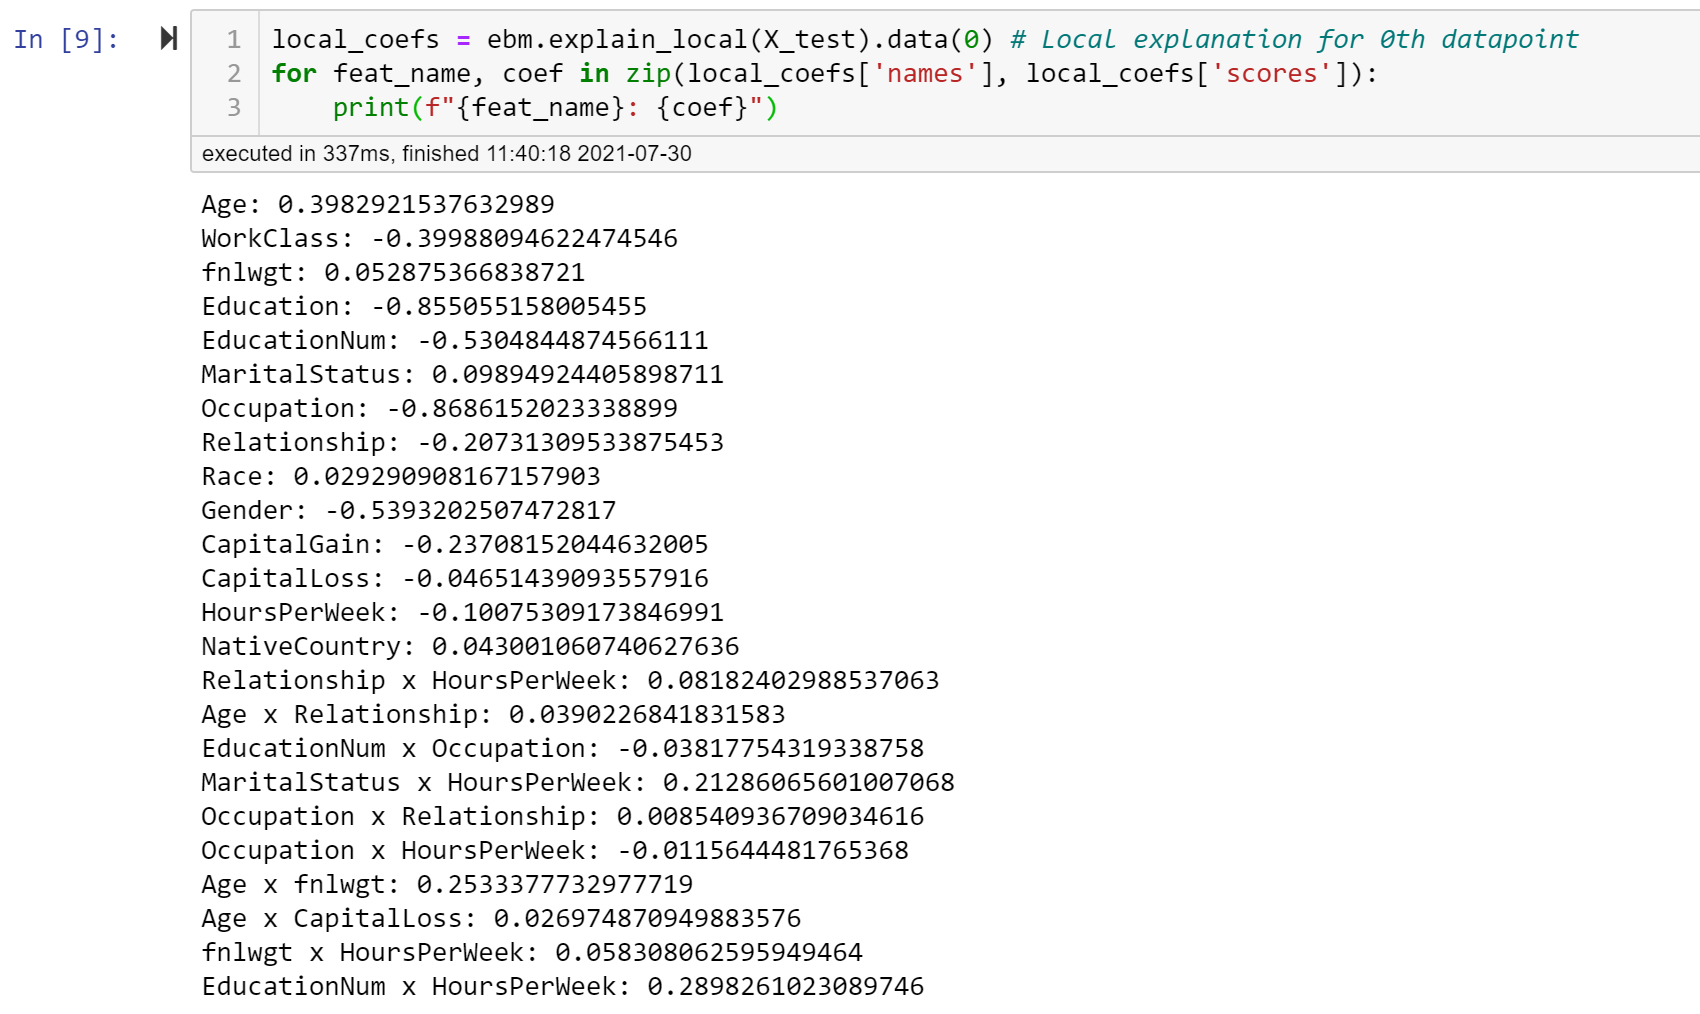
Hi Luke, Wanted to confirm that setting The best way to sanity check the contributions for a single row is to use the
And here's the code snippet for you as well: local_coefs = ebm.explain_local(X_test).data(0) # Local explanation for 0th datapoint on X_test
for feat_name, coef in zip(local_coefs['names'], local_coefs['scores']):
print(f"{feat_name}: {coef}")Hope this helps debug a bit! |
|
Ahh, that has helped so much thank you, they now match up perfectly. One more question.. From my example code at the start, is there a more efficient way to extract the coefficients rather than using ebm.explain_global().visualize(i)? I did check ebm.explain_global().data(i) but had issues with consistency between binary factors and continuous ones. I haven't actually used categorical features as I didn't know EBMs could take them. How are categorical features treated? |
Hello,
I hope I haven't misunderstood how EBMs work with this but feel I may have..
I'm trying to re-create an EBM using a 'rating table'. So the format of this rating table has a coefficient value for each level of a factor and to produce a prediction you would add the coefficient values from each factor together (along with the intercept).
I've tried this with a row in my dataset but obtained the prediction using ebm.predict() as 0.067147 where as my method of summing up the values from my rating table has produced 0.32687.
This is my code for extracting the values (please bare with me as my python skills are lacking...):
I use the visualize function to get the value of each level of a factor and then make sure that if the level is binary that it doesn't error. I did try calling .data() instead but ran into problems. Once these set of .csv's are created I then have a function which looks through the .csv's and pulls out the relevant coefficient per factor and sums them.
for i in range(len(X_test.columns)): trace = ebm.explain_global().visualize(i) if len(trace['data']) > 2: df_ = pd.DataFrame(index=list(trace['data'][1]['x']), columns=['coefficient'], data = trace['data'][1]['y']) else: df_= pd.DataFrame(index=list(trace['data'][0]['x']), columns=['coefficient'], data = trace['data'][0]['y']) df_.to_csv(f'model_coefficients\\{X_test.columns[i]}.csv')The purpose of this approach is to make models which are implementable in my line of work which currently can only accept .csv's for rating tables. I love the interpretability of EBMs and the power they provide compared to the currently used GLMs.
Can someone please advise why this approach isn't working?
The text was updated successfully, but these errors were encountered: