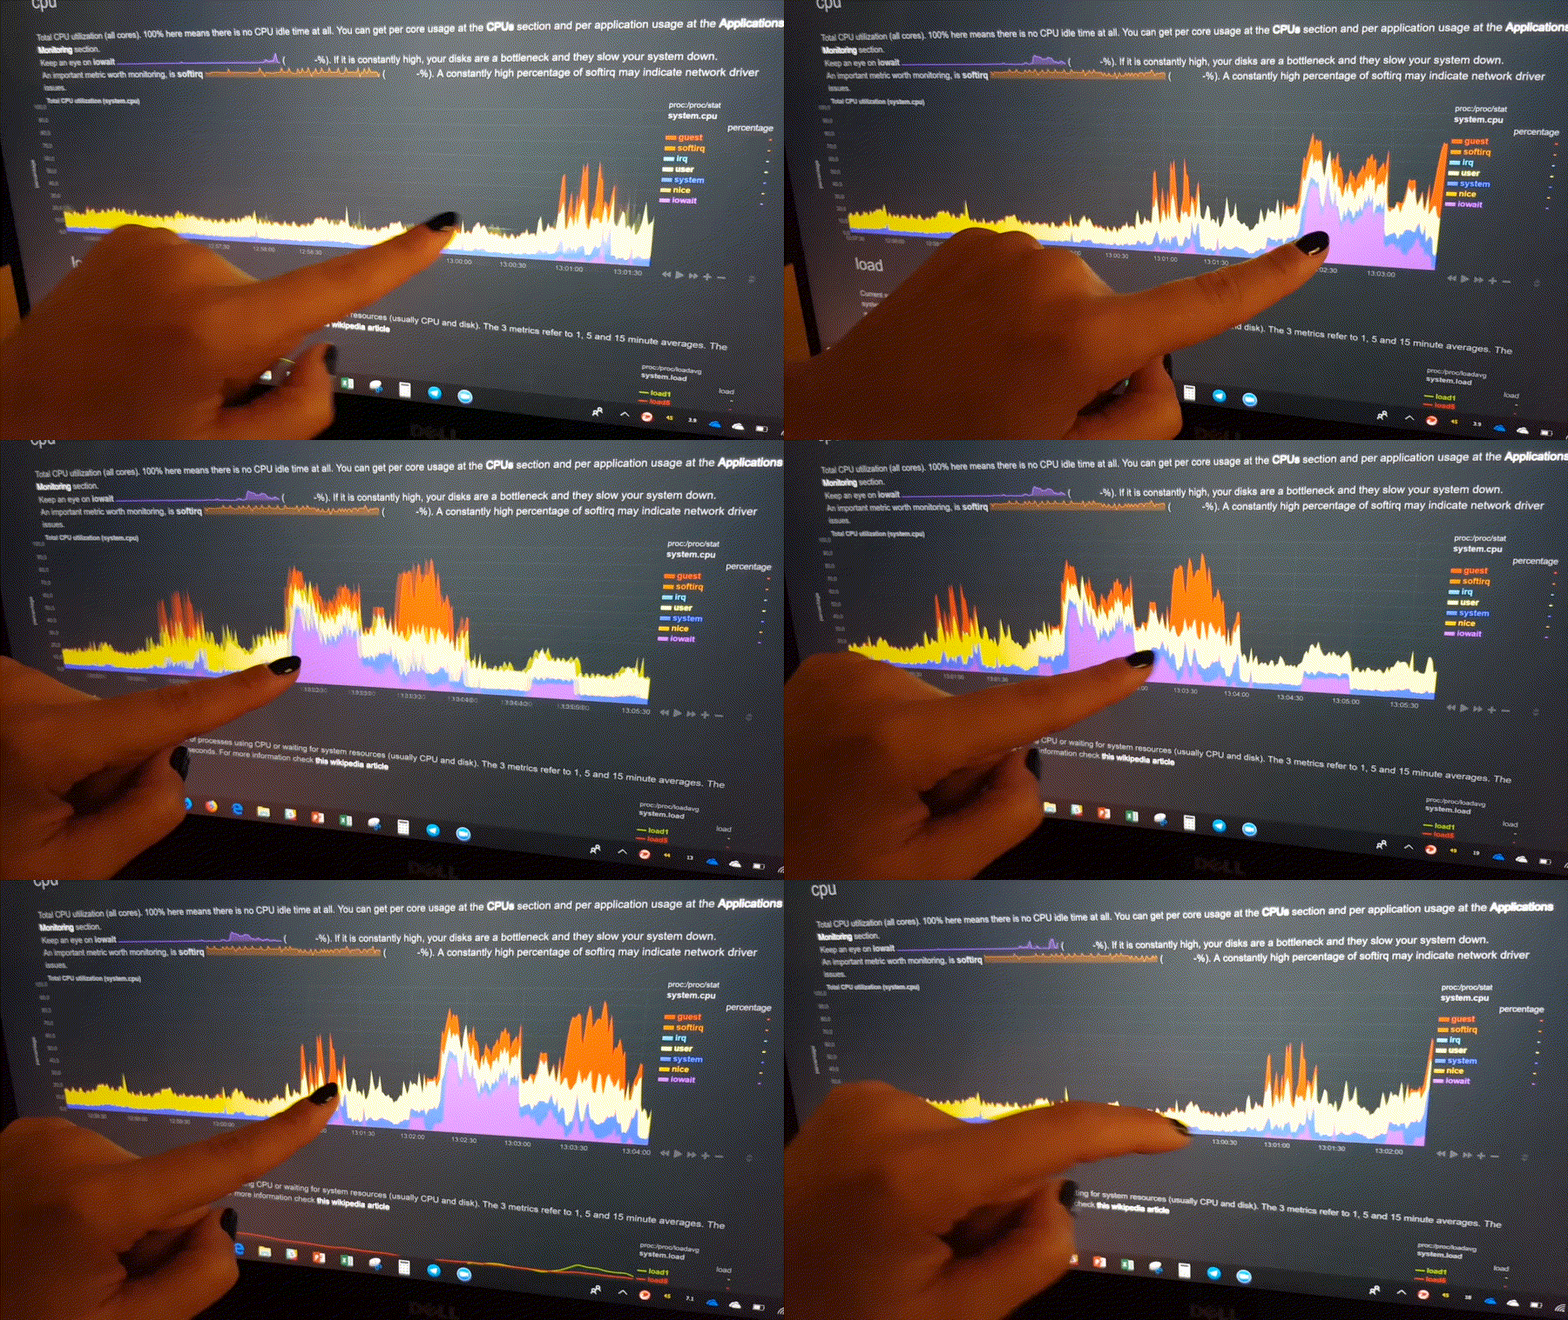
Netdata is real-time health monitoring and performance troubleshooting for systems and applications. It helps you instantly diagnose slowdowns and anomalies in your infrastructure with thousands of metrics, interactive visualizations, and insightful health alarms.
Welcome! You've arrived at the documentation for Netdata. Use the links below to find answers to the most common questions about Netdata, such as how to install it, getting started guides, basic configuration, and adding more charts. Or, explore all of Netdata's documentation using the table of contents to your left.
Use our automated one-line installation script to install Netdata on Linux systems or find detailed instructions for binary packages, Kubernetes, Docker, macOS, and more.
Take a guided tour through each of Netdata's core features—perfect for beginners. Follow detailed instructions to monitor your systems and apps, and start your journey into performance troubleshooting.
Have some monitoring and system administration experience? Dive right into configuring Netdata, accessing the dashboard, working with the daemon, and changing how Netdata stores metrics.
Netdata Cloud: Use Netdata Cloud and the Nodes View to view real-time, distributed health monitoring and performance troubleshooting data for all your systems in one place. Add as many nodes as you'd like!
Advanced users: For those who already understand how to access a Netdata dashboard and perform basic configuration, feel free to see what's behind any of these other doors.
- Netdata Behind Nginx: Use an Nginx web server instead of Netdata's built-in server to enable TLS, HTTPS, and basic authentication.
- Add More Charts: Enable new internal or external plugins and understand when auto-detection works.
- Performance: Tips on running Netdata on devices with limited CPU and RAM resources, such as embedded devices, IoT, and edge devices.
- Streaming: Information for those who want to centralize Netdata metrics from any number of distributed agents.
- Backends: Learn how to archive Netdata's real-time metrics to a time series database (like Prometheus) for long-term archiving.
Visit the contributing guide, contributing to documentation guide, and documentation style guide to learn more about our community and how you can get started contributing to Netdata.
<script charset="utf-8" type="text/javascript" src="//js.hsforms.net/forms/shell.js"></script> <script> hbspt.forms.create({ portalId: "4567453", formId: "6a20deb5-a1e6-4312-9c4d-f6862f947fe0" }); </script>