Research Project aboiut integrating Modsecurity log with ELK-Stack (Elastic Search, Logstash, and Kibana ) as Web Dashboard i.e GUI for analysing the log and manage them as statistical graph based on the real time attacks.
- Install ModSecurity 2.x in your machine and configure the SecAuditLogType as
Serial - Configure SecAuditLog
/var/log/modsecurity/audit/modsec_audit.json - Dowload ELK latest version or 5.4.0 tar archieve or install it in machine
Note: I tried with 5.4.0 version by downloading the tar file and running it directly in my machine, it was working fine. I am not sure about lastest version.
 - Elasticsearch-5.4.0
 - Kibana-5.4.0
 - logstash-5.4.0
- Create Logstash cofig file and provide the following config with log path as mention below
   input {
       file{
           type => "modsecurity"
           path => ["/var/log/modsecurity/audit/modsec_audit.json"]
           start_position => beginning
       }

  }
  filter {
    json {
   source => "message"
  }
  }

  output {
       elasticsearch {
           hosts => "localhost"
           index => "logstash.json"
       }

       stdout {
           codec => rubydebug
       }
   }
- Run Elastic Search binary directly from bin directory i.e /**/elasticsearch-5.4.0/bin or start the service if you have installed it
- Run Kibana binary directly from bin directory with sudo i.e /**/kibana-5.4.0-linux-x86_64/bin or start the service if you have installed it.
- Run the Logstash binary with option -f providing your logstash config file location with sudo if required.
- Check the status Elastic Search, Kibana & Logstash in terminal if you are running directly as binary.
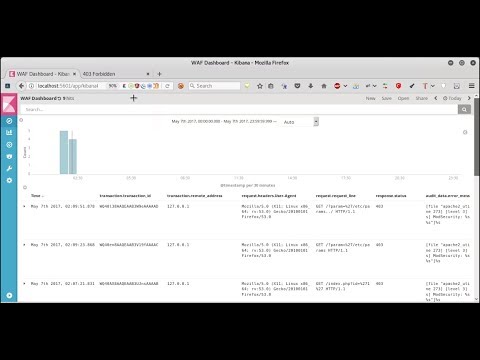
- Go to http://localhost:5601/ (Kibana UI)
- Click Management section and select index pattern
- Click add button and provide pattern as
*and click create. - Go to dashboard section and click your index pattern.
- Select required field to show in dashboard from avaiable field secction and click add.
- Start testing the Web application with malicious payload, which will be logged by modsecurity.
- ModSecurity log event will be indexed by kibana and will be show in dashboard as real time.
Email address: umarfarookmech712@gmail.com for more details.